. 2024 Nov 12;13(1):112.
doi: 10.1186/s40164-024-00579-3.

Prospective pharmacotyping of urothelial carcinoma organoids for drug sensitivity prediction - feasibility and real world experience

Affiliations

Prospective pharmacotyping of urothelial carcinoma organoids for drug sensitivity prediction - feasibility and real world experience

Michael Karl Melzer et al. Exp Hematol Oncol. .

Abstract

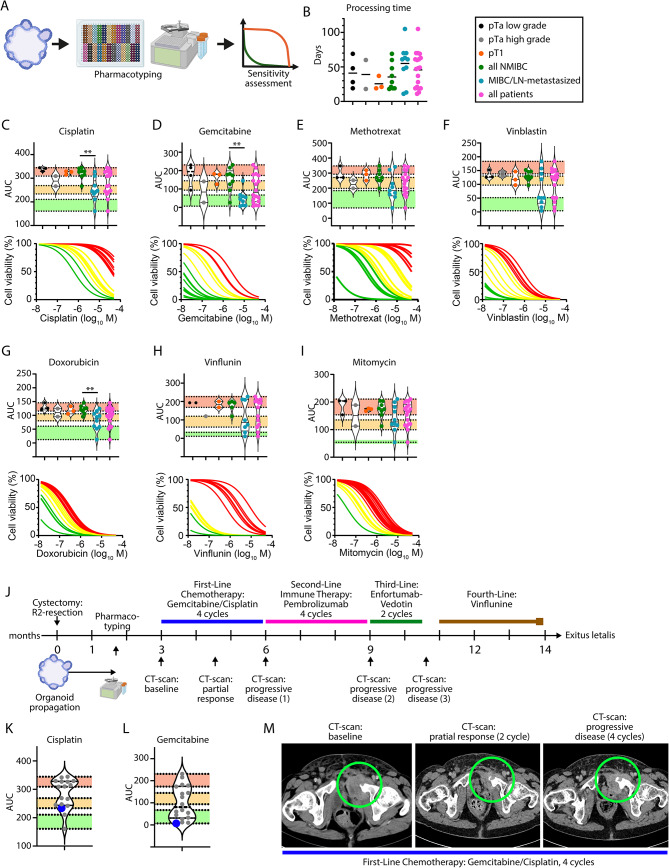
Urothelial carcinoma (UC) of the urinary bladder has significant challenges in treatment due to its diverse genetic landscape and variable response to systemic therapy. In recent years, patient-derived organoids (PDOs) emerged as a novel tool to model primary tumors with higher resemblance than conventional 2D cell culture approaches. However, the potential of organoids to predict therapy response in a clinical setting remains to be evaluated. This study explores the clinical feasibility of PDOs for pharmacotyping in UC. Initially, we subjected tumor tissue specimens from 50 patients undergoing transurethral resection or radical cystectomy to organoid propagation, of whom 19 (38%) yielded PDOs suitable for drug sensitivity assessment. Notably, whole transcriptome-based analysis indicated that PDOs may show phenotypes distinct from their parental tumor tissue. Pharmacotyping within a clinically relevant timeframe [mean of 35.44 and 55 days for non-muscle invasive bladder cancer (NMIBC) and muscle invasive bladder cancer (MIBC), respectively] was achieved. Drug sensitivity analyses revealed marked differences between NMIBC and MIBC, with MIBC-derived organoids demonstrating higher chemosensitivity toward clinically relevant drugs. A case study correlating organoid response with patient treatment outcome illustrated the complexity of predicting chemotherapy efficacy, especially considering the rapid acquisition of drug resistance. We propose a workflow of prospective organoid-based pharmacotyping in UC, enabling further translational research and integration of this approach into clinical practice.

Keywords: Patient-derived organoids; Pharmacotyping; Urothelial carcinoma.


Conflict of interest statement

Declarations Ethics approval and consent to participate Patients were enrolled between 2022 and 2023. The project was approved by the local ethics committee (project number 239/18), and written informed consent was obtained from all patients. Consent for publication Consent for publication was given during the initial signature for informed consent. The patient of the case report part has meanwhile passed away. Competing interests The authors declare no competing interests.

Figures

Fig. 1
Fig. 1
Patient characteristics of recruited patients. (A) Schematics of workflow starting at patient recruitment and leading to phenotypic characterization, pharmacotyping, and live cell imaging of propagated organoids. (B) Pie chart of recruited patients (n = 104). (C) Age and sex distribution of pharmacotyped patients (n = 20). (D) Pie chart for operation type of pharmacotyped patients (n = 20). (E) Pie chart for highest tumor stage of pharmacotyped patients, assessed by pathological examination (n = 20). (F) Bar chart of maximum documented passage of organoids (n = 50). (G) Principal component analysis of the top 1000 most variable genes from indicated organoid and respective tumor samples (n = 8). Colors indicate individual in the upper graphs and MIBC subtype in the lower graphs. (H) Heatmap of the top 10 genes for the first three principal components. (I) Gene set enrichment analysis for the top 15 up and downregulated gene sets in the gene-ontology- biological process dataset (tumor vs. organoids). (J) Transcriptome-based cell type deconvolution with the EPIC package in 8 organoid and respective tumor samples. (K) Transcriptome-based classification of MIBC subtype before and after regression for cell type composition. (L) Representative immune-histology stainings for Ki-67 in the 2 indicated organoid lines with corresponding tumors. Scale bars indicate 100 μm. (M) Percentage of Ki-67-positive cells in organoids and tumors. Significance was calculated with a paired t-test (***=p < 0.001, n = 11). Ba/Sq, basal-squamous, GO-BP, gene-ontology biological process, LN, lymph node, LumP, luminal papillary, LumU, luminal unstable, MIBC, muscle-invasive bladder cancer, NE-like, neuroendocrine like, pTa, papillary tumor, TURBT, transurethral resection of bladder tumor
Fig. 2
Fig. 2
Pharmacotyping of urothelial cancer organoids. (A) Schematics of pharmacotyping for urothelial cancer patient-derived organoids. (B) Processing time in days of PDOs from sample acquisition to pharmacotyping result depicted for distinct tumor stages and NMIBC, MIBC and all samples (n = 19). (C) Violinplots for the AUC and dose-response curves for Cisplatin (n = 17). (D) Violinplots for the AUC and dose-response curves for Gemcitabine (n = 18). (E) Violinplots for the AUC and dose-response curves for Methotrexate (n = 17). (F) Violinplots for the AUC and dose-response curves for Vinblastin (n = 18). (G) Violinplots for the AUC and dose-response curves for Doxorubicin/Adriamycin (n = 18). (H) Violinplots for the AUC and dose-response curves for Vinflunin (n = 13). (I) Violinplots for the AUC and dose-response curves for Mitomycin (n = 18). (J) Schematics of treatment course of the respective patient. (K) Violinplot for the AUC values of Cisplatin. The respective patient is highlighted in blue. (L) Violinplot for the AUC values of Gemcitabine. The respective patient is highlighted in blue. (M) Exemplary CT-scans (venous phase) of the R2-resection area at the symphysis at baseline (before chemotherapy), after 2 and 4 cycles of treatment with gemcitabine/cisplatin. The green circle indicates the tumor mass at the symphysis. Jenks Natural-Breaks method was employed to separate sensitive (green), intermediate (yellow), and resistance (red) PDOs and attribute them to one group. Mann-Whitney test was employed for the comparison of NMIBC and MIBC groups to determine significance levels. p < 0.05=*, p < 0.01=**. AUC, area under the curve, MIBC, muscle-invasive bladder cancer, NMIBC, non-muscle-invasive bladder cancer

References

    1. Rahib L, Wehner MR, Matrisian LM, Nead KT. Estimated projection of US Cancer incidence and death to 2040. JAMA Netw Open. 2021;4:e214708–214708. 10.1001/jamanetworkopen.2021.4708. - PMC - PubMed
    1. Babjuk M, et al. European Association of Urology Guidelines on non–muscle-invasive bladder Cancer (Ta, T1, and carcinoma in situ). Eur Urol. 2022;81:75–94. 10.1016/j.eururo.2021.08.010. - PubMed
    1. Alfred Witjes J, et al. European Association of Urology Guidelines on muscle-invasive and metastatic bladder Cancer: Summary of the 2023 guidelines. Eur Urol. 2023. 10.1016/j.eururo.2023.08.016. - PubMed
    1. Mullenders J, et al. Mouse and human urothelial cancer organoids: a tool for bladder cancer research. Proc Natl Acad Sci USA. 2019. 10.1073/pnas.1803595116. - PMC - PubMed
    1. Lee SH, et al. Tumor evolution and drug response in patient-derived Organoid models of bladder Cancer. Cell. 2018;173:515–28..e517. 10.1016/j.cell.2018.03.017. - PMC - PubMed