

Dietary bile acids supplementation protects against Salmonella Typhimurium infection via improving intestinal mucosal barrier and gut microbiota composition in broilers
- PMID: 39533418
- PMCID: PMC11555931
- DOI: 10.1186/s40104-024-01113-5
Dietary bile acids supplementation protects against Salmonella Typhimurium infection via improving intestinal mucosal barrier and gut microbiota composition in broilers
Abstract
Background: Salmonella Typhimurium (S. Typhimurium) is a common pathogenic microorganism and poses a threat to the efficiency of poultry farms. As signaling molecules regulating the interaction between the host and gut microbiota, bile acids (BAs) play a protective role in maintaining gut homeostasis. However, the antibacterial effect of BAs on Salmonella infection in broilers has remained unexplored. Therefore, the aim of this study was to investigate the potential role of feeding BAs in protecting against S. Typhimurium infection in broilers.
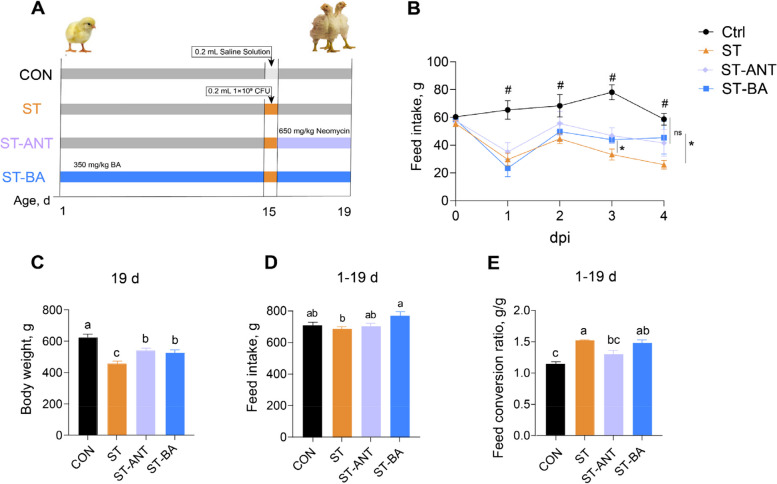
Methods: A total of 144 1-day-old Arbor Acres male broilers were randomly assigned to 4 groups, including non-challenged birds fed a basal diet (CON), S. Typhimurium-challenged birds (ST), S. Typhimurium-challenged birds treated with 0.15 g/kg antibiotic after infection (ST-ANT), and S. Typhimurium-challenged birds fed a basal diet supplemented with 350 mg/kg of BAs (ST-BA).
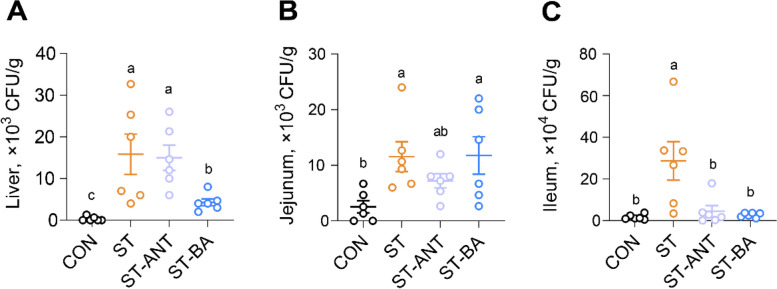
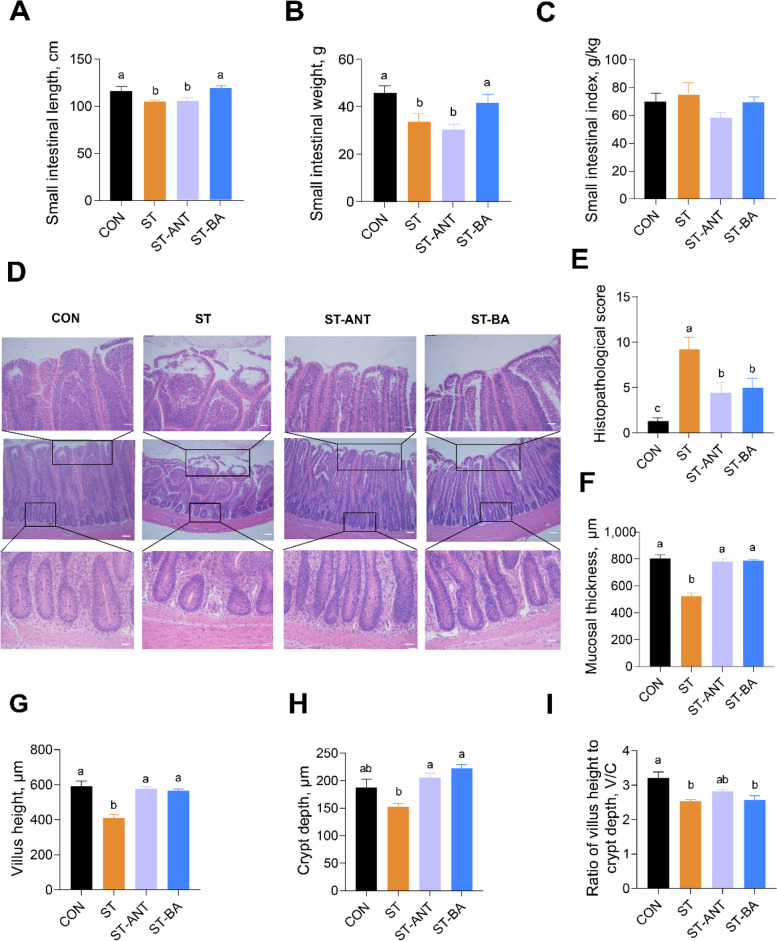
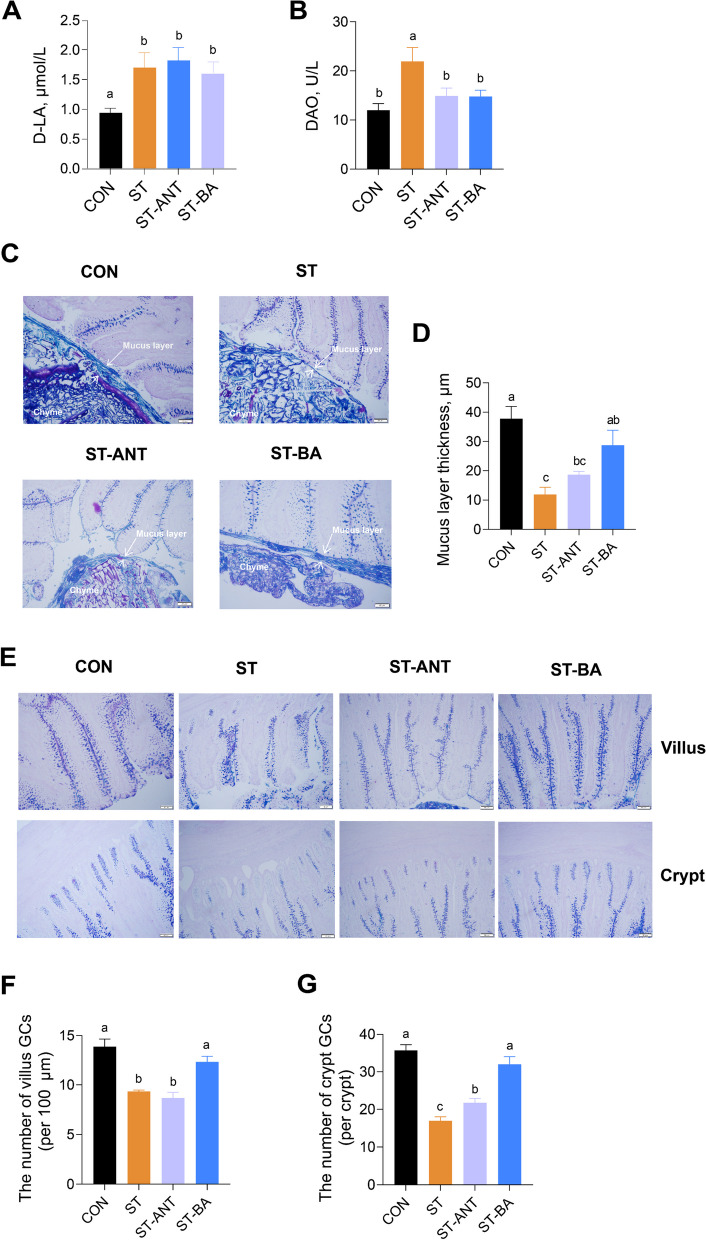
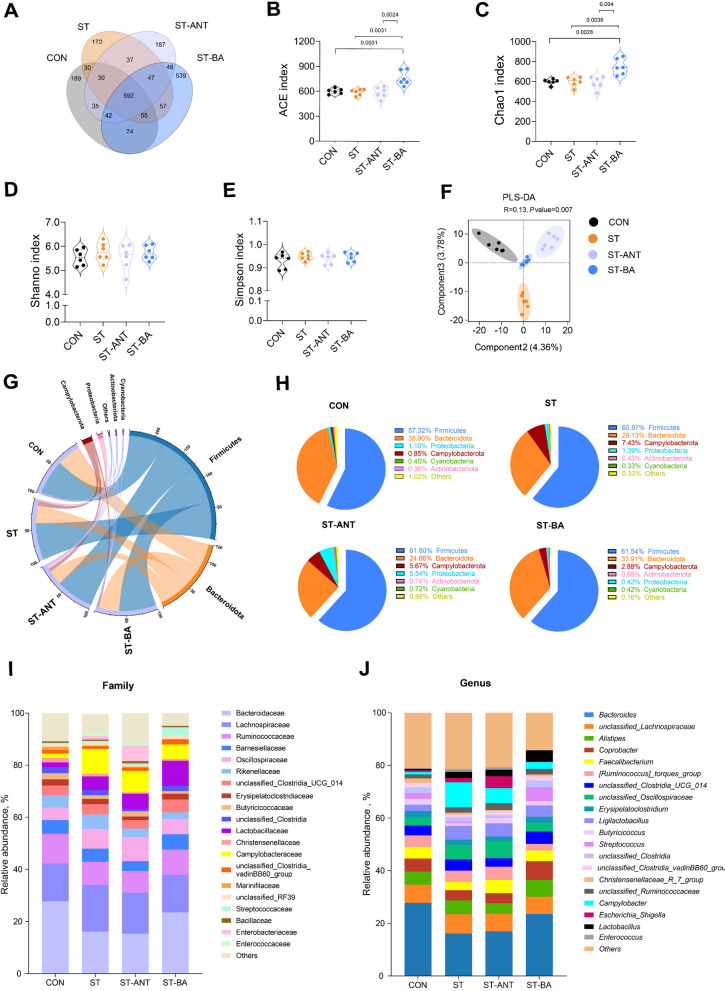
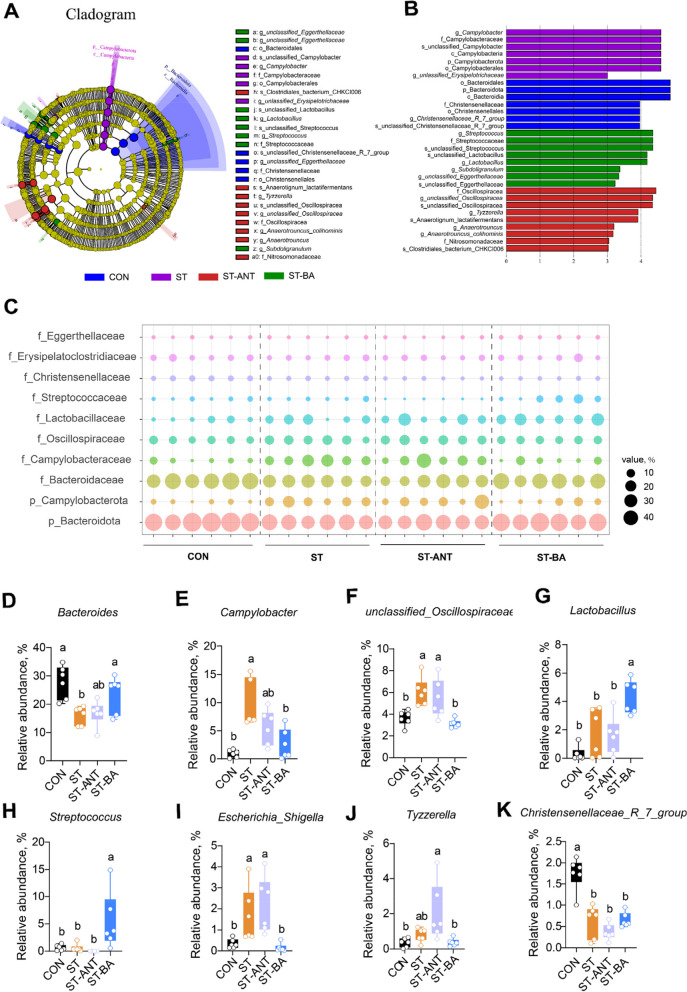
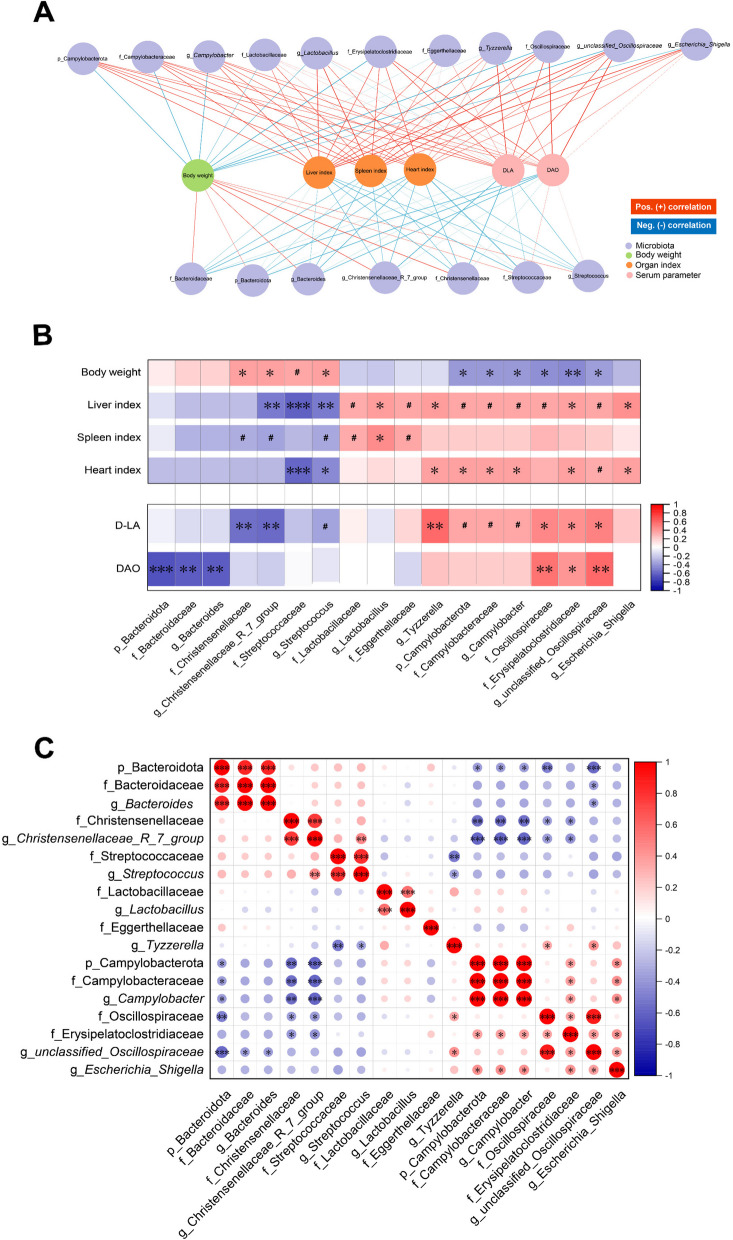
Results: BAs supplementation ameliorated weight loss induced by S. Typhimurium infection and reduced the colonization of Salmonella in the liver and small intestine in broilers (P < 0.05). Compared to the ST group, broilers in ST-BA group had a higher ileal mucosal thickness and villus height, and BAs also ameliorated the increase of diamine oxidase (DAO) level in serum (P < 0.05). It was observed that the mucus layer thickness and the number of villous and cryptic goblet cells (GCs) were increased in the ST-BA group, consistent with the upregulation of MUC2 gene expression in the ileal mucosa (P < 0.05). Moreover, the mRNA expressions of Toll-like receptor 5 (TLR5), Toll-like receptor 4 (TLR4), and interleukin 1 beta (IL1b) were downregulated in the ileum by BAs treatment (P < 0.05). 16S rDNA sequencing analysis revealed that, compared to ST group, BAs ameliorated the decreases in Bacteroidota, Bacteroidaceae and Bacteroides abundances, which were negatively correlated with serum DAO activity, and the increases in Campylobacterota, Campylobacteraceae and Campylobacter abundances, which were negatively correlated with body weight but positively correlated with serum D-lactic acid (D-LA) levels (P < 0.05).
Conclusions: Dietary BAs supplementation strengthens the intestinal mucosal barrier and reverses dysbiosis of gut microbiota, which eventually relieves the damage to the intestinal barrier and weight loss induced by S. Typhimurium infection in broilers.
Keywords: Salmonella Typhimurium; Bile acid, Broiler; Gut microbiota; Intestinal barrier.
© 2024. The Author(s).
Conflict of interest statement
Figures


Similar articles
-
Compound of Lactobacillus reuteri and Candida rugosa supplementation alleviates intestinal barrier lesion via improving the gut microbiota in broilers infected with Salmonella Typhimurium.Poult Sci. 2025 Sep;104(9):105417. doi: 10.1016/j.psj.2025.105417. Epub 2025 Jun 11. Poult Sci. 2025. PMID: 40541101 Free PMC article.
-
Dietary protocatechuic acid ameliorates ileal mucosal barrier injury and inflammatory response and improves intestinal microbiota composition in Yellow chickens challenged with Salmonella typhimurium.Poult Sci. 2023 Apr;102(4):102496. doi: 10.1016/j.psj.2023.102496. Epub 2023 Jan 13. Poult Sci. 2023. PMID: 36736141 Free PMC article.
-
Bile acids supplementation improves colonic mucosal barrier via alteration of bile acids metabolism and gut microbiota composition in goats with subacute ruminal acidosis (SARA).Ecotoxicol Environ Saf. 2024 Nov 15;287:117313. doi: 10.1016/j.ecoenv.2024.117313. Epub 2024 Nov 12. Ecotoxicol Environ Saf. 2024. PMID: 39536567
-
Pretreatment with probiotics Enterococcus faecium NCIMB 11181 attenuated Salmonella Typhimurium-induced gut injury through modulating intestinal microbiome and immune responses with barrier function in broiler chickens.J Anim Sci Biotechnol. 2022 Oct 12;13(1):130. doi: 10.1186/s40104-022-00765-5. J Anim Sci Biotechnol. 2022. PMID: 36221113 Free PMC article.
-
Bi-Directional Relationship Between Bile Acids (BAs) and Gut Microbiota (GM): UDCA/TUDCA, Probiotics, and Dietary Interventions in Elderly People.Int J Mol Sci. 2025 Feb 19;26(4):1759. doi: 10.3390/ijms26041759. Int J Mol Sci. 2025. PMID: 40004221 Free PMC article. Review.
Cited by
-
Effects of dietary supplementation with bile acids on growth performance, antioxidant capacity, lipid metabolism, and cecal microbiota of Danzhou chickens.Poult Sci. 2025 Aug;104(8):105276. doi: 10.1016/j.psj.2025.105276. Epub 2025 May 7. Poult Sci. 2025. PMID: 40373624 Free PMC article.
-
Compound of Lactobacillus reuteri and Candida rugosa supplementation alleviates intestinal barrier lesion via improving the gut microbiota in broilers infected with Salmonella Typhimurium.Poult Sci. 2025 Sep;104(9):105417. doi: 10.1016/j.psj.2025.105417. Epub 2025 Jun 11. Poult Sci. 2025. PMID: 40541101 Free PMC article.
-
Effects of bile acids on production performance, serum biochemistry, lipid metabolism, and intestinal morphology in broilers.Front Vet Sci. 2025 Apr 30;12:1584544. doi: 10.3389/fvets.2025.1584544. eCollection 2025. Front Vet Sci. 2025. PMID: 40370833 Free PMC article.
-
Effects of tannic acid on growth performance, intestinal health, and tolerance in broiler chickens.Poult Sci. 2025 Feb;104(2):104676. doi: 10.1016/j.psj.2024.104676. Epub 2024 Dec 28. Poult Sci. 2025. PMID: 39817985 Free PMC article.
-
Cinnamaldehyde Alleviates Salmonellosis in Chicks by Regulating Gut Health.Vet Sci. 2025 Mar 3;12(3):237. doi: 10.3390/vetsci12030237. Vet Sci. 2025. PMID: 40266958 Free PMC article.
References
-
- Ibrahim D, Abdelfattah-Hassan A, Badawi M, Ismail TA, Bendary MM, Abdelaziz AM, et al. Thymol nanoemulsion promoted broiler chicken’s growth, gastrointestinal barrier and bacterial community and conferred protection against Salmonella Typhimurium. Sci Rep. 2021;11:7742. 10.1038/s41598-021-86990-w. - PMC - PubMed
-
- Zhang B, Li G, Shahid MS, Gan L, Fan H, Lv Z, et al. Dietary L-arginine supplementation ameliorates inflammatory response and alters gut microbiota composition in broiler chickens infected with Salmonella enterica serovar Typhimurium. Poult Sci. 2020;99:1862–74. 10.1016/j.psj.2019.10.04. - PMC - PubMed
-
- Antunes P, Mourao J, Campos J, Peixe L. Salmonellosis: the role of poultry meat. Clin Microbiol Infect. 2016;22:110–21. 10.1016/j.cmi.2015.12.004. - PubMed
-
- Delhalle L, Saegerman C, Farnir F, Korsak N, Maes D, Messens W, et al. Salmonella surveillance and control at post-harvest in the Belgian pork meat chain. Food Microbiol. 2009;26:265–71. 10.1016/j.fm.2008.12.009. - PubMed
Grants and funding
LinkOut - more resources
Full Text Sources
Research Materials
Miscellaneous
