

A cross-sectional study on post-stroke depression and the quality of life
- PMID: 39533419
- PMCID: PMC11555978
- DOI: 10.1186/s40359-024-02143-4
A cross-sectional study on post-stroke depression and the quality of life
Abstract
Background: Post-stroke depression (PSD) is a common mood disorder associated with stroke. By investigating the differences in life quality factors among stroke survivors, the results of this study offer insights into how to better prevent and manage the onset and progression of depression.
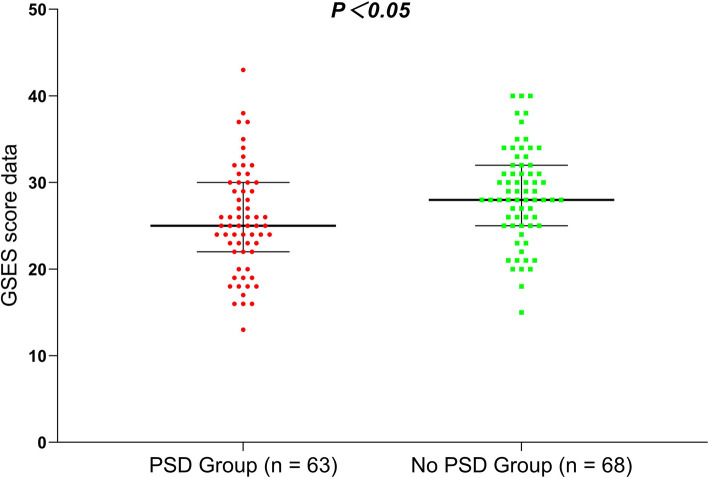
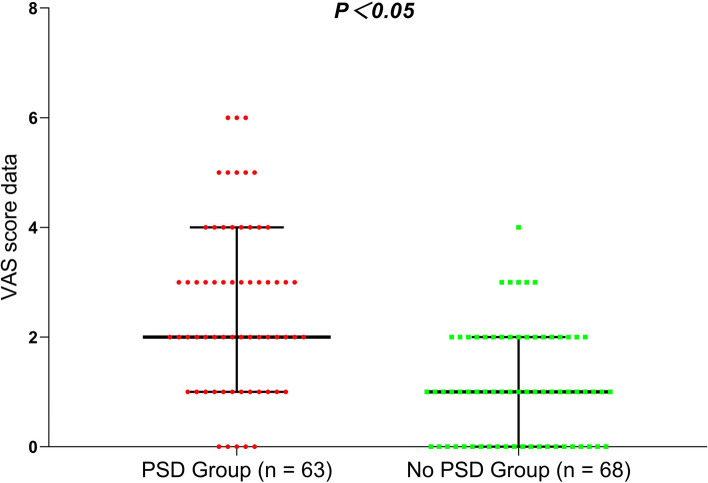
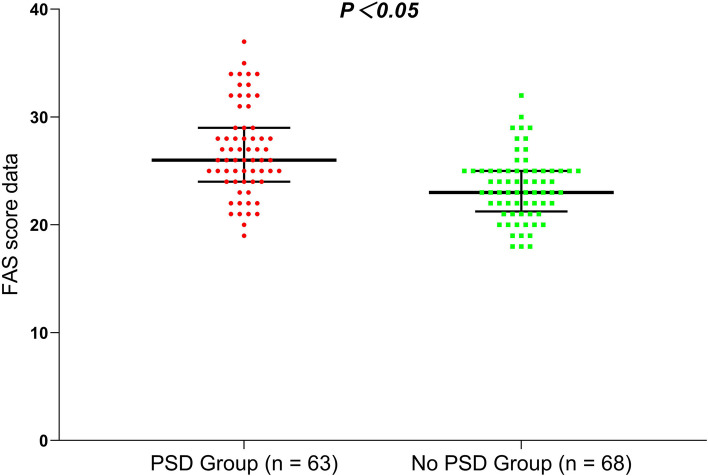
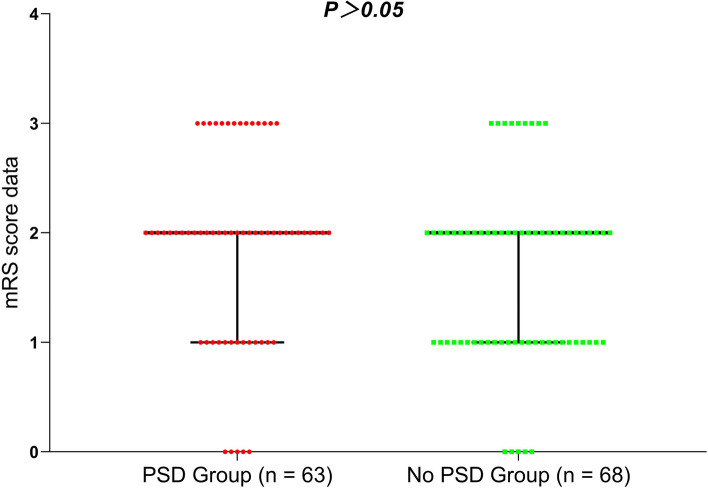
Methods: This study is a cross-sectional study that selected patients receiving treatment in the Department of Rehabilitation Medicine at Hebei University Affiliated Hospital from September 1 to November 30, 2023. The inclusion criteria for this study were as follows: 1. Age ≥ 18 years; 2. Diagnosis of hemorrhagic or ischemic stroke confirmed by imaging examination. The exclusion criteria included: 1. A history of psychiatric disorders such as depression or anxiety prior to the onset of the illness; 2. History of psychiatric medication use before the onset; 3. Functional impairments, such as speech, cognitive, or consciousness disorders, that hinder cooperation with the survey questionnaire. Ultimately, a total of 131 patients were included in the study. Based on the results of the Patient Health Questionnaire-9 (PHQ-9), patients were divided into the PSD group and the non-PSD group. The primary evaluation metrics included the General Self-Efficacy Scale (GSES), Visual Analogue Scale (VAS), modified Rankin Scale (mRS), and Fatigue Assessment Scale (FAS), allowing for a comparison of demographic, clinical data, and evaluation metrics between the two groups. Statistical analysis was performed using SPSS version 25.0, and GraphPad Prism version 9.0 was used for graphical representations.
Results: The morbidity rate of PSD in this study was 48%, which was slightly higher than the global statistical data. The demographic data did not show any statistical differences in terms of age, sex, history of smoking and drinking, or occupation, but they did show a significant difference in terms of education level (p < 0.05), which was primarily related to low education level in the PSD group. In contrast, the clinical data did not show any differences in terms of stroke type, pathogenic site, or medical history (p > 0.05).
Conclusion: In this study, statistical results indicated no significant difference in the mRS between the two groups. However, the GSES, VAS, and FAS showed significant differences. This suggests a strong correlation between GSES, VAS, and FAS with the occurrence of PSD, indicating that these factors may serve as predictors for PSD. In medical practice, focusing on patients' self-efficacy, pain, and fatigue levels could facilitate recovery. When developing rehabilitation plans, it is crucial to minimize patients' feelings of self-defeat, enhance their self-efficacy, and manage fatigue effectively. Furthermore, reinforcing pain management throughout the rehabilitation process may promote more effective patient recovery.
Keywords: Fatigue severity scale; General self-Efficacy score; Post-stroke depression; Post-stroke fatigue; Quality of life.
© 2024. The Author(s).
Conflict of interest statement
Figures
Similar articles
-
The influence of early depressive symptoms, social support and decreasing self-efficacy on depression 6 months post-stroke.J Affect Disord. 2016 Dec;206:252-255. doi: 10.1016/j.jad.2016.07.041. Epub 2016 Jul 22. J Affect Disord. 2016. PMID: 27513631
-
Factors associated with post-stroke fatigue among stroke survivors: a cross-sectional study.PeerJ. 2025 Mar 6;13:e19052. doi: 10.7717/peerj.19052. eCollection 2025. PeerJ. 2025. PMID: 40061230 Free PMC article.
-
Predictors of early-onset post-ischemic stroke depression: a cross-sectional study.BMC Neurol. 2017 Nov 17;17(1):199. doi: 10.1186/s12883-017-0980-5. BMC Neurol. 2017. PMID: 29149884 Free PMC article.
-
Behavioural modification interventions for medically unexplained symptoms in primary care: systematic reviews and economic evaluation.Health Technol Assess. 2020 Sep;24(46):1-490. doi: 10.3310/hta24460. Health Technol Assess. 2020. PMID: 32975190 Free PMC article.
-
[Post-stroke depression].Zh Nevrol Psikhiatr Im S S Korsakova. 2006;Suppl 16:73-9. Zh Nevrol Psikhiatr Im S S Korsakova. 2006. PMID: 18196638 Review. Russian.
Cited by
-
Analysis of the current status and associated factors of depressive symptoms in Chinese middle-aged and elderly stroke patients-based on CHARLS data.Front Psychiatry. 2025 Jun 6;16:1602287. doi: 10.3389/fpsyt.2025.1602287. eCollection 2025. Front Psychiatry. 2025. PMID: 40547123 Free PMC article.
-
Comparative Efficacy of Selective Serotonin Reuptake Inhibitors (SSRIs) and Serotonin-Norepinephrine Reuptake Inhibitors (SNRIs) in the Management of Post-stroke Depression: A Systematic Review of Randomized Controlled Trials.Cureus. 2025 May 25;17(5):e84784. doi: 10.7759/cureus.84784. eCollection 2025 May. Cureus. 2025. PMID: 40557026 Free PMC article. Review.
-
Factors that influence technophobia in Chinese older patients with ischemic stroke: a cross-sectional survey.BMC Geriatr. 2025 Aug 19;25(1):639. doi: 10.1186/s12877-025-06304-x. BMC Geriatr. 2025. PMID: 40830933
References
-
- Gao YL, Wang WZ. Progress in epidemiological research of cerebrovascular disease. Chin J Neurol. 2015;48(4):337–40. 10.3760/cma.j.issn.1006-7876.2015.04.021.
-
- Lekoubou A, Nguyen C, Kwon M, Nyalundja AD, Agrawal A. Post-stroke everything. Curre Neurol Neurosci Rep. 2023;23(11):785–800. 10.1007/s11910-023-01308-9. - PubMed
MeSH terms
Grants and funding
LinkOut - more resources
Full Text Sources
Medical
Research Materials
Miscellaneous
