

The more self-control, the more anxious?- A network analysis study of the relationship between self-control and psychological anxiety among Chinese university students
- PMID: 39533426
- PMCID: PMC11559139
- DOI: 10.1186/s40359-024-02099-5
The more self-control, the more anxious?- A network analysis study of the relationship between self-control and psychological anxiety among Chinese university students
Abstract
Introduction: With the growing prevalence of anxiety symptoms among university students, self-control is an important potential influence. This study aims to understand the network structure of self-control and anxiety, and to identify the core symptoms within this network. It will provide a theoretical basis for the prevention and intervention of anxiety symptoms in university students.
Method: We used network analysis to study anxiety and self-control in 3,792 university students from six schools in Heilongjiang Province, China. We checked for linear connections in the networks using a restricted cubic spline. We conducted the analyses and made graphs using R software.
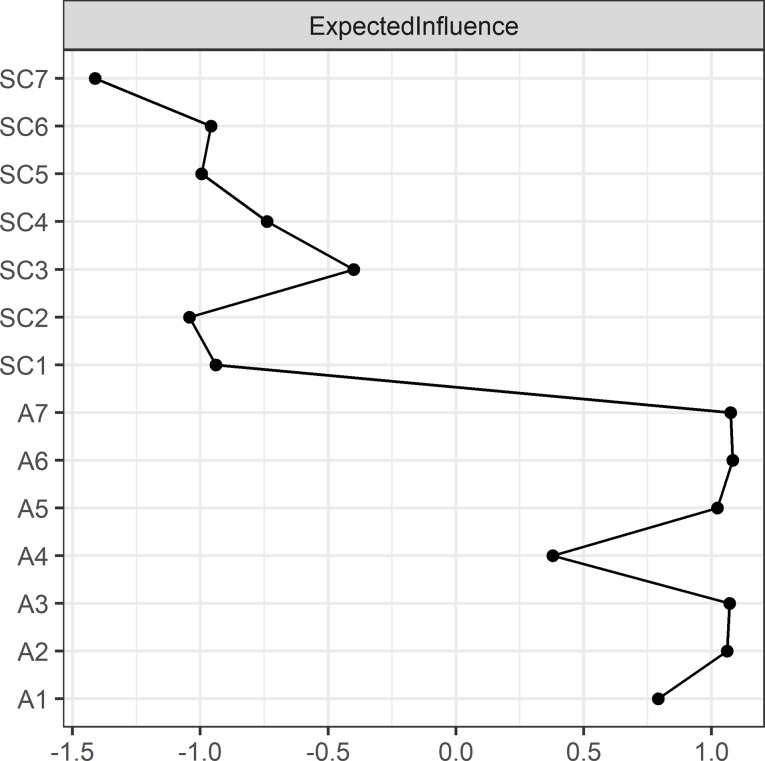
Results: (i) The total sample network showed that higher levels of self-control in university students were associated with lower anxiety levels and were validated by the restrictive cubic spline. (ii) There was the strongest negative correlation (edge weight = -0.42) between Without thinking (SC7) and Panic (A5), and the edge weight coefficients of this self-control component and anxiety symptoms were greater than those of other self-control components. (iii) Physical exertion (A6) and Scared (A7) were identified as the core symptoms of the overall network, with expected influence of 1.08 and 1.08 (Z-score). (iv) A significant difference was observed between the anxiety positive network structure and the total sample network structure, with the strongest positive correlation between Iron self-control (SC3) and Breathing difficulty (A2) (edge weight = 0.22), with the strongest negative correlation between Certain things (SC2) and Situations (A4) (edge weight = -0.35). (v) The self-control component Iron self-control (SC3) had only one positive edge in the rural network, and only two positive edges in not one child network.
Conclusion: The present study offered a new perspective on the relationship between self-control and anxiety using network analysis for the first time. The control component Without thinking (SC7) was an important concept influencing the negative correlation of anxiety, and Physical exertion (A6) and Scared (A7) were core symptoms in the total network. Heterogeneity analyses showed a tendency for the more self-controlled to be more anxious in the anxiety positive sample. These results may be a potential target for preventing and intervening anxiety in university students.
Keywords: Anxiety; Network analysis; Self-control; University students.
© 2024. The Author(s).
Conflict of interest statement
Figures


References
-
- Duffy A, Saunders KEA, Malhi GS, Patten S, Cipriani A, McNevin SH, MacDonald E, Geddes J. Mental health care for university students: a way forward? Lancet Psychiatry. 2019;6(11):885–7. - PubMed
-
- Tan GX, Soh XC, Hartanto A, Goh AY, Majeed NMJJADR. Prevalence of anxiety in college and university students: An umbrella review. 2023:100658.
MeSH terms
Grants and funding
LinkOut - more resources
Full Text Sources
Medical
