

m6A-related genes and their role in Parkinson's disease: Insights from machine learning and consensus clustering
- PMID: 39533574
- PMCID: PMC11557064
- DOI: 10.1097/MD.0000000000040484
m6A-related genes and their role in Parkinson's disease: Insights from machine learning and consensus clustering
Abstract
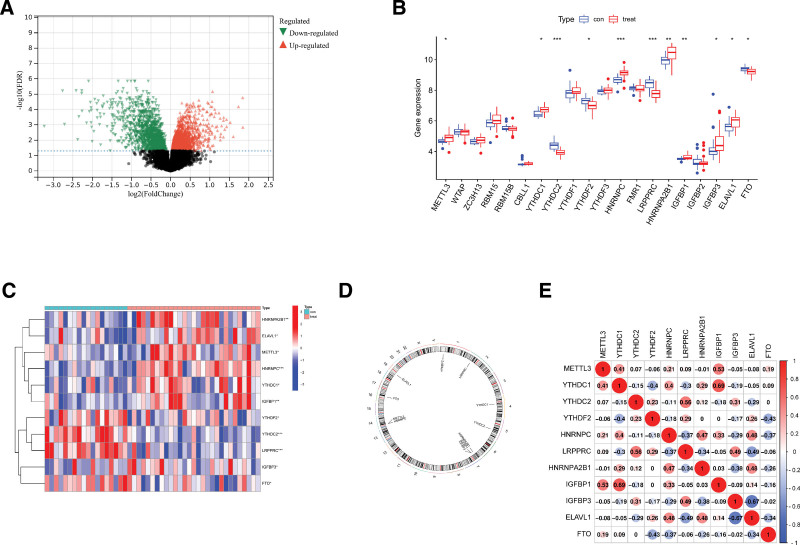
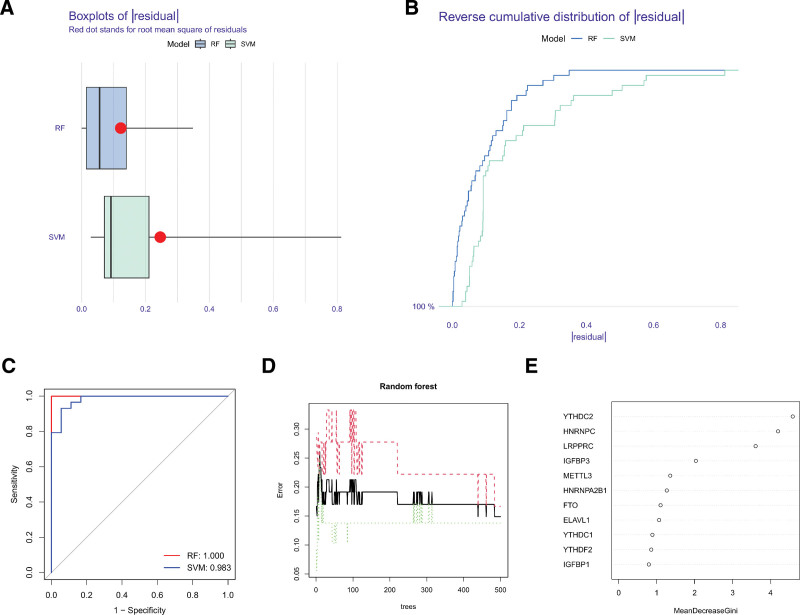
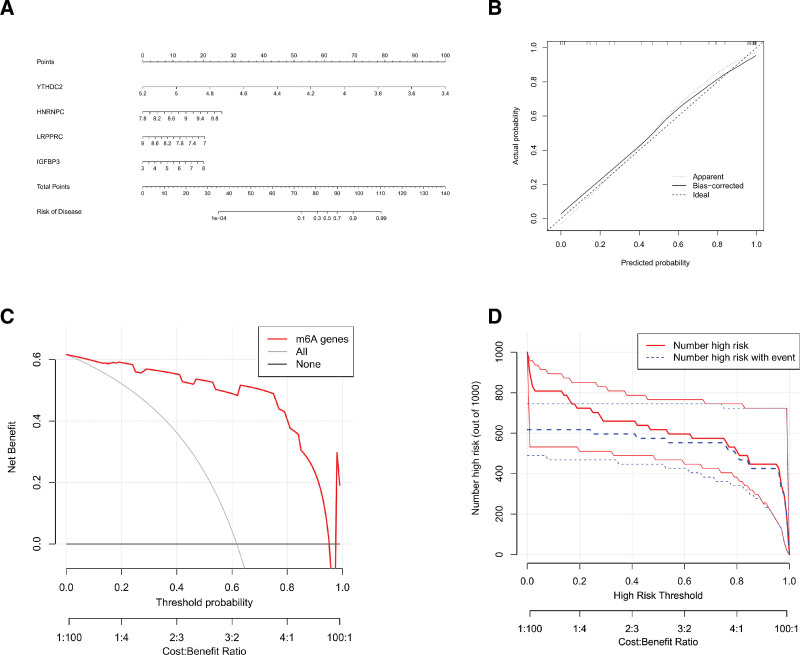
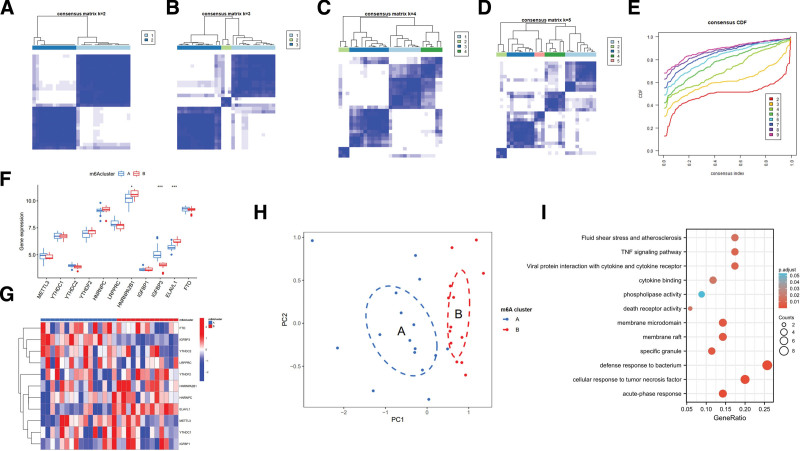
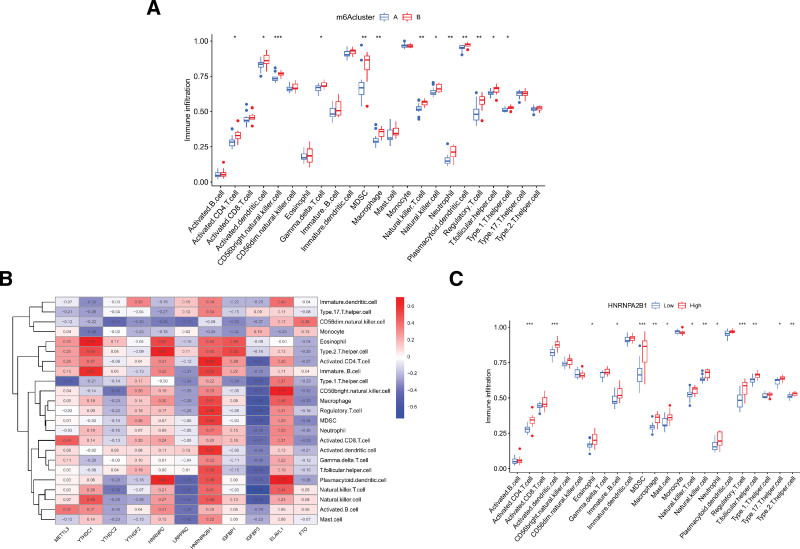
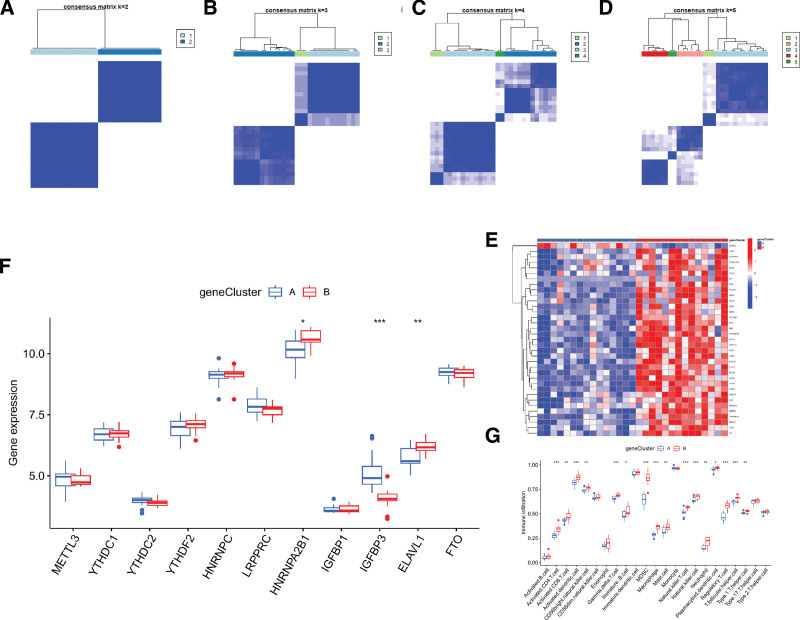
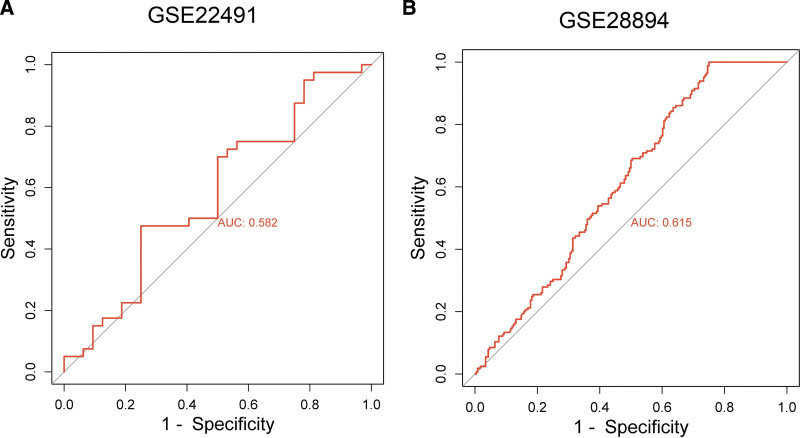
Parkinson disease (PD) is a chronic neurological disorder primarily characterized by a deficiency of dopamine in the brain. In recent years, numerous studies have highlighted the substantial influence of RNA N6-methyladenosine (m6A) regulators on various biological processes. Nevertheless, the specific contribution of m6A-related genes to the development and progression of PD remains uncertain. In this study, we performed a differential analysis of the GSE8397 dataset in the Gene Expression Omnibus database and selected important m6A-related genes. Candidate m6A-related genes were then screened using a random forest model to predict the risk of PD. A nomogram model was built based on the candidate m6A-related genes. By employing a consensus clustering method, PD was divided into different m6A clusters based on the selected significant m6A-related genes. Finally, we performed immune cell infiltration analysis to explore the immune infiltration between different clusters. We performed a differential analysis of the GSE8397 dataset in the Gene Expression Omnibus database and selected 11 important m6A-related genes. Four candidate m6A-related genes (YTH Domain Containing 2, heterogeneous nuclear ribonucleoprotein C, leucine-rich pentatricopeptide repeat motif containing protein and insulin-like growth factor binding protein-3) were then screened using a random forest model to predict the risk of PD. A nomogram model was built based on the 4 candidate m6A-related genes. The decision curve analysis indicated that patients can benefit from the nomogram model. By employing a consensus clustering method, PD was divided into 2 m6A clusters (cluster A and cluster B) based on the selected significant m6A-related genes. The immune cell infiltration analysis revealed that cluster A and cluster B exhibit distinct immune phenotypes. In conclusion, m6A-related genes play a significant role in the development of PD and our study on m6A clustering may potentially guide personalized treatment strategies for PD in the future.
Copyright © 2024 the Author(s). Published by Wolters Kluwer Health, Inc.
Conflict of interest statement
The authors have no funding and conflicts of interest to disclose.
Figures
Similar articles
-
Role of the N6-methyladenosine regulatory factor in reducing the risk of cardiovascular disease: subtype diagnosis following aerobic exercise-assisted weight loss.Am J Transl Res. 2022 Aug 15;14(8):5363-5378. eCollection 2022. Am J Transl Res. 2022. PMID: 36105062 Free PMC article.
-
Role of m6A Methylation Regulators in the Diagnosis and Subtype Classification of COPD Based on the GEO Database.J Cell Mol Med. 2024 Nov;28(22):e70226. doi: 10.1111/jcmm.70226. J Cell Mol Med. 2024. PMID: 39580709 Free PMC article.
-
Identification of diagnostic biomarkers and molecular subtype analysis associated with m6A in Tuberculosis immunopathology using machine learning.Sci Rep. 2024 Dec 2;14(1):29982. doi: 10.1038/s41598-024-81790-4. Sci Rep. 2024. PMID: 39622968 Free PMC article.
-
Comprehensive Analysis of PD-L1 Expression, Immune Infiltrates, and m6A RNA Methylation Regulators in Esophageal Squamous Cell Carcinoma.Front Immunol. 2021 May 12;12:669750. doi: 10.3389/fimmu.2021.669750. eCollection 2021. Front Immunol. 2021. PMID: 34054840 Free PMC article.
-
The Role of N6-Methyladenosine (m6A) RNA Modification in the Pathogenesis of Parkinson's Disease.Biomolecules. 2025 Apr 23;15(5):617. doi: 10.3390/biom15050617. Biomolecules. 2025. PMID: 40427510 Free PMC article. Review.
References
-
- Bloem BR, Okun MS, Klein C. Parkinson’s disease. Lancet. 2021;397:2284–303. - PubMed
-
- Jankovic J, Tan EK. Parkinson’s disease: etiopathogenesis and treatment. J Neurol Neurosurg Psychiatry. 2020;91:795–808. - PubMed
-
- Chen Z, Li G, Liu J. Autonomic dysfunction in Parkinson’s disease: Implications for pathophysiology, diagnosis, and treatment. Neurobiol Dis. 2020;134:104700. - PubMed
-
- Farrer MJ. Genetics of Parkinson disease: paradigm shifts and future prospects. Nat Rev Genet. 2006;7:306–18. - PubMed
MeSH terms
Substances
LinkOut - more resources
Full Text Sources
Medical
