

Syncing the brain's networks: dynamic functional connectivity shifts from temporal interference
- PMID: 39534013
- PMCID: PMC11554487
- DOI: 10.3389/fnhum.2024.1453638
Syncing the brain's networks: dynamic functional connectivity shifts from temporal interference
Abstract
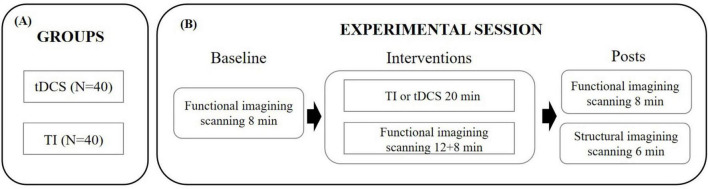
Background: Temporal interference (TI) stimulation, an innovative non-invasive brain stimulation approach, has the potential to activate neurons in deep brain regions. However, the dynamic mechanisms underlying its neuromodulatory effects are not fully understood. This study aims to investigate the effects of TI stimulation on dynamic functional connectivity (dFC) in the motor cortex.
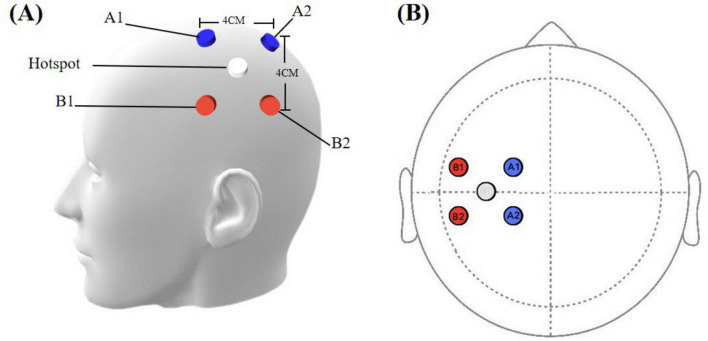
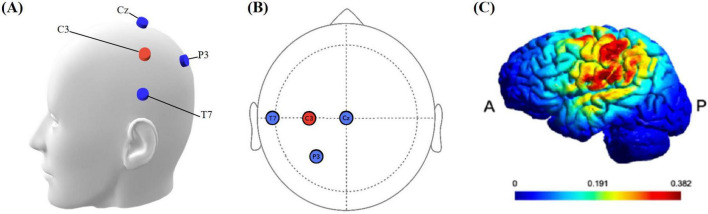
Methods: 40 healthy adults underwent both TI and tDCS in a double-blind, randomized crossover design, with sessions separated by at least 48 h. The total stimulation intensity of TI is 4 mA, with each channel's intensity set at 2 mA and a 20 Hz frequency difference (2 kHz and 2.02 kHz). The tDCS stimulation intensity is 2 mA. Resting-state functional magnetic resonance imaging (rs-fMRI) data were collected before, during, and after stimulation. dFC was calculated using the left primary motor cortex (M1) as the region of interest (ROI) and analyzed using a sliding time-window method. A two-way repeated measures ANOVA (group × time) was conducted to evaluate the effects of TI and tDCS on changes in dFC.
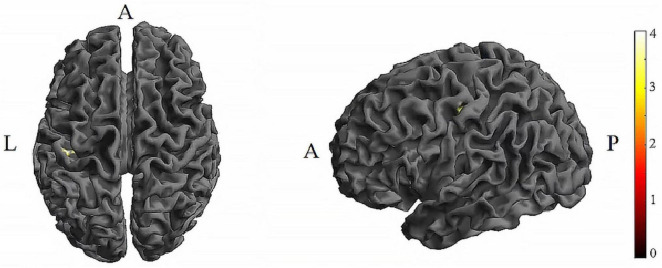
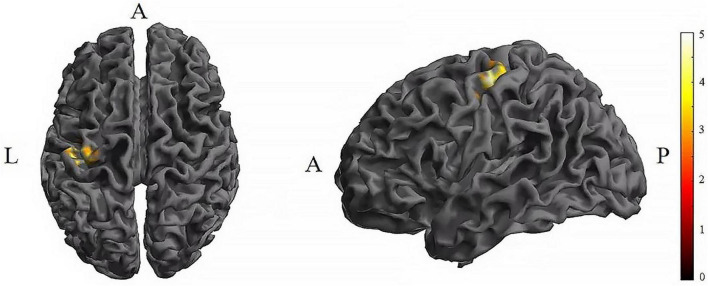
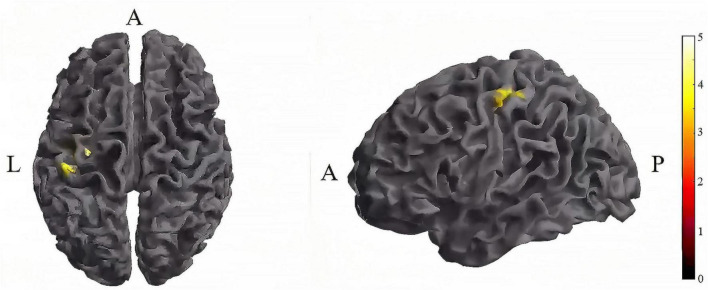
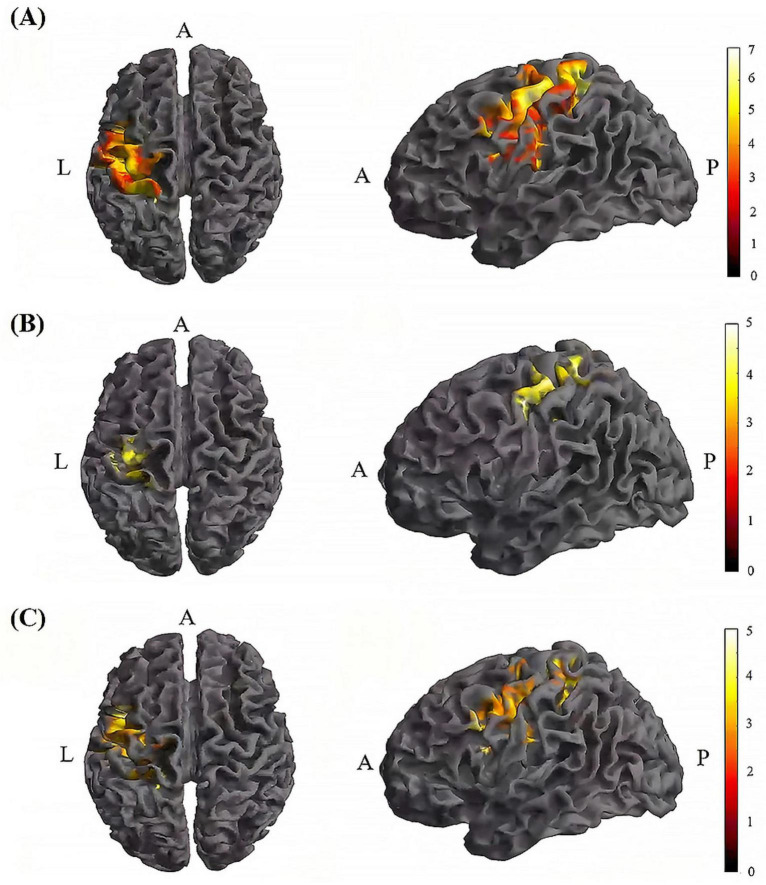
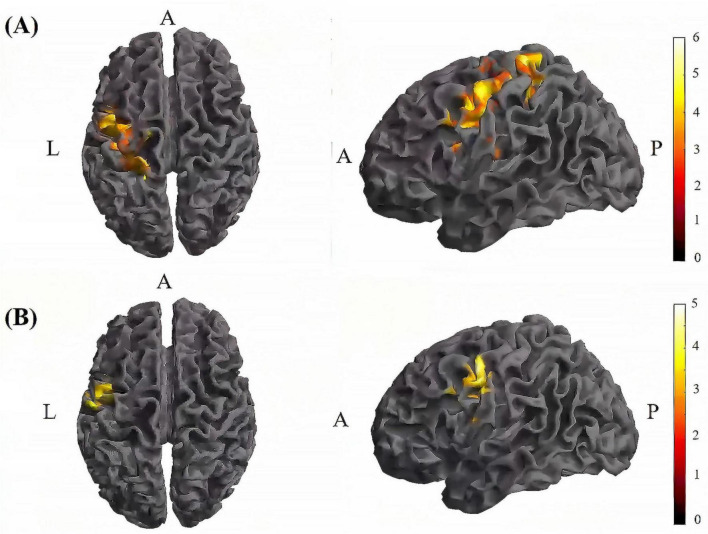
Results: For CV of dFC, significant main effects of stimulation type (P = 0.004) and time (P < 0.001) were observed. TI showed lower CV of dFC than tDCS in the left postcentral gyrus (P < 0.001). TI-T2 displayed lower CV of dFC than TI-T1 in the left precentral gyrus (P < 0.001). For mean dFC, a significant main effect of time was found (P < 0.001). TI-T2 showed higher mean dFC than tDCS-T2 in the left postcentral gyrus (P = 0.018). Within-group comparisons revealed significant differences between time points in both TI and tDCS groups, primarily in the left precentral and postcentral gyri (all P < 0.001). Results were consistent across different window sizes.
Conclusion: 20 Hz TI stimulation altered dFC in the primary motor cortex, leading to a significant decreasing variability and increasing mean connectivity strength in dFC. This outcome indicates that the 20 Hz TI frequency interacted with the motor cortex's natural resonance.
Keywords: dynamic functional connectivity; non-invasive brain stimulation; primary motor cortex; resting-state fMRI; temporal interference.
Copyright © 2024 Zhu, Tang, Qin, Qian, Zhuang and Liu.
Conflict of interest statement
The authors declare that the research was conducted in the absence of any commercial or financial relationships that could be construed as a potential conflict of interest.
Figures
Similar articles
-
Temporal Interference (TI) Stimulation Boosts Functional Connectivity in Human Motor Cortex: A Comparison Study with Transcranial Direct Current Stimulation (tDCS).Neural Plast. 2022 Jan 31;2022:7605046. doi: 10.1155/2022/7605046. eCollection 2022. Neural Plast. 2022. PMID: 35140781 Free PMC article. Clinical Trial.
-
Comparative Effects of Temporal Interference and High-Definition Transcranial Direct Current Stimulation on Spontaneous Neuronal Activity in the Primary Motor Cortex: A Randomized Crossover Study.Brain Sci. 2025 Mar 18;15(3):317. doi: 10.3390/brainsci15030317. Brain Sci. 2025. PMID: 40149838 Free PMC article.
-
Dynamic Functional Connectivity in the Main Clinical Phenotypes of Multiple Sclerosis.Brain Connect. 2021 Oct;11(8):678-690. doi: 10.1089/brain.2020.0920. Epub 2021 May 13. Brain Connect. 2021. PMID: 33813839
-
Repetitive temporal interference stimulation improves jump performance but not the postural stability in young healthy males: a randomized controlled trial.J Neuroeng Rehabil. 2024 Mar 20;21(1):38. doi: 10.1186/s12984-024-01336-7. J Neuroeng Rehabil. 2024. PMID: 38509563 Free PMC article. Clinical Trial.
-
Temporal interference stimulation for human brain: Opportunities and challenges.Innovation (Camb). 2025 Jan 15;6(4):100803. doi: 10.1016/j.xinn.2025.100803. eCollection 2025 Apr 7. Innovation (Camb). 2025. PMID: 40470330 Free PMC article. Review. No abstract available.
Cited by
-
Human Applications of Transcranial Temporal Interference Stimulation: A Systematic Review.medRxiv [Preprint]. 2025 Jun 23:2025.05.16.25327804. doi: 10.1101/2025.05.16.25327804. medRxiv. 2025. Update in: Brain Stimul. 2025 Aug 18:S1935-861X(25)00303-1. doi: 10.1016/j.brs.2025.08.010. PMID: 40463528 Free PMC article. Updated. Preprint.
References
LinkOut - more resources
Full Text Sources