. 2024 Oct 29:18:1489308.
doi: 10.3389/fnins.2024.1489308. eCollection 2024.

Automated home cage monitoring of an aging colony of mice-Implications for welfare monitoring and experimentation

Affiliations

Automated home cage monitoring of an aging colony of mice-Implications for welfare monitoring and experimentation

Joanna L Moore et al. Front Neurosci. .

Abstract

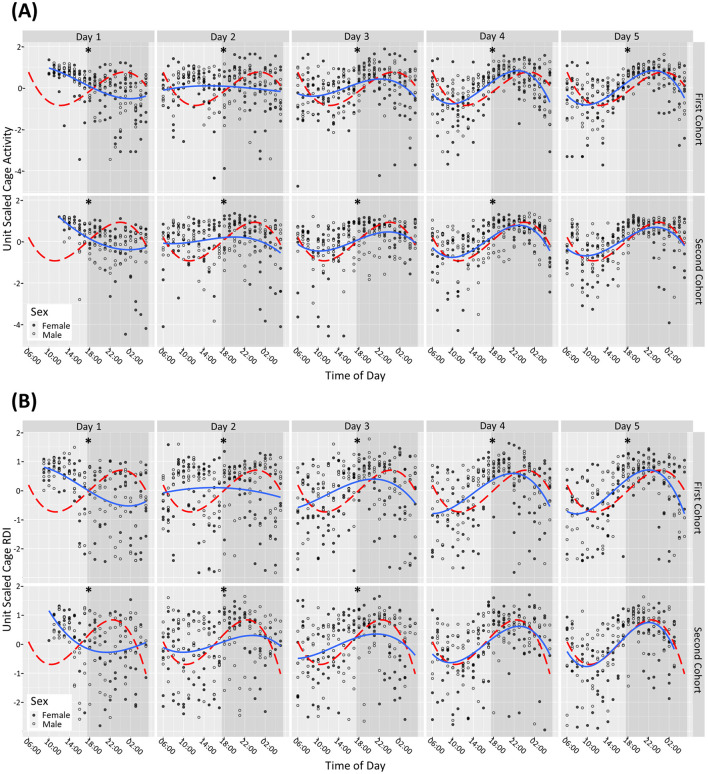
Introduction: Our understanding of laboratory animal behavior and the implications of husbandry activities on their wellbeing remains incomplete. This is especially relevant with an aging colony as their activity patterns may change as they mature. Home Cage Monitoring (HCM) provides valuable insights into mouse activity within the animal's own environment and can shed light on acclimatization periods and responses to husbandry activities such as cage changing. The aim of this study was to monitor and explore changes in the activity and rest disturbance (RDI) patterns of an aging colony of male and female C57/BL6 mice.

Methods: The mice were housed in the Digitally Ventilated Cage® system, for up to 18 months of age. Data was then downloaded to investigate how the activity patterns and RDI of the mice changed over time. Habituation, aging and cage change assessments were conducted using linear mixed models, while cage separation and stereotypic behavior investigations were conducted by visual inspection of the data.

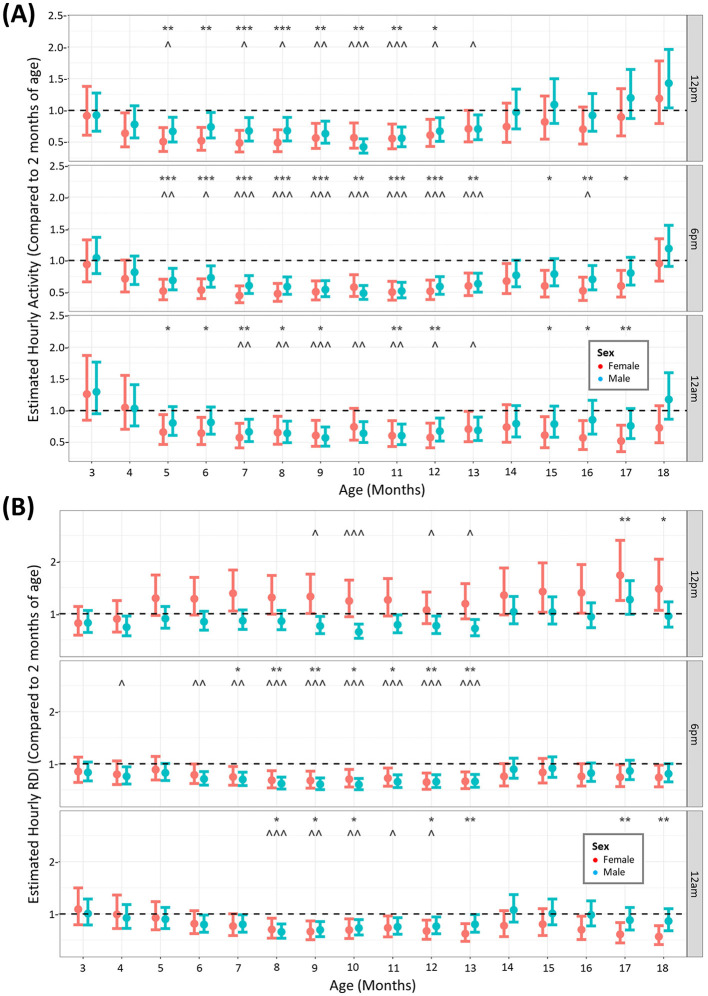
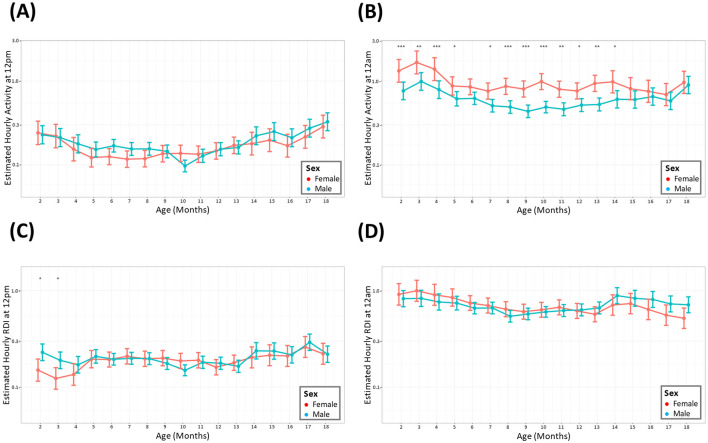
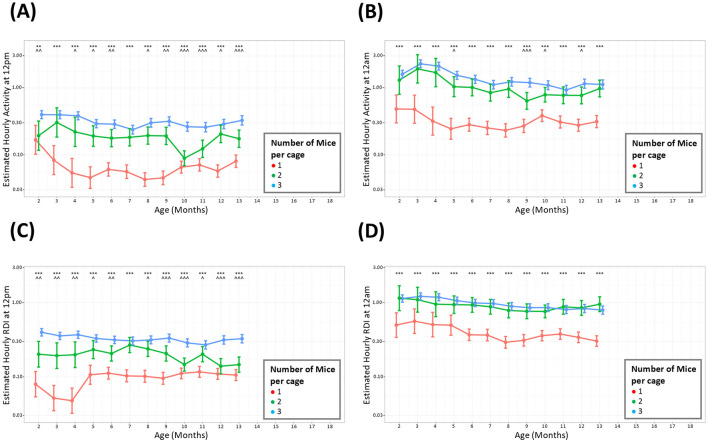
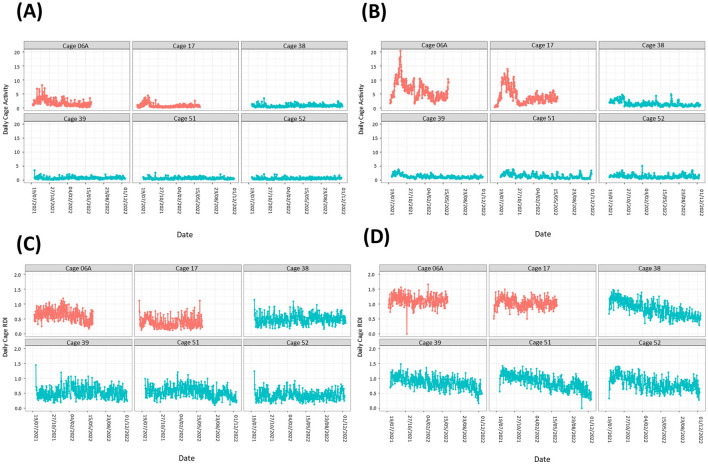
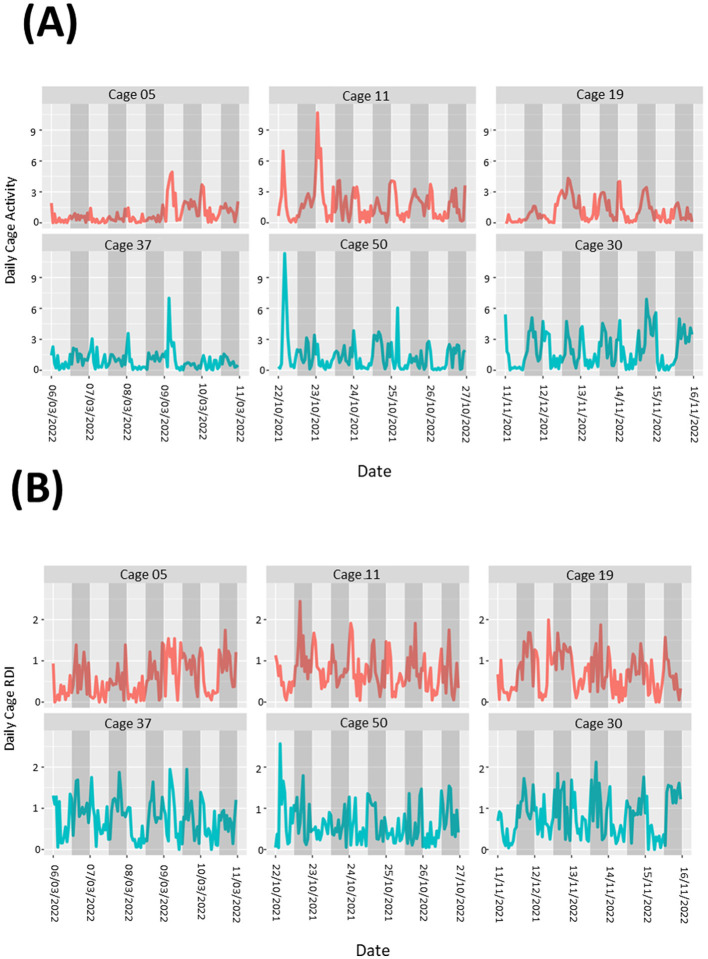
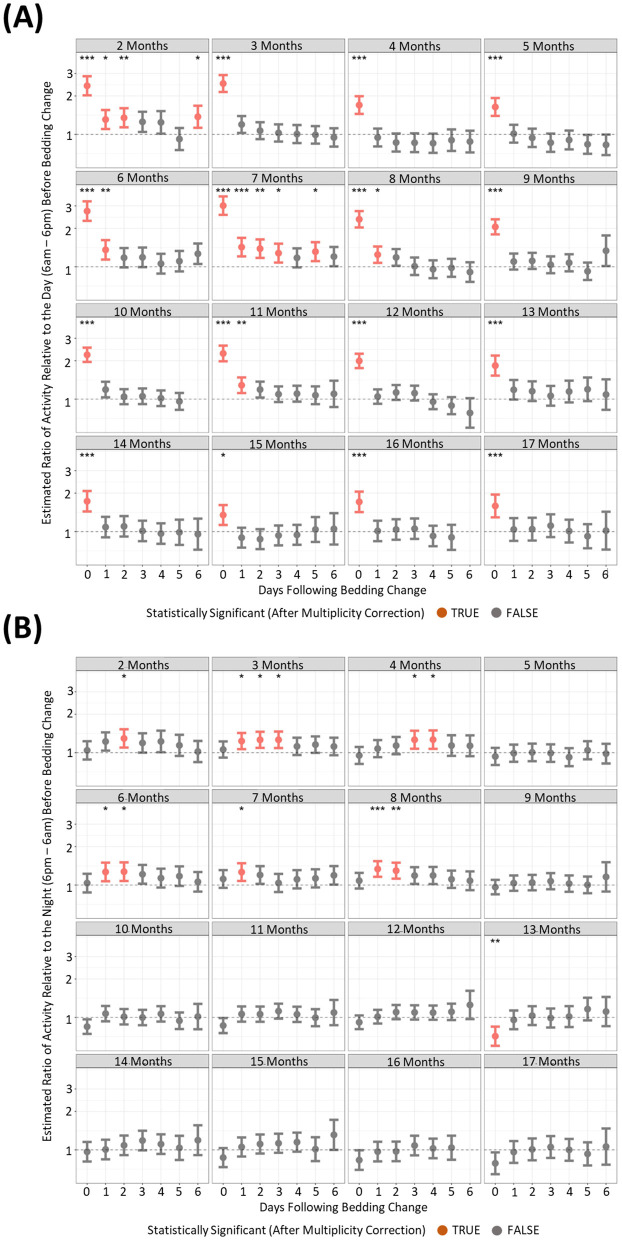
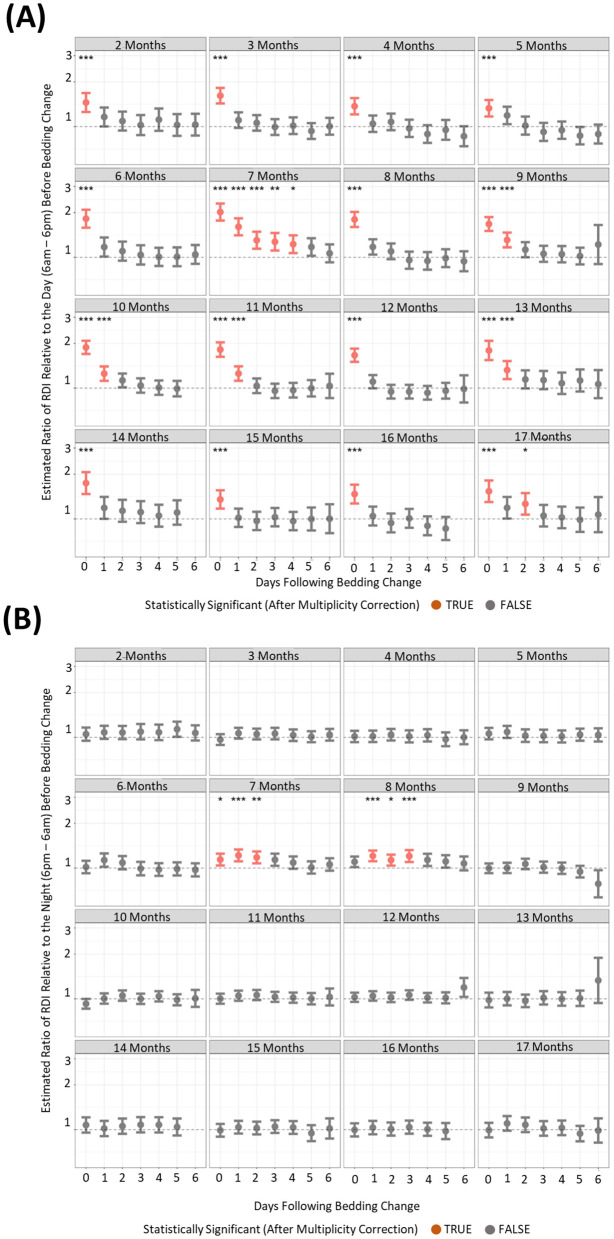
Results: As expected during the study, mice were less active during the light phase compared to the dark phase. However, on arrival mice displayed heightened activity and RDI during the light phase and reduced activity and RDI during the dark phase, taking several days to adjust to baseline "acclimatized" patterns. With age, overall activity significantly decreased from 5 months until 14 months of age, after which it increased back toward baseline levels. We also observed activity spikes during our monitoring of this colony. Prolonged housing can lead to alarming stereotypic behaviors in animals. Cages of mice flagged for potential stereotypy displayed sustained activity spikes in the light and dark phases. Spikes in activity during the dark phase were much more pronounced than in the light phase. Cage changing led to an increase in the light phase activity and RDI compared to the previous day, with no observed difference in the dark phase post-cage change. This effect remained consistent as the animals aged.

Discussion: This study explores changes in the activity patterns of an aging colony of male and female C57/BL6 mice housed in the Digitally Ventilated Cage® system. We identified distinct aging phases concerning activity and RDI differences and a potential new welfare application for the DVC®, specifically for early detection of stereotypy. In conclusion, the adoption of HCM systems should be considered for long-term animal housing from both a welfare and behavioral perspective.

Keywords: acclimatization period; activity-biomarkers; aging; animal welfare; cage changing; circadian rhythm; home cage monitoring; rodent behavior.


Conflict of interest statement

JK and A-AH were employed by company GlaxoSmithKline. The remaining author declares that the research was conducted in the absence of any commercial or financial relationships that could be construed as a potential conflict of interest.

Figures

Figure 1
Figure 1
Mice require 4+ days after arrival into the facility to reach normal rhythms of activity and RDI. Cage activity and RDI were measured using scaled activity (A), scaled cage RDI (B) across the day of arrival with data aggregated in hour buckets. Light gray areas depict the light phase, and the shaded areas depict the dark phase. A summary of the cage activity and RDI from the first 5 days of housing. The first day of housing is indexed as Day 1. The estimated activity/RDI profile for the day of interest (blue line) is compared with the activity/RDI profile across the 24-h period at day 31 (red dashed line) for male (o) and female () mice combined. The top graphs represent Cohort One, bottom graphs represent Cohort Two which arrived into the facility at ~1 month later. Days with significant differences to reference line (Day 31) are marked as *P < 0.05.
Figure 2
Figure 2
Increased age results in reduced activity and RDI of mice until 14 months where it returns back toward baseline levels. The estimated cage activity (A) and RDI (B) at 12 p.m., 6 p.m., and 12 a.m. in female () and male mice () for 18 months. Data are presented as the estimated mean ± 95% confidence interval. Months with significant differences to baseline for female mice are marked as *P < 0.05, **P < 0.01, ***P < 0.001. Months with significant differences to baseline for male mice are marked as P < 0.05, ∧∧P < 0.01, ∧∧∧P < 0.001.
Figure 3
Figure 3
Female mice have consistently higher levels of nighttime activity. The estimated cage activity and RDI at midday (A, C) and midnight (B, D) in female () and male mice () for 18 months. Data are presented as the estimated mean ± 95% confidence interval. Months with significant differences between male and female are marked as *P < 0.05, **P < 0.01, ***P < 0.001.
Figure 4
Figure 4
Cages with more mice have consistently higher levels of activity and RDI. The estimated cage activity and RDI at midday (A, C) and midnight (B, D) in cages with; three mice (), two mice (), and one mouse () for 13 months. Data are presented as the estimated mean ± 95% confidence interval. Months with significant differences between three mice per cage and one mouse per cage are marked as *P < 0.05, **P < 0.01, ***P < 0.001. Months with significant differences between three and two mice per cage are marked as P < 0.05, ∧∧P < 0.01, ∧∧∧P < 0.001.
Figure 5
Figure 5
Cages containing animals exhibiting stereotypic behavior show large spikes in activity but no obvious differences in RDI. Activity (A, B) and RDI (C, D) profiles of cages with mice showing stereotypic behavior (red) alongside profiles of cages with no stereotypy observed (blue). Light phase measurements (A, C) as well as dark phase measurements (B, D) are presented.
Figure 6
Figure 6
Cages containing animals exhibiting fighting behavior show no obvious patterns to differences in overall cage activity or RDI. Activity (A) and RDI (B) profiles of cages with mice that required separation due to fighting (red) alongside profiles of cages with no instances of fighting (blue). Measurements of 5 days leading up to separations are presented.
Figure 7
Figure 7
Higher levels of daytime cage activity are observed after a cage change when compared to cage activity prior to a cage change. The estimated ratio of cage activity in the “daytime” (A) and “night” (B) in cages containing mice up to 17 months of age. Data are presented as the estimated mean ± 95% confidence interval. Timepoints with significant differences compared to the day prior to cage change are marked in red and as *P < 0.05, **P < 0.01, ***P < 0.001.
Figure 8
Figure 8
Higher levels of daytime cage RDI are observed after a cage change when compared to cage RDI prior to a cage change. The estimated ratio of cage RDI in the “daytime” (A) and “night” (B) in cages containing mice up to 17 months of age. Data are presented as the estimated mean ± 95% confidence interval. Timepoints with significant differences compared to the day prior to cage change are marked in red and as *P < 0.05, **P < 0.01, ***P < 0.001.

Similar articles

References

    1. Ai M., Hotham W. E., Pattison L. A., Ma Q., Henson F. M. D., Smith E. S. J. (2023). Role of human mesenchymal stem cells and derived extracellular vesicles in reducing sensory neuron hyperexcitability and pain behaviors in murine osteoarthritis. Arthrit. Rheumatol. 75, 352–363. 10.1002/art.42353 - DOI - PMC - PubMed
    1. Bains R. S., Forrest H., Sillito R. R., Armstrong J. D., Stewart M., Nolan P. M., et al. . (2023). Longitudinal home-cage automated assessment of climbing behavior shows sexual dimorphism and aging-related decrease in C57BL/6J healthy mice and allows early detection of motor impairment in the N171-82Q mouse model of Huntington's disease. Front. Behav. Neurosci. 17:1148172. 10.3389/fnbeh.2023.1148172 - DOI - PMC - PubMed
    1. Balcombe J. P. (2006). Laboratory environments and rodents' behavioural needs: a review. Lab. Anim. 40, 217–235. 10.1258/002367706777611488 - DOI - PubMed
    1. Baumans V. (2007). “The welfare of laboratory mice,” in The Welfare of Laboratory Animals (Dordrecht: Springer Netherlands; ), 119–152.
    1. Bellantuono I., de Cabo R., Ehninger D., Di Germanio C., Lawrie A., Miller J., et al. . (2020). A toolbox for the longitudinal assessment of healthspan in aging mice. Nat. Protoc. 15, 540–574. 10.1038/s41596-019-0256-1 - DOI - PMC - PubMed

LinkOut - more resources