

A novel bioassay for thyroid-blocking immunoglobulins
- PMID: 39534254
- PMCID: PMC11554474
- DOI: 10.3389/fendo.2024.1463379
A novel bioassay for thyroid-blocking immunoglobulins
Abstract
Background: Thyroid-blocking immunoglobulins (TBI) are present in 10%-15% of patients with autoimmune thyroid disease (AITD). TBI affect thyroid function. The analytical performance of a novel TBI bioassay was evaluated.
Methods: Sera from AITD patients were tested with a cell-based TBI reporter bioassay (Thyretain®) with the expression of a luciferase transgene as readout and a new "Turbo™" TBI bioassay with a readout based on a cyclic AMP-activated luciferase. All samples were also run on two TSH-R binding immunoassays. A Passing-Bablok regression, a Bland-Altman plot, and user/lot comparisons were performed. In addition, dose-response curves for Turbo and Thyretain were fitted using serial dilutions, and half-maximal and 80% inhibitory concentrations (IC50/IC80) were compared.
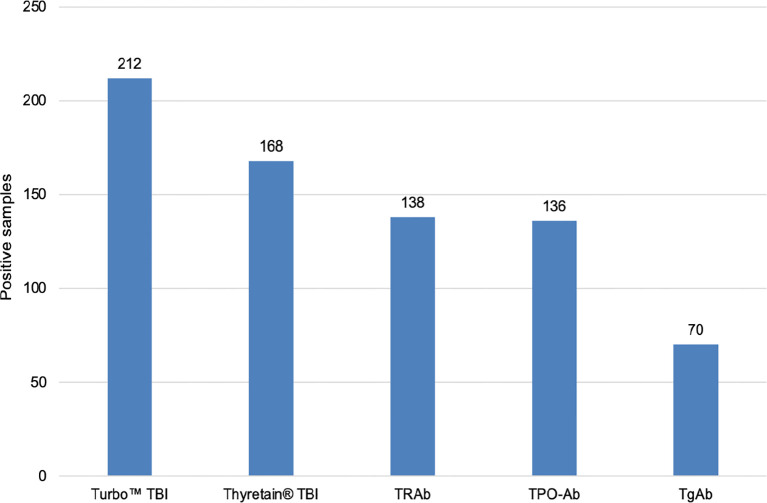
Results: Of 1,011 unselected AITD patients, 131 patients (212 samples) were TBI positive. Of the 212 samples, 149 (70.3%), 47 (22%), and 16 (7.5%) were hypothyroid, euthyroid, and hyperthyroid, respectively. The three thyrotropin receptor antibody (TSH-R-Ab) assays were negative in 90 controls devoid of autoimmune thyroid disorders. In contrast, the Turbo cyclic adenosine 3',5'-monophosphate (cAMP) TBI, Thyretain TBI, and the binding assays detected TBI in 212 (100%), 168 (79%), and 138/180 (65%) samples, respectively (p< 0.001). Turbo highly correlated with thyroid function (p< 0.001). The percentage inhibition in both Turbo and Thyretain correlated with TSH-R-Ab binding assay positivity (both p< 0.001). The two bioassays correlated (r = 0.8, p< 0.001), and the Bland-Altman plot displayed no significant bias (0.24). Values scatter with slight systemic deviation between TBI mean values of 10%-50% inhibition, with higher Turbo than Thyretain results. Intra-assay validation demonstrated adequate precision with a very low coefficient of variation (average CV 5.4%) and lower CV with samples with a high inhibitory effect (CVAverage= 1.7% for a sample with 95% inhibition Thyretain). CV did not differ between users (p = 0.35) and lots (p = 0.121). The IC50/IC80 values were 1.55 ng/mL/3.48 ng/mL for Turbo and 6.76 ng/mL/18.46 ng/mL for Thyretain, respectively, demonstrating the markedly higher sensitivity of Turbo.
Conclusions: The novel, easy-to-perform, rapid, and reliable Turbo TSH-R blocking bioassay detected significantly more TBI than the established immunoassays, emphasizing its higher analytical performance and clinical utility in the management of patients with AITD.
Keywords: autoimmune thyroid disease; blocking TSH-R bioassay; homogeneous cAMP biosensor; thyroid-blocking immunoglobulins; thyrotropin receptor blocking antibodies.
Copyright © 2024 George, Lotz, Luffy, Ganz, Wolf and Kahaly.
Conflict of interest statement
The authors declare that the research was conducted in the absence of any commercial or financial relationships that could be construed as a potential conflict of interest.
Figures
 Turbo™ TBI
  Thyretain® TBI
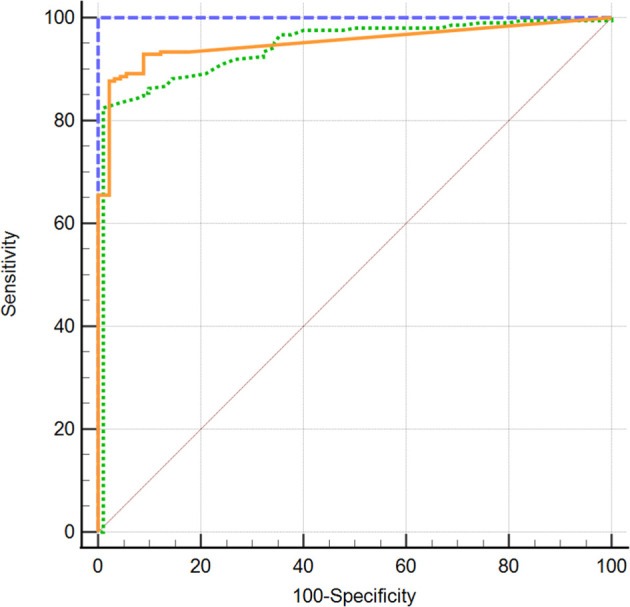
  TRAb immunoassay. ROC diagram of 302 samples (212 AITD and 90 controls) tested with Turbo™, Thyretain® TBI and TRAb immunoassay. AUC (95% CI): Turbo™ 1,000 (0,986 - 1,000), Thyretain® 0,950 (0,919 -0,972), and TRAb 0.952 (0.921-0.973).
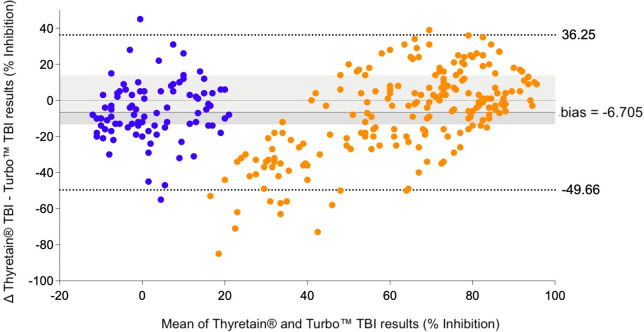
 , AITD;
  , control. Bland–Altman plot of Turbo™ and Thyretain® TBI results.
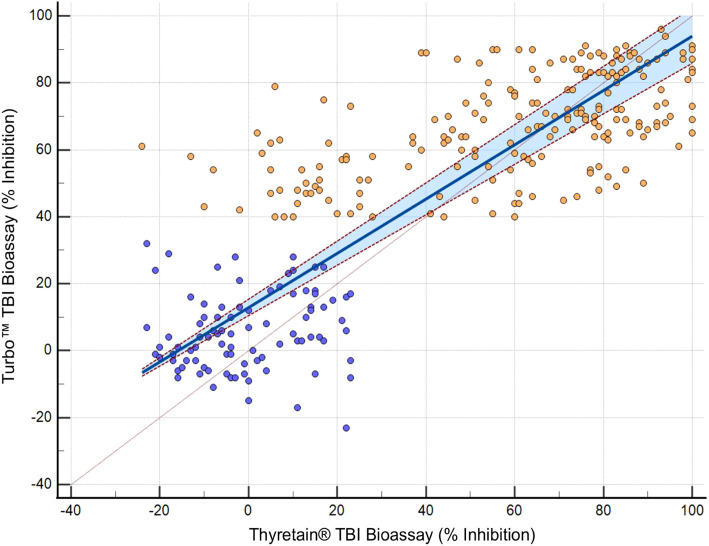
 , AITD;
  , control. Passing–Bablok regression of Turbo™ and Thyretain® TBI results. The blue area marks a 95% confidence interval. N = 302 (221 subjects). Spearman’s Rho, 0.8; 95% CI, 0.75–0.84; p< 0.001. y = 12.878378 + 0.810811x.
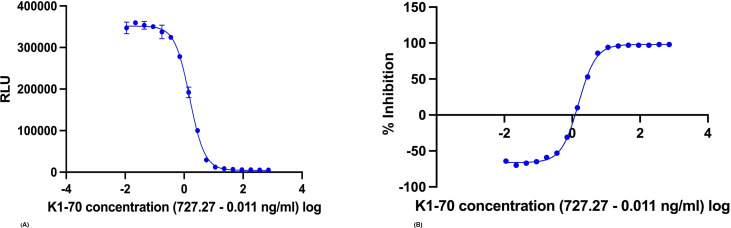
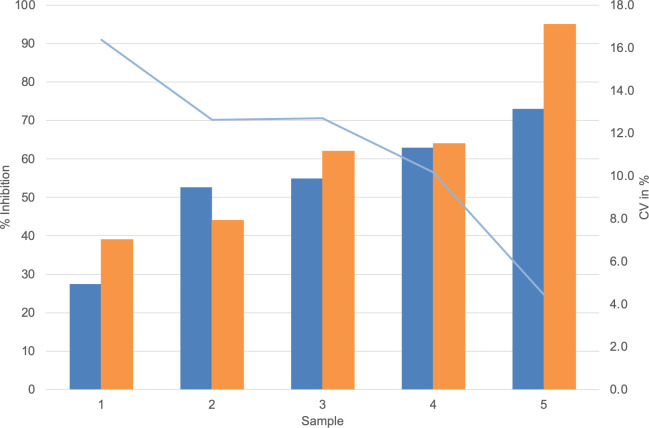
 , Average Turbo™ TBI values;
  , CV Turbo™ TBI;
  , Average Thyretain® TBI values. Mean value of the Turbo™ TBI precision measurements with associated CV and the Thyretain® TBI initial value of the respective sample. Cutoff values: Turbo™ TBI > 40 percentage inhibition; Thyretain® TBI > 34 percentage inhibition. The average inhibition values are 59.45% (SD 54.15%) for user 1 and 54.15% (SD 16.72%) for user 2, with average CVs of 6% (SD 0.0492) for user one and 8% (SD 0.0735) for user 2 (p = 0.32). There was no statistical difference between Turbo™ and Thyretain® values: Thyretain® had an average inhibition of 60.8% (SD 22.02) and Turbo™ had an inhibition of 54.20% (SD, 16.92) (p = 0.27).
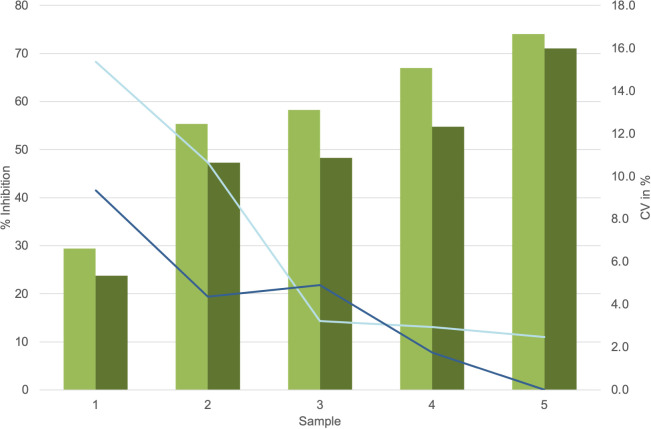
 , Average values lot 1;
  , Average values lot 2;
  , CV lot 1;
  , CV lot 2. Presentation of the Turbo™ TBI mean values and CV. Cutoff values: Turbo™ TBI >40 percentage inhibition, Thyretain® TBI >34 percentage inhibition. For the respective lots, the average inhibition values are 56.8% (SD 16.06%) for lot 1 and 49.0% (SD 15.69%) for lot 2, with no significant difference (p = 0.08). The CV is 7% (SD, 0.06) for lot 1 and 4% (SD, 0.03) for lot 2 (p = 0.34).
References
MeSH terms
Substances
LinkOut - more resources
Full Text Sources