

Improving prediction accuracy of spread through air spaces in clinical-stage T1N0 lung adenocarcinoma using computed tomography imaging models
- PMID: 39534334
- PMCID: PMC11551290
- DOI: 10.1016/j.xjon.2024.07.018
Improving prediction accuracy of spread through air spaces in clinical-stage T1N0 lung adenocarcinoma using computed tomography imaging models
Abstract
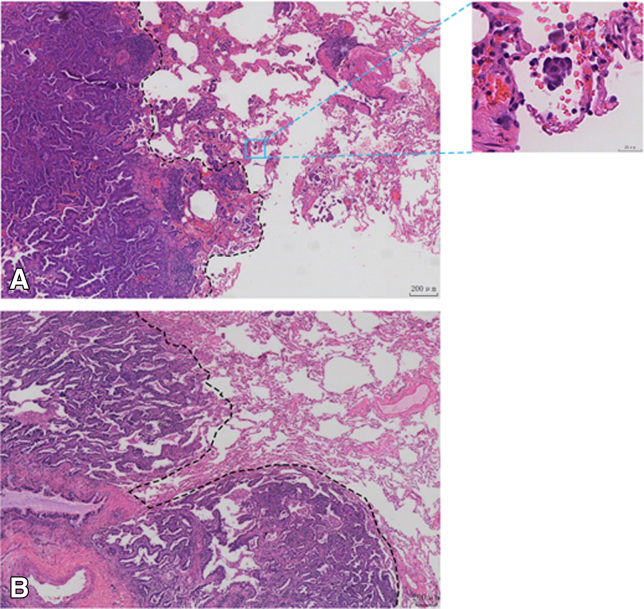
Objectives: To develop computed tomography (CT)-based models to increase the prediction accuracy of spread through air spaces (STAS) in clinical-stage T1N0 lung adenocarcinoma.
Methods: Three cohorts of patients with stage T1N0 lung adenocarcinoma (n = 1258) were analyzed retrospectively. Two models using radiomics and deep neural networks (DNNs) were established to predict the lung adenocarcinoma STAS status. For the radiomic models, features were extracted using PyRadiomics, and 10 features with nonzero coefficients were selected using least absolute shrinkage and selection operator regression to construct the models. For the DNN models, a 2-stage (supervised contrastive learning and fine-tuning) deep-learning model, MultiCL, was constructed using CT images and the STAS status as training data. The area under the curve (AUC) was used to verify the predictive ability of both model types for the STAS status.
Results: Among the radiomic models, the linear discriminant analysis model exhibited the best performance, with AUC values of 0.8944 (95% confidence interval [CI], 0.8241-0.9502) and 0.7796 (95% CI, 0.7089-0.8448) for predicting the STAS status on the test and external validation cohorts, respectively. Among the DNN models, MultiCL exhibited the best performance, with AUC values of 0.8434 (95% CI, 0.7580-0.9154) for the test cohort and 0.7686 (95% CI, 0.6991-0.8316) for the external validation cohort.
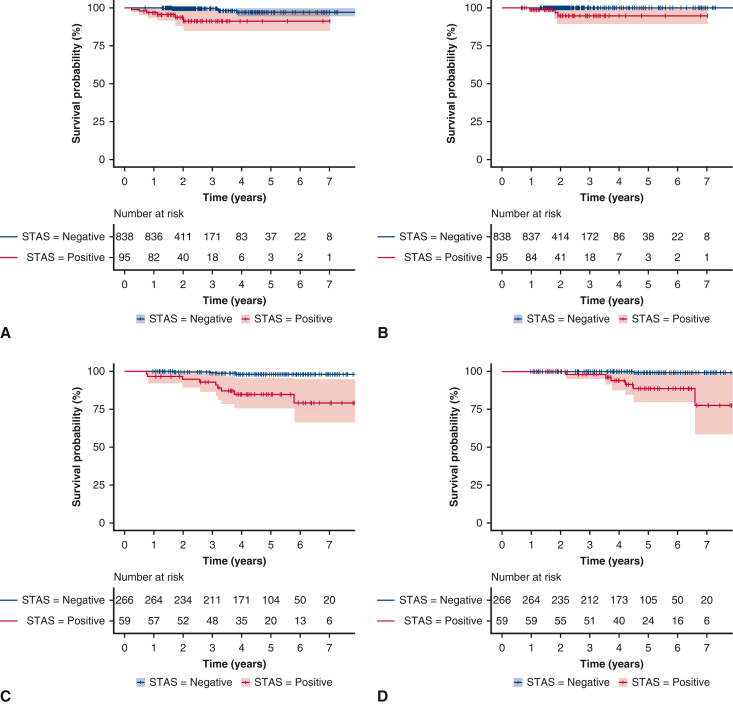
Conclusions: CT-based imaging models (radiomics and DNNs) can accurately identify the STAS status of clinical-stage T1N0 lung adenocarcinoma, potentially guiding surgical decision making and improving patient outcomes.
Keywords: clinical-stage T1N0 lung adenocarcinoma; deep neural network; radiomics; spread through air spaces.
© 2024 The Author(s).
Conflict of interest statement
The authors reported no conflicts of interest. The Journal policy requires editors and reviewers to disclose conflicts of interest and to decline handling or reviewing manuscripts for which they may have a conflict of interest. The editors and reviewers of this article have no conflicts of interest.
Figures


Similar articles
-
Performance of deep learning model and radiomics model for preoperative prediction of spread through air spaces in the surgically resected lung adenocarcinoma: a two-center comparative study.Transl Lung Cancer Res. 2024 Dec 31;13(12):3486-3499. doi: 10.21037/tlcr-24-646. Epub 2024 Dec 27. Transl Lung Cancer Res. 2024. PMID: 39830743 Free PMC article.
-
Prediction of early lung adenocarcinoma spread through air spaces by machine learning radiomics: a cross-center cohort study.Transl Lung Cancer Res. 2024 Dec 31;13(12):3443-3459. doi: 10.21037/tlcr-24-565. Epub 2024 Dec 27. Transl Lung Cancer Res. 2024. PMID: 39830767 Free PMC article.
-
The Value of CT-Based Radiomics for Predicting Spread Through Air Spaces in Stage IA Lung Adenocarcinoma.Front Oncol. 2022 Jul 8;12:757389. doi: 10.3389/fonc.2022.757389. eCollection 2022. Front Oncol. 2022. PMID: 35880159 Free PMC article.
-
Advances in the prediction of spread through air spaces with imaging in lung cancer: a narrative review.Transl Cancer Res. 2023 Mar 31;12(3):624-630. doi: 10.21037/tcr-22-2593. Epub 2023 Mar 1. Transl Cancer Res. 2023. PMID: 37033348 Free PMC article. Review.
-
Predictive value of radiomic features extracted from primary lung adenocarcinoma in forecasting thoracic lymph node metastasis: a systematic review and meta-analysis.BMC Pulm Med. 2024 May 18;24(1):246. doi: 10.1186/s12890-024-03020-x. BMC Pulm Med. 2024. PMID: 38762472 Free PMC article.
Cited by
-
Research hotspots and trends in lung cancer STAS: a bibliometric and visualization analysis.Front Oncol. 2025 Jan 3;14:1495911. doi: 10.3389/fonc.2024.1495911. eCollection 2024. Front Oncol. 2025. PMID: 39830648 Free PMC article.
-
Lobar versus sub-lobar resection for clinical stage IA (≤ 2 cm) lung neuroendocrine tumor with spread through air spaces: a multi-center study.Updates Surg. 2025 Jun 21. doi: 10.1007/s13304-025-02289-9. Online ahead of print. Updates Surg. 2025. PMID: 40544229
-
Development and internal validation of predictive models for spread through air spaces in clinical stage IA lung adenocarcinoma.Gen Thorac Cardiovasc Surg. 2025 Apr 28. doi: 10.1007/s11748-025-02152-z. Online ahead of print. Gen Thorac Cardiovasc Surg. 2025. PMID: 40293570
References
-
- Rami-Porta R., Nishimura K.K., Giroux D.J., et al. The International Association for the Study of Lung Cancer Lung Cancer Staging Project: proposals for revision of the TNM stage groups in the forthcoming (ninth) edition of the TNM classification for lung cancer. J Thorac Oncol. 2024;19(7):1007–1027. - PubMed
-
- Travis W.D., Brambilla E., Nicholson A.G., et al. The 2015 World Health Organization classification of lung tumors: impact of genetic, clinical and radiologic advances since the 2004 classification. J Thorac Oncol. 2015;10(9):1243–1260. - PubMed
-
- Chen S., Ye T., Yang S., et al. Prognostic implication of tumor spread through air spaces in patients with pathologic N0 lung adenocarcinoma. Lung Cancer. 2022;164:33–38. - PubMed
LinkOut - more resources
Full Text Sources
