

A novel nonlinear bispectrum analysis for dynamical complex oscillations
- PMID: 39534364
- PMCID: PMC11551096
- DOI: 10.1007/s11571-023-09953-z
A novel nonlinear bispectrum analysis for dynamical complex oscillations
Abstract
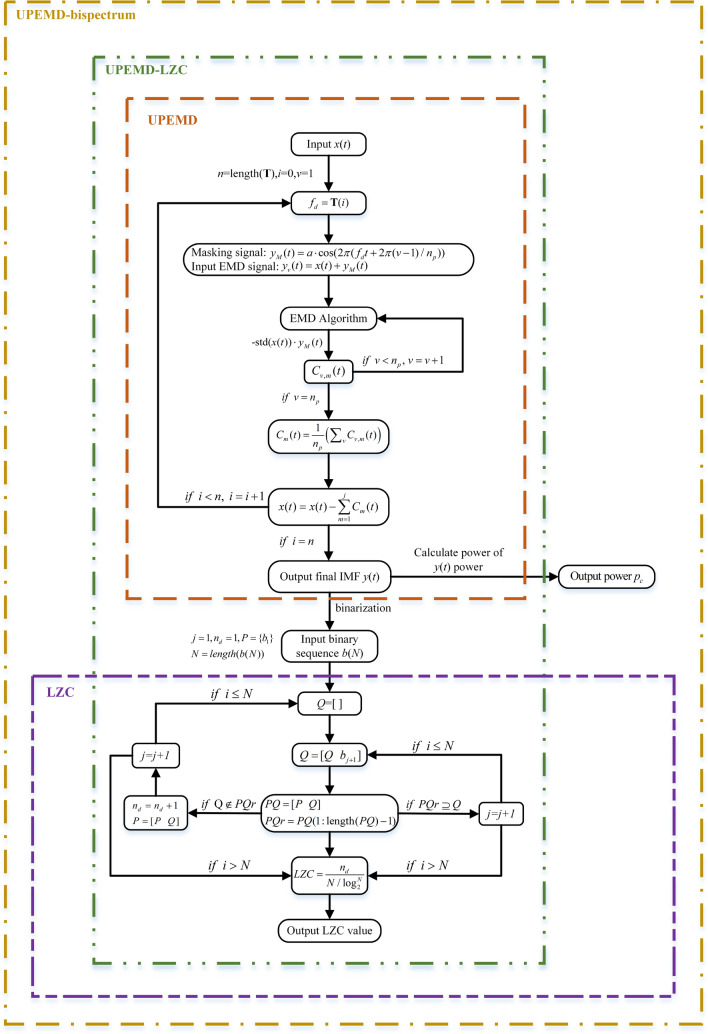
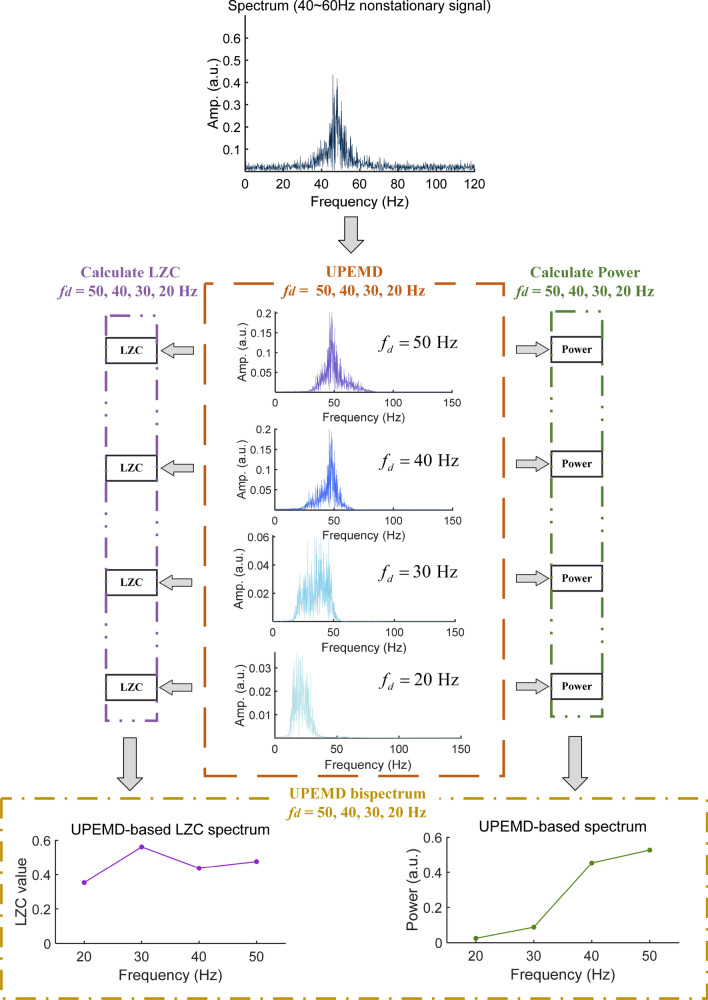
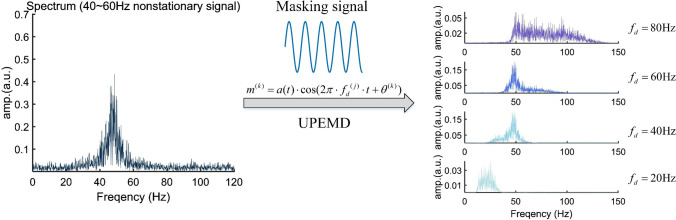
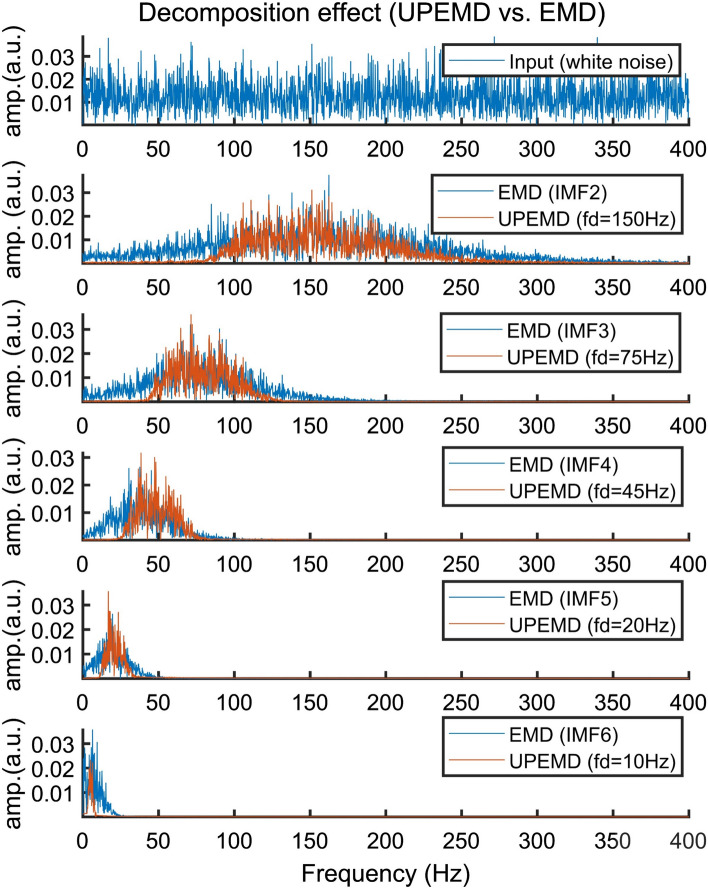
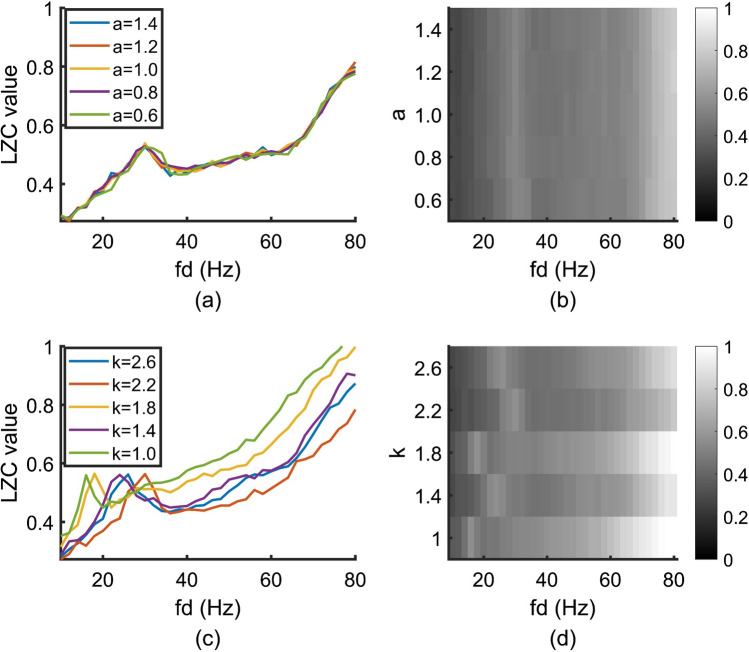
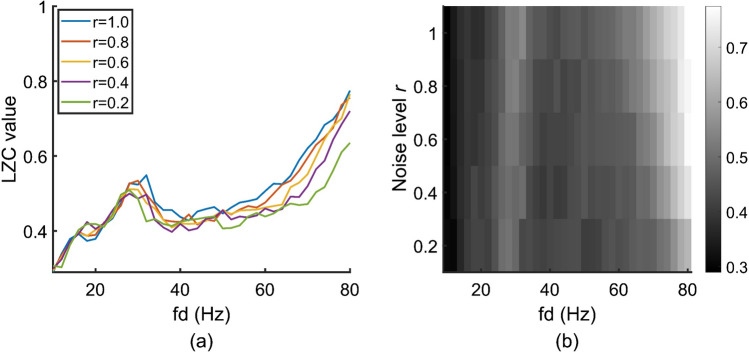
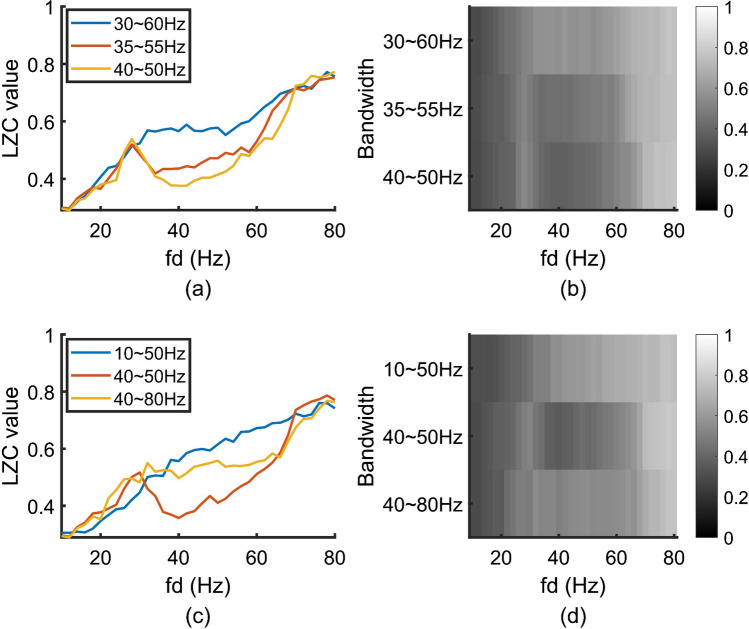
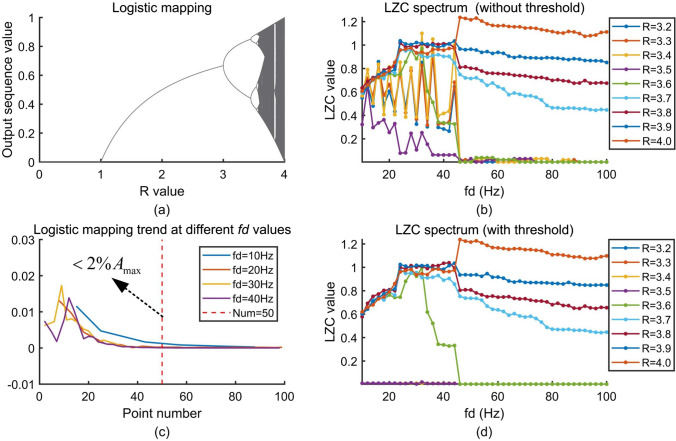
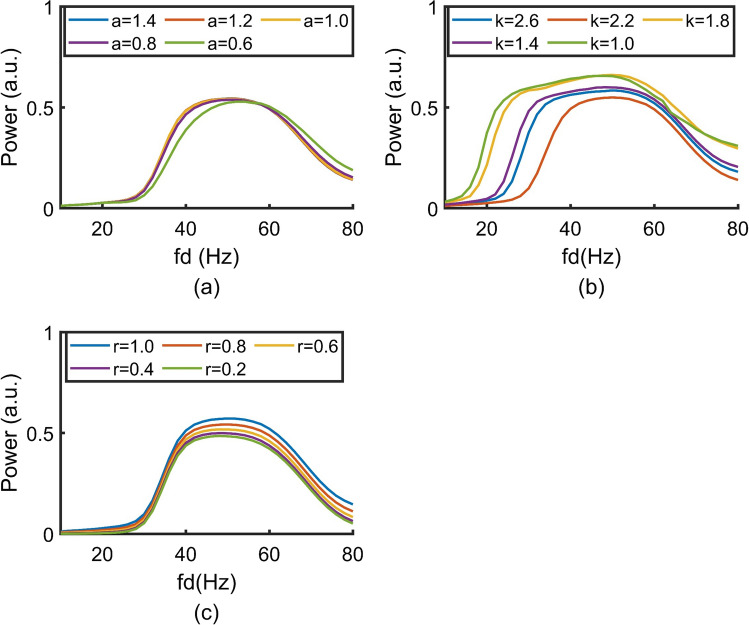
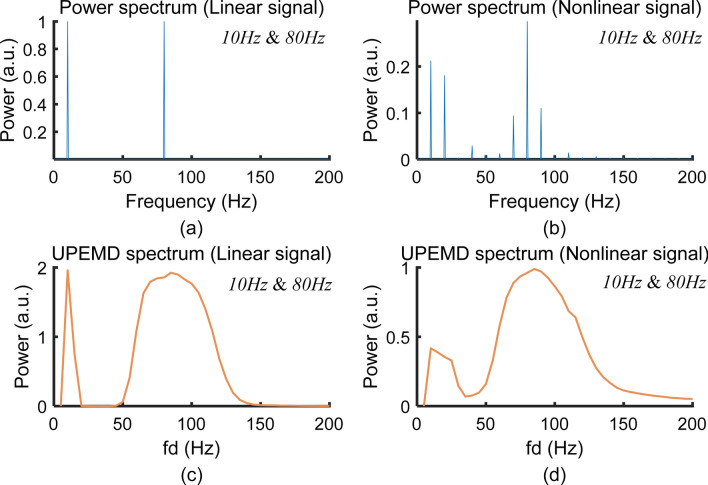
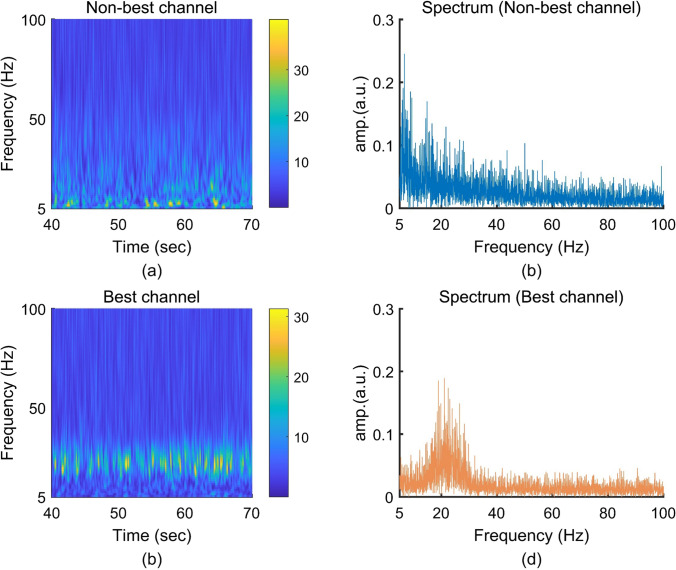
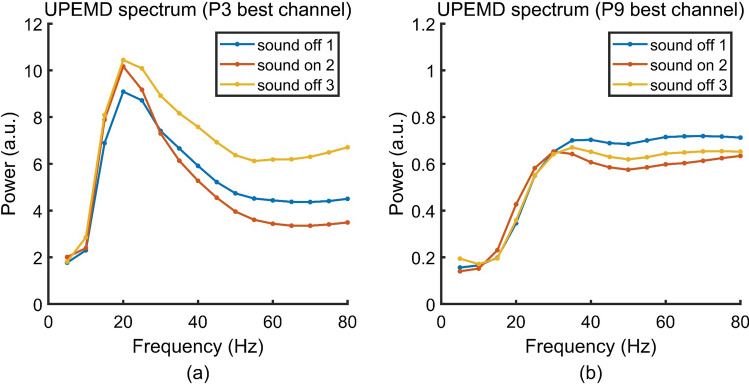
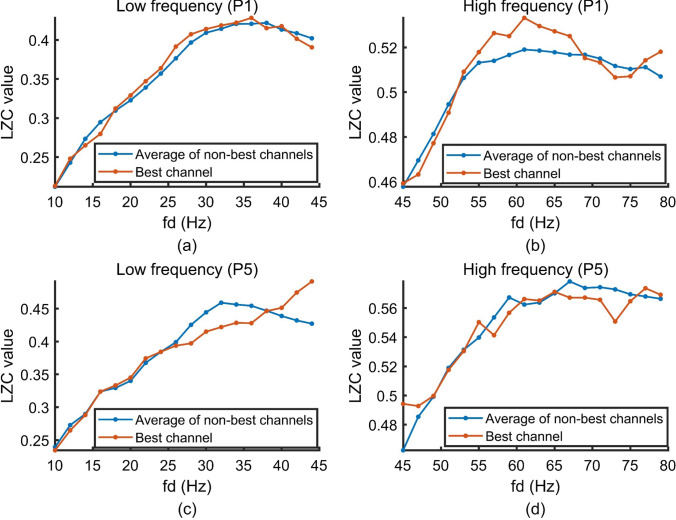
In this study, we proposed a novel set of bispectrum in constructing both frequency power and complexity spectrum. The uniform phase empirical mode decomposition (UPEMD) was implemented to obtain nonlinear extraction while guaranteeing explicit frequencies. Lepel-Ziv complexity (LZC) and frequency power per mode were used for comprehensive frequency spectra. To examine the performances of the proposed method and meanwhile optimize routine methodological parameters, either chaotic logistic maps or a default non-stationary simulation in 40 ~ 60 Hz along with several challenges were designed. The simulation results showed the UPEMD-based LZC spectrum distinguishes the degree of complexity, reflecting the bandwidth and noise level of the inputs. The UPEMD-based power spectrum on the other side presents power distribution of nonlinear and nonstationary oscillation across multiple frequencies. In addition, given gait disturbance is an unsolved symptom in adaptive deep brain stimulation (DBS) for Parkinson's disease (PD), meanwhile considering the representative of deep brain activities to the complex oscillations, such data were analyzed further. Our results showed the high-frequency band (45 ~ 80 Hz) of the UPEMD-based LZC spectrum reflects the impact of auditory cues in modulating the complexity of DBS recording. Such an increase in complexity (45 ~ 60 Hz) reduces shortly after the cue was removed. As for the UPEMD-based power spectrum, decreasing power over the higher frequency region (> 30 Hz) was shown with auditory cues. These results manifest the potential of the proposed methods in reflecting gait improvement for PD. The proposed bispectrum reflected both the nonlinear complexity and power spectrum analyses, enabling examining targeted frequencies with refined resolution.
Supplementary information: The online version contains supplementary material available at 10.1007/s11571-023-09953-z.
Keywords: Electrophysiological oscillation; Gait; Lempel–Ziv complexity; Parkinson's disease; UPEMD-based bispectrum.
© The Author(s), under exclusive licence to Springer Nature B.V. 2023. Springer Nature or its licensor (e.g. a society or other partner) holds exclusive rights to this article under a publishing agreement with the author(s) or other rightsholder(s); author self-archiving of the accepted manuscript version of this article is solely governed by the terms of such publishing agreement and applicable law.
Conflict of interest statement
Conflict of interestThe authors have no competing interests to declare that are relevant to the content of this article. The experiment on human subjects was approved by the local ethics committee of John Radcliffe Hospital and King's College Hospital.
Figures

Similar articles
-
Multiple characteristics analysis of Alzheimer's electroencephalogram by power spectral density and Lempel-Ziv complexity.Cogn Neurodyn. 2016 Apr;10(2):121-33. doi: 10.1007/s11571-015-9367-8. Epub 2015 Nov 12. Cogn Neurodyn. 2016. PMID: 27066150 Free PMC article.
-
A Novel Framework in Quantifying Oscillatory Coupling to Gait Disturbance in Parkinson's Disease.Annu Int Conf IEEE Eng Med Biol Soc. 2022 Jul;2022:263-266. doi: 10.1109/EMBC48229.2022.9871963. Annu Int Conf IEEE Eng Med Biol Soc. 2022. PMID: 36086225
-
Comparative Study on Feature Extraction of Marine Background Noise Based on Nonlinear Dynamic Features.Entropy (Basel). 2023 May 25;25(6):845. doi: 10.3390/e25060845. Entropy (Basel). 2023. PMID: 37372189 Free PMC article.
-
Sixty-hertz stimulation improves bradykinesia and amplifies subthalamic low-frequency oscillations.Mov Disord. 2017 Jan;32(1):80-88. doi: 10.1002/mds.26837. Epub 2016 Nov 8. Mov Disord. 2017. PMID: 27859579 Review.
-
Abnormal neural oscillations during gait and dual-task in Parkinson's disease.Front Syst Neurosci. 2022 Sep 15;16:995375. doi: 10.3389/fnsys.2022.995375. eCollection 2022. Front Syst Neurosci. 2022. PMID: 36185822 Free PMC article. Review.
Cited by
-
Auditory cues modulate the short timescale dynamics of STN activity during stepping in Parkinson's disease.Brain Stimul. 2024 May-Jun;17(3):501-509. doi: 10.1016/j.brs.2024.04.006. Epub 2024 Apr 16. Brain Stimul. 2024. PMID: 38636820 Free PMC article.
References
-
- Aboy M, Hornero R, Abasolo D, Alvarez D (2006) Interpretation of the Lempel-Ziv complexity measure in the context of biomedical signal analysis. IEEE t Biomed Eng 53(11):2282–2288 - PubMed
-
- Bai Y, Liang ZH, Li XL (2015) A permutation Lempel-Ziv complexity measure for EEG analysis. Biomed Signal Process Control 19:102–114
-
- Baltadjieva R, Giladi N, Gruendlinger L et al (2006) Marked alterations in the gait timing and rhythmicity of patients with de novo Parkinson’s disease. Eur J Neurosci 24(6):1815–1820 - PubMed
-
- Barnhart BL, Eichinger WE (2011) Analysis of sunspot variability using the Hilbert - Huang transform. Sol Phys 269(2):439–449
-
- Bucolo M, Fortuna L, Larosa M (2004) Complex dynamics through fuzzy chains. IEEE Trans Fuzzy Syst 12(3):289–295
LinkOut - more resources
Full Text Sources
Research Materials
