. 2024;62(7):6719-6744.
doi: 10.1007/s00382-024-07233-y. Epub 2024 May 6.

Downscaling the ocean response to the Madden-Julian Oscillation in the Northwest Atlantic and adjacent shelf seas

Affiliations

Downscaling the ocean response to the Madden-Julian Oscillation in the Northwest Atlantic and adjacent shelf seas

Christoph Renkl et al. Clim Dyn. 2024.

Abstract

Subseasonal-to-seasonal (S2S) prediction is a global effort to forecast the state of the atmosphere and ocean with lead times between two weeks and a season. This study explores the feasibility of S2S prediction of the ocean using a variety of tools including statistical analysis, a statistical-dynamical mixed layer model, and a regional, high-resolution ocean circulation model based on physical principles. Ocean predictability on S2S timescales is analyzed by compositing winter sea surface temperature (SST) anomalies in the North Atlantic with respect to the state of the Madden-Julian Oscillation (MJO). It is found that statistically significant, large-scale SST changes, particularly along the eastern seaboard of North America, can be related to the MJO. This signal is shown to be driven by anomalous air-sea heat fluxes caused by atmospheric perturbations in response to the MJO. The high-resolution model of the Gulf of Maine and Scotian Shelf is used to downscale the mean ocean response to the MJO. The model is able to capture the observed relationship between the MJO and SST in the northwest Atlantic. It is also shown that the anomalous atmospheric circulation in response to the MJO leads to anomalous upwelling on the Scotian Shelf. Overall, this study demonstrates that it is feasible, and of value, to use regional ocean models for S2S prediction.

Keywords: Dynamical downscaling; Madden–Julian oscillation; Subseasonal-to-seasonal prediction; Teleconnections.


Conflict of interest statement

Conflict of interestThe authors have no relevant financial or non-financial interests to disclose.

Figures

Fig. 1
Fig. 1
Winter SST in the North Atlantic. OISSTv2 winter mean SST (left), and standard deviation of bandpass-filtered SST anomalies Ta(x,t) for the period 1981–2019 (right). The insets show an enlarged view of the Middle Atlantic Bight (MAB), Gulf of Maine (GoM), and Scotian Shelf regions indicated by the black quadrangle. In these panels, values are only shown at grid points with water depth less than or equal to 1000 m. The light area near the coast shows the climatological sea ice cover
Fig. 2
Fig. 2
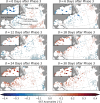
Composites of bandpass-filtered SST anomalies T¯a for lags δ= 0, 6, ..., 30 days after MJO phase 3 during winter when ARMM> 1. Maps show the spatial structure of the composites for the whole study area and in the Middle Atlantic Bight, Gulf of Maine, and Scotian Shelf region (insets). Only anomalies statistically different from zero at the 10% significance level are shown. Shaded areas near the coast show the climatological sea ice cover
Fig. 3
Fig. 3
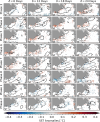
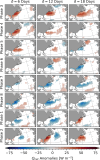
Composites of SST (colors) and Qnet (contours) with respect to all MJO phases during winter when ARMM> 1. Areas of significantly increased and reduced net heat flux from the atmosphere into the surface ocean are marked by solid and dashed contours, respectively. Each row represents a specific phase and the columns refer to lags δ= 6, 12, 18, and 24 days after that phase. All shown anomalies are statistically different from zero at the 10% significance level. Shaded areas near the coast show the climatological sea ice cover
Fig. 4
Fig. 4
Estimated parameters and fit of the surface mixed layer model during winter. a Measure of model fit R2 defined by (13). b Mixed layer depth Hm in meters. c Damping rate λ in day−1. Note that the color scales have been clipped. Shaded areas near the coast show the climatological sea ice cover. Results are only shown at grid points where R2 is statistically different from zero at the 5% significance level
Fig. 5
Fig. 5
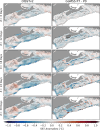
Composites of observed and predicted SST anomalies at lag δ= 24 days after phases 3 (a, b) and 7 (c, d) during winter when the RMM amplitude ARMM> 1. Only anomalies statistically different from zero at the 10% significance level are shown. Shaded areas near the coast show the climatological sea ice cover. Note that the composites of the observations were computed for the period 1981–2019
Fig. 6
Fig. 6
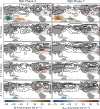
Atmospheric circulation anomalies during and after MJO phases 3 (left) and 7 (right). Bandpass-filtered outgoing longwave radiation (OLR, left color scale) anomalies are only shown at lag δ= 0 days over the Indian Ocean, Maritime Continent, and western Pacific to illustrate the large-scale convection anomaly associated with the MJO. Negative (positive) values refer enhanced (suppressed) convection. Contours show anomalies of 500 hPa geopotential height (interval 20 m, zero line omitted) illustrating the Rossby wave train that propagates from the tropics to the North Atlantic region in response to the MJO. Dashed lines refer to negative values. In the North Atlantic, composites of net heat flux (Qnet, right color scale) are shown. These fields are a subset of the composites shown in Figure A1
Fig. 7
Fig. 7
Mean hydrographic conditions predicted predicted by the GoMSS control run P0. a Mean sea surface temperature. b Mean surface salinity. The maps show model grid points where the water depth <2000 m. c Ocean temperature and d salinity along the Scotian Shelf section marked by the black line in panels a and c. Black contours show the associated in-situ density σ=ρ-1000 kg m-3. Abbreviated locations referenced in the text: Gulf of Maine (GoM), Grand Banks (GB), Newfoundland (NL)
Fig. 8
Fig. 8
Observed composites and predictions of SST anomalies with respect to MJO phase 3. Left column: composite maps of bandpass-filtered, observed SST anomalies when ARMM> 1 during winter calculated for the period 1993–2010. Right column: SST anomalies predicted by GoMSS (P3–P0). All anomalies are relative to lag δ= 0 days
Fig. 9
Fig. 9
Observed composites and predictions of SST anomalies with respect to MJO phase 7. The format is the same as Fig. 8
Fig. 10
Fig. 10
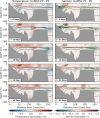
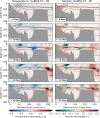
Ocean temperature and salinity anomalies along the Scotian Shelf section with respect to MJO phase 3 predicted by GoMSS (P3–P0). Contours show the predicted in-situ density σ
Fig. 11
Fig. 11
Ocean temperature and salinity anomalies along the Scotian Shelf section with respect to MJO phase 7 predicted by GoMSS (P7–P0). Contours show the predicted in-situ density σ
Fig. 12
Fig. 12
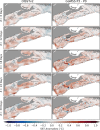
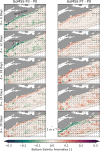
Bottom salinity anomalies predicted by GoMSS (left column: P3–P0, right column: P7–P0). Vectors show the composites of bandpass-filtered CFSR wind anomalies at 10 m height with respect to MJO phases 3 (left column) and 7 (right column) when ARMM> 1 during winter. Note that the Bay of Fundy region has been masked out
Fig. 13
Fig. 13
Composites of bandpass-filtered Qnet anomalies for all MJO phases during winter when ARMM> 1. Each row represents a specific phase and the columns refer to lags δ= 6, 12, 18, and 24 days after that phase. All shown anomalies are statistically different from zero at the 10% significance level. Shaded areas near the coast show the climatological sea ice cover

Similar articles

References

    1. Adames ÁF, Wallace JM, Monteiro JM (2016) Seasonality of the structure and propagation characteristics of the MJO. J Atmos Sci 73(9):3511–3526. 10.1175/JAS-D-15-0232.1
    1. Amaya DJ, Jacox MG, Dias J, Alexander MA, Karnauskas KB, Scott JD, Gehne M (2022) Subseasonal-to-seasonal forecast skill in the California current system and its connection to coastal Kelvin waves. J Geophys Res Oceans 127(1):e2021JC017892. 10.1029/2021JC017892
    1. Baxter S, Weaver S, Gottschalck J, Xue Y (2014) Pentad evolution of wintertime impacts of the Madden–Julian Oscillation over the contiguous United States. J Clim 27(19):7356–7367. 10.1175/JCLI-D-14-00105.1
    1. Buckley MW, Ponte RM, Forget G, Heimbach P (2014) Low-frequency SST and upper-Ocean heat content variability in the North Atlantic. J Clim 27(13):4996–5018. 10.1175/JCLI-D-13-00316.1
    1. Burdett HL, Wright H, Smale DA (2019) Photophysiological responses of canopy-forming kelp species to short-term acute warming. Front Mar Sci. 10.3389/fmars.2019.00516

LinkOut - more resources