YTHDC1 Regulates the Migration, Invasion, Proliferation, and Apoptosis of Rheumatoid Fibroblast-Like Synoviocytes
- PMID: 39534605
- PMCID: PMC11554466
- DOI: 10.3389/fimmu.2024.1440398
YTHDC1 Regulates the Migration, Invasion, Proliferation, and Apoptosis of Rheumatoid Fibroblast-Like Synoviocytes
Abstract
Background: Rheumatoid arthritis (RA), a chronic autoimmune condition, is characterized by persistent synovial inflammation, bone degradation, and progressive joint deterioration. Despite considerable research efforts, the precise molecular mechanism underlying RA remains elusive. This investigation aims to elucidate the potential role and molecular mechanism of N6-methyladenosine (m6A) methylation regulators in the pathogenesis of RA.
Methods: In this study, we employed bioinformatics tools to elucidate the association between RA and m6A modifications, aiming to identify potential biological markers. We extracted datasets GSE12021, GSE55235, and GSE55457 from the Gene Expression Omnibus (GEO) database for comprehensive analysis. Utilizing differential expression analysis, protein-protein interaction (PPI) analysis, and single-cell sequencing techniques, we identified pivotal hub genes implicated in the pathogenesis of RA. Subsequently, we assessed the correlation between these hub genes and the pathogenesis of RA using Gene Set Enrichment Analysis (GSEA). Both in vivo and in vitro experiments were performed to confirm the expression and functional roles of the identified key hub gene in RA.
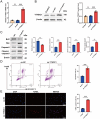
Results: Differential expression analysis, PPI analysis, and single-cell analysis identified three key hub genes (YTHDC1, YTHDC2, and YTHDF2) associated with RA. GSEA results further revealed that these genes are enriched in pathways associated with inflammatory responses. Subsequent correlation analysis demonstrated a significant negative correlation between YTHDC1 expression and CD8+ T cell levels. Notably, the gene and protein expression levels of YTHDC1 and YTHDF2 were significantly reduced in the synovial tissue of RA patients. Furthermore, silencing YTHDC1 in fibroblast-like synoviocytes (FLSs) significantly inhibited their migration, invasion, proliferation, and induced apoptosis.
Conclusion: YTHDC1 may potentially be involved in the pathogenesis of RA through its regulation of migration, invasion, proliferation, and apoptosis in FLSs.
Keywords: M6A modification; YTHDC1; apoptosis; proliferation; rheumatoid arthritis.
Copyright © 2024 Feng, Yang, Xiao, Yuan, Chen, Zhang, Zhang, Tan and Guo.
Conflict of interest statement
The authors declare that the research was conducted in the absence of any commercial or financial relationships that could be construed as a potential conflict of interest.
Figures


Similar articles
-
Increased m6A RNA methylation and METTL3 expression may contribute to the synovitis progression of rheumatoid arthritis.Exp Cell Res. 2024 Oct 1;442(2):114237. doi: 10.1016/j.yexcr.2024.114237. Epub 2024 Sep 6. Exp Cell Res. 2024. PMID: 39245197
-
LncRNA PICSAR promotes cell proliferation, migration and invasion of fibroblast-like synoviocytes by sponging miRNA-4701-5p in rheumatoid arthritis.EBioMedicine. 2019 Dec;50:408-420. doi: 10.1016/j.ebiom.2019.11.024. Epub 2019 Nov 30. EBioMedicine. 2019. PMID: 31791845 Free PMC article.
-
Influences of the lncRNA TUG1-miRNA-34a-5p network on fibroblast-like synoviocytes (FLSs) dysfunction in rheumatoid arthritis through targeting the lactate dehydrogenase A (LDHA).J Clin Lab Anal. 2021 Sep;35(9):e23969. doi: 10.1002/jcla.23969. Epub 2021 Aug 17. J Clin Lab Anal. 2021. PMID: 34403518 Free PMC article.
-
The role of non-coding RNAs in fibroblast-like synoviocytes in rheumatoid arthritis.Int J Rheum Dis. 2024 Oct;27(10):e15376. doi: 10.1111/1756-185X.15376. Int J Rheum Dis. 2024. PMID: 39439368 Review.
-
The p53 status in rheumatoid arthritis with focus on fibroblast-like synoviocytes.Immunol Res. 2021 Jun;69(3):225-238. doi: 10.1007/s12026-021-09202-7. Epub 2021 May 13. Immunol Res. 2021. PMID: 33983569 Review.
Cited by
-
Exosome circ-CBLB promotes M1 macrophage polarization in rheumatoid arthritis through the TLR3/TRAF3 signaling axis.Front Immunol. 2025 Jul 17;16:1627389. doi: 10.3389/fimmu.2025.1627389. eCollection 2025. Front Immunol. 2025. PMID: 40746530 Free PMC article.
-
The Role and Mechanism of Protein Post‑Translational Modification in Rheumatoid Arthritis.J Inflamm Res. 2025 Jul 11;18:9055-9078. doi: 10.2147/JIR.S528487. eCollection 2025. J Inflamm Res. 2025. PMID: 40666378 Free PMC article. Review.
References
MeSH terms
Substances
LinkOut - more resources
Full Text Sources
Medical
Research Materials

