. 2024 Sep 4;9(10):1163-1177.
doi: 10.1016/j.jacbts.2024.06.012. eCollection 2024 Oct.

Senescence and Inflamm-Aging Are Associated With Endothelial Dysfunction in Men But Not Women With Atherosclerosis

Affiliations

Senescence and Inflamm-Aging Are Associated With Endothelial Dysfunction in Men But Not Women With Atherosclerosis

Pauline Mury et al. JACC Basic Transl Sci. .

Abstract

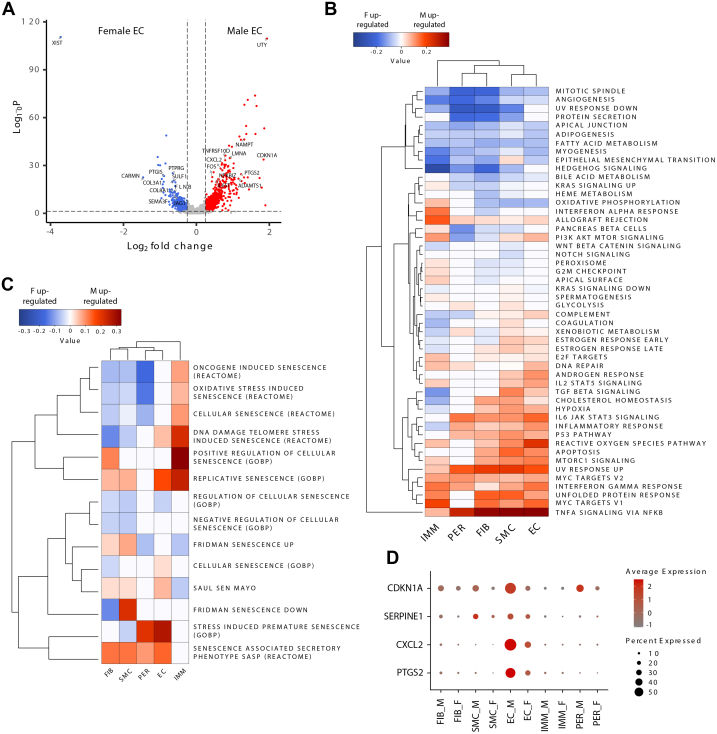
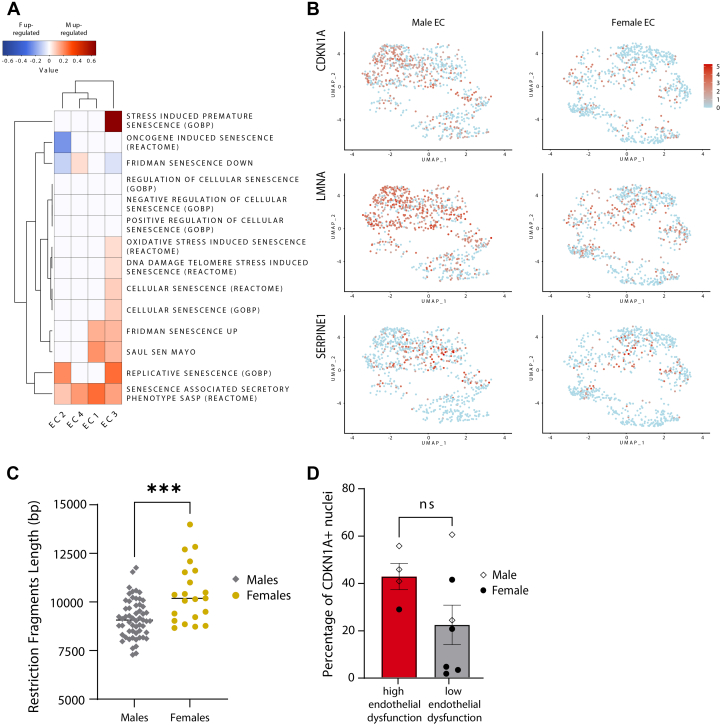
Coronary artery disease (CAD) is more prevalent in men than in women, with endothelial dysfunction, prodromal to CAD, developing a decade earlier in middle-aged men. We investigated the molecular basis of this dimorphism ex vivo in arterial segments discarded during surgery of CAD patients. The results reveal a lower endothelial relaxant sensitivity in men, and a senescence-associated inflammaging transcriptomic signature in endothelial cells. In women, cellular metabolism and endothelial maintenance pathways are conserved. This suggests that senolytic therapies to reduce risk of cardiovascular events in women with CAD may not be as effective as in men.

Keywords: coronary artery disease; endothelium-dependent relaxation; inflammaging; sex-dimorphism.


Conflict of interest statement

This work was supported by the Canadian Institutes of Health Research grant (PJT-162446 to Dr Thorin), and the Foundation of the Montreal Heart Institute (Dr Thorin). Drs Mury and Lambert have been supported by the postdoctoral program of the Fonds de la recherche du Québec. Dr Cagnone has received support from the Vision Health Research Network. Dr Dagher has received support from the Canadian Institutes of Health Research (grant FBD-183276). All other authors have reported that they have no relationships relevant to the contents of this paper to disclose.

Figures

None
Graphical abstract
Figure 1
Figure 1
Internal Thoracic Arteries From Female Donors Display a Better Endothelial Sensitivity to Acetylcholine (A) Endothelial-dependent relaxation to acetylcholine (ACh) was assessed ex vivo on pre-constricted arterial segments. (B) Half maximal effective concentration (EC50), maximal efficacy (Emax), and pre-contraction expressed as % of the maximal contraction induced by 127 mM KCl-physiological solution. Values are expressed as mean ± SEM of 40 male and 25 female arterial rings. The Mann-Whitney test was used to compare groups: male (M) = 63.9 nM (range: 18.6-121 nM) vs female (F) = 18.9 nM (range: 6.55-47.7 nM); P = 0.004. (C) Uniform manifold approximation and projection (UMAP) plot of annotated cell-types present in arteries. (D) Violin plot representing expression of one canonical marker by cell-type (FBLN1: fibroblast, MYH10: smooth muscle cell, PECAM1: endothelial cell, PTPRC: immune cell, MCAM: pericytes). (E) Feature plot showing the distribution of EC50 in the entire dataset. Red dots represent higher values of EC50 (low sensitivity to ACh), and blue dots represent lower values of EC50 (high sensitivity to ACh). Black boxes in the right represent a zoom-in of the endothelia cell (EC) cluster of interest for both EC50 distribution (top) and sex distribution (bottom). ∗∗P < 0.01. FIB = fibroblast; IMM = immune cell; PER = pericyte; SMC = smooth muscle cell.
Figure 2
Figure 2
Male ECs Exhibit a More Prominent Pro-Senescent and Proinflammatory Signature (A) Volcano plot showing differentially expressed genes between male and female ECs. Genes are considered significantly DE when FDR <0.05 and L2FC >±0.25. (B) Heatmap showing Gene set variation analysis (GSVA) of hallmark collection in the 5 cell types between males and females. Red and blue squares represent male and female overexpressed pathways, respectively. (C) Heatmap showing GSVA analysis of selected senescence-related gene sets between male and female cells. Red and blue squares represent male and female overexpressed pathways, respectively. (D) Dot plot showing expression of 4 selected genes associated to senescence and inflammation. AKT = protein kinase B; IL2 = interleukin 2; IL6 = interleukin 6; JAK = Janus kinase; KRAS = Kirsten rat sarcoma virus; MTOR = mammalian target of rapamycin; NFKB = nuclear factor kappa B; P13K = phosphatidylinositol 3-kinase; STAT3 = signal transducer and activator of transcription 3; STAT5 = signal transducer and activator of transcription 5; TGF = transforming growth factor; TNFA = tumor necrosis factor alpha; UV = ultraviolet; WNT = wingless-related integration site; all other abbreviations as in Figure 1.
Figure 3
Figure 3
Characterization of Sex-Specific Signatures of EC3 Subtype (A) UMAP plot showing EC subtypes clustered by similar transcriptomic patterns. (B) UMAP plot colored by sex. (C) Proportion of the 4 subclusters in male and female EC subtypes. (D) Dot plot showing the top 10 markers of our dataset for each EC subtype. (E) Heatmap showing GSVA analysis of hallmark collection in the 4 EC subtypes revealing the differential expression of biological pathways between male and female. Red and blue squares represent male and female overexpressed pathways, respectively. (F) Ridge plot showing the distribution of the “TNFA signaling via NFKB” gene set grouped by subtypes and sex. (G) Ridge plot showing the distribution of the “fatty acid metabolism” gene set grouped by subtypes and sex. (H) Feature plot showing the distribution of EC50 in the EC. Red dots represent higher values of EC50 and blue dots represent lower values of EC50 (higher endothelial sensitivity to ACh). (I) Density plot of EC50 distribution in EC subtypes. Values are scaled EC50. (J) Volcano plot showing differentially expressed genes between male and female EC3. Genes are considered significantly DE when FDR <0.05 and L2FC >± 0.25. (K) EnrichR pathway enrichment analysis from upregulated differentially expressed gen in male and female EC3. (L) Dot plots showing STAT3 gene expression and MAP3K1 gene expression in the 4 EC subtypes divided by sex. Abbreviations as in Figures 1 and 2.
Figure 4
Figure 4
Upregulation of Senescence-Associated Pathways in Male ECs and Implication of CDKN1A (A) Heatmap showing GSVA analysis of selected senescence-related gene sets between male and female ECs. (B) Feature plot showing the distribution of CDKN1A, LMNA, and SERPINE1 in the overall EC population. (C) Telomere restriction fragment length (in kilobase pair [kbp]) quantified in primary cultures of ECs isolated from internal thoracic arteries (ITAs) of male (n = 57) and female (n = 21) patients. Student’s t-test was used to compare groups (M = 9.16 kbp ± 0.13 kbp vs F = 10.4 kbp ± 0.33 kbp; P < 0.001). (D) Percent of CDKN1A+ ECs (nuclei) present in ITA segments with either high or low endothelial dysfunction (ED) measured by high and low EC50 value, respectively. Threshold of endothelial dysfunction was selected using the mean EC50 of the 11 patients, that is, EC50 = 137 nM. Student’s t-test was used to compare groups (high ED = 42.6% ± 5.6% vs low ED = 22.2% ± 8.3%; P = 0.073). ∗∗∗P < 0.001. ns = not significant; other abbreviations as in Figures 1 and 2.

References

    1. Roth G.A., Mensah G.A., Johnson C.O., et al. Global burden of cardiovascular diseases and risk factors, 1990-2019: update from the GBD 2019 study. J Am Coll Cardiol. 2020;76:2982–3021. - PMC - PubMed
    1. Jebari-Benslaiman S., Galicia-García U., Larrea-Sebal A., et al. Pathophysiology of atherosclerosis. Int J Mol Sci. 2022;23(6):3346. - PMC - PubMed
    1. Man J.J., Beckman J.A., Jaffe I.Z. Sex as a biological variable in atherosclerosis. Circ Res. 2020;126:1297–1319. - PMC - PubMed
    1. Sakkers T.R., Mokry M., Civelek M., et al. Sex differences in the genetic and molecular mechanisms of coronary artery disease. Atherosclerosis. 2023;384 - PubMed
    1. Hartman R.J.G., Owsiany K., Ma L., et al. Sex-stratified gene regulatory networks reveal female key driver genes of atherosclerosis involved in smooth muscle cell phenotype switching. Circulation. 2021;143:713–726. - PMC - PubMed