. 2024 Nov 13:13:e90376.
doi: 10.7554/eLife.90376.

Rescuable sleep and synaptogenesis phenotypes in a Drosophila model of O-GlcNAc transferase intellectual disability

Affiliations

Rescuable sleep and synaptogenesis phenotypes in a Drosophila model of O-GlcNAc transferase intellectual disability

Ignacy Czajewski et al. Elife. .

Abstract

O-GlcNAcylation is an essential intracellular protein modification mediated by O-GlcNAc transferase (OGT) and O-GlcNAcase (OGA). Recently, missense mutations in OGT have been linked to intellectual disability, indicating that this modification is important for the development and functioning of the nervous system. However, the processes that are most sensitive to perturbations in O-GlcNAcylation remain to be identified. Here, we uncover quantifiable phenotypes in the fruit fly Drosophila melanogaster carrying a patient-derived OGT mutation in the catalytic domain. Hypo-O-GlcNAcylation leads to defects in synaptogenesis and reduced sleep stability. Both these phenotypes can be partially rescued by genetically or chemically targeting OGA, suggesting that a balance of OGT/OGA activity is required for normal neuronal development and function.

Keywords: D. melanogaster; O-GlcNAcylation; development; developmental biology; disease models; genetics; genomics; intellectual disability; post-translational modifications.


Conflict of interest statement

IC, BS, JX, LM, AF, Dv No competing interests declared

Figures
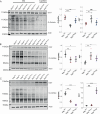
Figure 1.
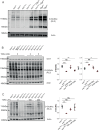
Figure 1.. Variants affecting the calytic domain of OGT reduce O-GlcNAcylation throughout development.
(A) Representative western blot of sxcWT (n = 8), sxcC941Y (n = 8), and sxcN595K (n = 6) adult head lysates and quantification (mean ± standard deviation) of OGT and O-GlcNAcylation immunoreactivity normalised to the both the loading and genotype control. Clostridium perfringens OGA (CpOGA)-treated lanes demonstrate the specificity of the O-GlcNAc antibody (RL2) used compared to lysates treated with the OGA inhibitor GlcNAc statin G (GG). A significant intergroup difference in O-GlcNAcylation was observed (F(2,19) = 42.82, p<0.001), with post hoc analysis revealing a significant reduction in O-GlcNAcylation in both sxcN595K (padj<0.05) and sxcC941Y (padj<0.001) flies relative to the control genotype, and a significant difference between the mutant strains (padj<0.001). A significant intergroup difference was also observed for OGT levels (F(2,19) = 9.137, p<0.01); however, post hoc analysis revealed this was only due to a significant increase in OGT in sxcC941Y flies (padj<0.01). (B) Representative western blot of sxcWT (n = 6), sxcC941Y (n = 6), and sxcK872M (n = 6) lysates from stage 16–17 embryos along with OGT and O-GlcNAc quantification. A significant decrease in O-GlcNAcylation (F(2,14) = 8.014, p<0.01) was observed for both sxcC941Y (padj<0.01) and sxcK872M (padj<0.05) embryos, accompanied by a significant increase in OGT (F(2,14) = 9.49, p<0.01) for both genotype (padj<0.01 and padj<0.05, respectively). (C) Representative western blot and quantification of lysates from sxcWT (n = 6), sxcC941Y (n = 5), and sxcK872M (n = 6) third-instar larvae, demonstrating a significant decrease in O-GlcNAcylation for both sxcC941Y and sxcK872M larvae (F(2,14) = 184.5, p<0.001, padj<0.001 and padj<0.001, respectively) and a decrease in OGT in sxcK872M larvae (F(2,14) = 122.6, p<0.001, padj<0.001). *p<0.05, **p<0.01, ***p<0.001.
Figure 1—figure supplement 1.
Figure 1—figure supplement 1.. Penetrance of supernumerary scutellar bristles in sxcC941Y flies.
(A) Quantification of the number of bristles on the scutellum of sxcWT (n = 566) and sxcC941Y (n = 344) flies, represented as a percentage of total flies included in quantification. (B) As for (A), comparing the number of bristles for sxcWT (n = 136), sxcC941Y (n = 123), sxcC941Y;OgaKO (n = 83), and OgaKO flies (n = 92).
Figure 2.
Figure 2.. Genetic and phamacological rescue of O-GlcNAcylation in sxcC941Y flies.
(A) Representative western blot (of three) of sxcWT, sxcC941Y, sxcC941Y;OgaKO and OgaKO adult head lysates, immunolabelled with RL2 to detect O-GlcNAcylation and actin as a loading control. (B) Western blot and quantification of adult head lysates of sxcWT, sxcC941Y vehicle, sxcC941Y fed 3 mM Thiamet G (TMG) and sxcC941Y fed 5 mM TMG (n = 3), immunolabelled for O-GlcNAcylation using the RL2 antibody, OGT, and actin as a loading control. A significant intergroup difference was observed for both O-GlcNAcylation (F(3,8) = 20.86, p<0.001) and OGT (F(3,8) = 27.28, p<0.001) levels, with post hoc analysis revealing that O-GlcNAcylation and OGT levels were not significantly different between sxcWT flies and sxcC941Y flies fed 3 mM TMG (padj=0.75 and padj=0.57, respectively). Both sxcC941Y flies fed a vehicle control and 5 mM TMG present with significantly different O-GlcNAcylation (padj<0.001 and padj<0.01, respectively) and OGT (padj<0.01 and padj<0.05, respectively) levels. (C) Western blot and quantification of third-instar larval lysates of sxcWT, sxcC941Y vehicle, sxcC941Y fed 150 μM TMG and sxcC941Y fed 200 μM TMG (n = 3), immunolabelled for O-GlcNAcylation using the RL2 antibody and actin as a loading control. O-GlcNAcylation significantly differed between groups (F(3,8) = 9.11, p<0.01), with both 150 μM and 200 μM TMG rescuing O-GlcNAcylation levels in sxcC941Y larvae to be no longer significantly different relative to the control genotype (padj=0.31 and padj=0.98, respectively) and 200 μM TMG treatment significantly elevating O-GlcNAcylation relative to the untreated sxcC941Y larvae (padj<0.05). *p<0.05, **p<0.01, ***p<0.001.
Figure 2—figure supplement 1.
Figure 2—figure supplement 1.. Non-isometric increase in O-GlcNAcylation in Thiamet G fed flies.
(A) Log2 fraction of linear profile of O-GlcNAc immunoreactivity from the western blot in Figure 2B of sxcC941Y vehicle (CY untreated), 3 mM Thiamet G (TMG) (CY 3 mM TMG), and 5 mM TMG (CY 5 mM TMG) relative to the sxcWT control (normalised to a loading control). Generated using a custom Python script to calibrate molecular weights to a curve fitted to the protein ladder. (B) Coomassie stain of lysates used for the Western blot in Figure 2B, and linear profile as in (A, C).
Figure 3.
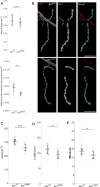
Figure 3.. Variants affecting the catalytic domain of OGT impair neuromuscular junction development.
(A) Representative images of larval neuromuscular junctions (NMJs) immunolabelled with anti-HRP (red), anti-Discs Large 1 (cyan) and both (scale bars 25 μm) for sxcWT (n = 13), sxcC941Y (n = 19), sxcC941Y;OgaKO (n = 14), sxcK872M (n = 8), sxcK872M;OgaKO (n = 7), and OgaKO (n = 13) larvae. In the sxcC941Y;OgaKO panel, the closed arrow indicates 1b boutons, analysed here, while the open arrow indicates an example of 1 s boutons, not analysed here. (B) Quantification of NMJ area (mean ± SD), which was found to be significantly different between genotypes (F(5,68) = 23.05, p<0.001). Relative to the sxcWT control, both sxcC941Y and sxcK872M larvae presented with a smaller NMJ area (padj<0.01 and padj<0.001, respectively), which was partially rescued in the sxcC941Y;OgaKO strain (padj=0.14), though the OgaKO larvae did not present with a significantly increased NMJ area (padj=0.97). (C) Quantification of NMJ length (mean ± SD), which was found to be significantly different between genotypes (F(5,68) = 17.75, p<0.001). Relative to the control genotype, both sxcC941Y and sxcK872M larvae presented with overall shorter NMJ length (padj<0.001 for both), while NMJ length was not significantly different in sxcC941Y;OgaKO larvae (padj=0.13), despite OgaKO NMJ length not being affected (padj=0.99). (D) Bouton number (mean ± SD) is significantly reduced in sxcC941Y and sxcK872M larvae (F(5,68) = 18.11, p<0.001, padj<0.001 for both), and remains significantly reduced in sxcC941Y;OgaKO larvae (padj<0.05). Values for individual NMJs are represented as small grey points, with averages for each larva represented as larger coloured points. Descriptive and inferential statistics were performed on larval averages, *p<0.05, **p<0.01, ***p<0.001.
Figure 3—figure supplement 1.
Figure 3—figure supplement 1.. Reduced neuromuscular junction growth is not due to reduced muscle size nor allele dependent.
(A) Muscle area from sxcWT (n = 9, mean ± standard deviation 0.036 ± 0.005 mm2) and sxcK872M (n = 7, 0.033 ± 0.004 mm2, F(1,14) = 1.297, p=0.27) larvae is not significantly different. When normalised to muscle area, neuromuscular junction (NMJ) area in sxcK872M larvae (0.0052 + 0.0004 µm2/µm2) is significantly reduced compared to sxcWT larvae (0.0071 ± 0.0012 µm2/µm2, F(1,14) = 16.82, p<0.01). (B) Representative images of larval NMJs immunolabelled with anti-HRP (red), anti-Discs Large 1 (cyan), and both (scale bars 25 μm) for sxcWT and sxcH596F larvae. (B–D) Quantification of NMJ parameters quantified using a semi-automated ImageJ plugin for sxcWT (n = 9) and sxcH596F (n = 9) larvae, area (sxcWT: 304 ± 18 µm2, sxcH596F: 260 ± 23 µm2, F(1,16) = 20.54, p<0.001) (B), length (sxcWT: 111 ± 12.8 µm, sxcH596F: 94.2 ± 12.3 µm, F(1,16) = 7.694, p<0.05) (C), and bouton number (sxcWT: 18.5 ± 1.7, sxcH596F: 16.3 ± 1.9, F(1,16) = 6.864, p<0.05) (D) are all significantly different between the two genotypes. Values for individual NMJs are represented by small grey points, with averages for each larva represented as larger coloured points. Descriptive and inferential statistics were performed on larval averages. *p<0.05, **p<0.01, ***p<0.001.
Figure 3—figure supplement 2.
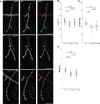
Figure 3—figure supplement 2.. Neuronal overexpression of sxc partially rescues neuromuscular junction defects caused by loss of OGT catalytic activity.
(A) Representative images of neuromuscular junction (NMJ) Discs large 1 immunostaining of sxcK872M; elavL3>Gal4 (elav>Gal4, n = 5), sxcK872M; elavL3>Gal4/UAS:sxc (elav>sxc, n = 7), sxcK872M; mhc>Gal4 (mhc>Gal4, n = 5), sxcK872M; mhc>Gal4/UAS:sxc (mhc>sxc, n = 5), and sxcK872M; UAS:sxc-HA (uas:sxc, n = 6) larvae (scale bars 25 μm). (B) NMJ area (mean ± SD) is significantly increased in elav>sxc (246 ± 20 µm2) larvae compared to the Gal4 control (elav>Gal4: 180 ± 37 µm2) (F(4,23) = 5.484, p<0.01, padj<0.05) and relative to uas:sxc larvae (170 ± 32 µm2, padj<0.01). Conversely, sxc overexpression in muscle cells (mhc>sxc: 198 ± 30 µm2) had no effect relative to the Gal4 control (mhc>Gal4: 201 ± 39 µm2) (padj = 0.99). (C) NMJ length was not significantly affected by genotype (F(4,23) = 2.073, p=0.12) (elav>Gal4: 70 ± 13 µm, elav>sxc: 70 ± 11 µm, mhc>Gal4: 58 ± 12 µm, mhc>sxc: 57 ± 13 µm, uas:sxc: 58 ± 10 µm). (D) NMJ bouton number was not significantly affected by genotype (F(4,23) = 2.028, p=0.12) (elav>Gal4: 11.8 ± 1.6, elav>sxc: 11.7 ± 2.6, mhc>Gal4: 9.4 ± 1.7, mhc>sxc: 9.4 ± 2.1, uas:sxc: 10.7 ± 1.2). Values for individual NMJs represented as small grey points, with averages for each larva represented as larger coloured points. Descriptive and inferential statistics were performed on larval averages, *p<0.05, **p<0.01.
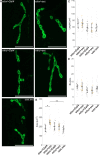
Figure 4.
Figure 4.. Thiamet G partially rescues neuromuscular junction defects in sxcC941Y larvae.
(A) Representative images of neuromuscular junctions (NMJs) immunolabelled with anti-HRP (red), anti-Discs Large 1 (cyan), and both (scale bars 25 μm) for sxcWT (n = 11), sxcC941Y (n = 14), and sxcC941Y fed 200 μM TMG (n = 13). (B) NMJ area (mean ± SD) is significantly reduced in sxcC941Y larvae fed a vehicle control (F(2,35) = 5.264, p=0.01, padj<0.01), relative sxcWT larvae. sxcC941Y larvae fed 200 μM TMG no longer present with a significant reduction in total NMJ area (padj=0.54). (C) Total NMJ length (median ± IQR) is significantly different between groups (Χ2(2) = 17.483, p<0.001); however, unlike total area, post hoc analysis demonstrates that this parameter remains significantly reduced compared to the sxcWT control for both vehicle and TMG treated sxcC941Y larvae (padj<0.001 and padj<0.01, respectively). (D) Quantification of bouton number (mean ± SD) demonstrated a significant intergroup difference (F(2,35) = 13.6, p<0.001), with both vehicle and TMG fed sxcC941Y larvae presenting with significantly reduced bouton number (padj<0.001 and padj<0.01, respectively). Values for individual NMJs represented as small grey points, with averages for each larva represented as larger coloured points. Descriptive and inferential statistics were performed on larval averages, *p<0.05, **p<0.01, ***p<0.001.
Figure 5.
Figure 5.. Fragmented sleep in a Drosophila model of OGT-CDG.
(A) Activity profile (mean ± SEM of activity counts in 30 min bins) for sxcWT (n = 89), sxcC941Y (n = 94), sxcC941Y;OgaKO (n = 74), and OgaKO (n = 95) flies. (B) Sleep profile (mean ± SEM of sleep in 30 min bins) for genotypes as in (A). (C–G) Sleep parameters for genotypes in (A) and (B). (C) Total daily activity (median ± IQR) is significantly reduced in the sxcC941Y;OgaKO mutant strain relative to the control (Χ2(3) = 41.546, p<0.001, padj<0.001). (D) Total daily sleep (mean ± SD) is significantly reduced in sxcC941Y flies relative to the control genotype (F(3,348) = 18.34, p<0.001, padj<0.001), while both sxcC941Y;OgaKO and OgaKO flies do not have significantly altered total sleep (padj=0.58 and padj=0.99, respectively). (E) Mean sleep episode duration (median ± IQR) is significantly reduced in both sxcC941Y and sxcC941Y;OgaKO flies relative to the control genotype during the day (Χ2(3) = 83.8, p<0.001, padj<0.001 and padj<0.01, respectively) and night (Χ2(3) = 52.0, p<0.001, padj<0.001 and padj<0.01, respectively). Mean sleep episode duration is significantly increased in sxcC941Y;OgaKO flies compared to sxcC941Y flies both during the day and night (padj<0.05 and padj<0.001, respectively). (F) Daily number of sleep bouts (mean ± SD) is significantly elevated in both sxcC941Y and sxcC941Y; OgaKO flies compared to the sxcWT control (F(3,696) = 20.31 p<0.001, padj<0.001 for both) while time of day had no significant effect on the number of sleep bouts (F(1,696) = 0.099, p=0.75). Post hoc analysis revealed that relative to the sxcWT control, the number of sleep bouts was significantly increased for sxcC941Y and sxcC941Y;OgaKO flies both during the day (padj<0.01 and padj<0.001) and night (padj<0.001 and padj<0.001). (G) Daily number of sleep bouts longer than 2 hr (median ± IQR) is significantly lower in sxcC941Y flies than the control genotype (Χ2(3) = 49.623, p<0.001, padj<0.001). Individual points represent mean values of measurements conducted over 3 days, for unique flies. *p<0.05, **p<0.01, ***p<0.001.
Figure 6.
Figure 6.. Thiamet G partially rescues sleep in adult sxcC941Y flies.
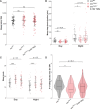
Sleep parameters for sxcWT (n = 63), sxcC941Y (n = 57), and sxcC941Y flies fed 3 mM Thiamet G (TMG) (n = 60).(A) Total sleep (mean ± SD) is not significantly different between groups (F(2,177) = 0.249, p=0.78). (B) Mean sleep bout duration (median ± IQR) significantly differs between groups during the day (Χ2(2) = 12.854, p<0.01) and night (Χ2(2) = 6.5027, p<0.05), though it is only significantly reduced for sxcC941Y flies fed the vehicle control (padj=0.001 and padj<0.05) and not TMG (padj=0.07, padj=0.48). (C) Daily number of sleep bouts is significantly different across groups (F(2,354) = 16.775, p<0.001) and times of day (F(2,354) = 37.446, p<0.001). Post hoc analysis reveals that compared to the sxcWT genotype, sxcC941Y flies fed a vehicle control present with significantly more sleep bouts both during the day and at night (padj<0.001 for both) while the same genotype fed TMG supplemented food did not present with a significantly different number of sleep bouts (padj=0.33 and padj=0.52). (D) The number of sleep bouts longer than 2 hr is significantly reduced in sxcC941Y flies fed a vehicle control, but not TMG (Χ2(2) = 8.2491, p<0.05, padj<0.05 and padj=0.3, respectively). Individual points represent mean values of measurements conducted over 3 days, for unique flies. *p<0.05, **p<0.01, ***p<0.001.
Figure 6—figure supplement 1.
Figure 6—figure supplement 1.. Thiamet G supplementation does not alter total feeding in adult flies.
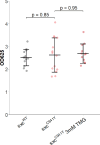
Optical density at 625 nm (OD625) of lysates from adult sxcC941Y flies fed blue dye no.1 in food along with either 3 mM Thiamet G (TMG) or a vehicle control, and the control genotype. No significant effect was detected in this experiment (F(2,36) = 0.34, p=0.714). There was neither an effect of genotype on dye ingestion (padj=0.85) nor was there an effect of adding 3 mM TMG to food of sxcC941Y flies (padj=0.95).
Figure 7.
Figure 7.. Glial knockdown of sxc partially phenocopies sxcC941Y sleep defects.
Quantification of sleep parameters in flies expressing sxc RNAi under the control of either the neuronal elav promoter (n = 42) or the glial repo promoter (n = 54). (A) Total sleep is significantly (χ2(4) = 105.98, p<0.001) reduced by sxc knockdown in glial cell, compared to both to the repo >GAL4 (n = 30, padj<0.01) and UAS (n = 45, padj<0.001) control lines. (B) Mean sleep episode duration is only significantly reduced in repo>sxc RNAi flies during the night, compared to both the UAS and GAL4 control lines (χ2(4) = 67.073, p<0.001, padj<0.001 and padj<0.05, respectively). (C) Daily number of sleep episodes is not significantly affected by genotype (F(4, 127) = 1.368, p=0.24); however, there is a significant effect of time of day on sleep (F(4, 127) = 5.656, p<0.05). There is also a significant interaction between genotype and time of day with regards to number of sleep bouts (F(4, 127) = 10.747, p<0.001), which can be explained by a significant decrease in number of sleep bouts during the day in neuronal sxc knockdown flies compared to both the elav>GAL4 (n = 29, padj<0.01) and UAS (padj<0.01) control lines. Conversely, neuronal sxc knockdown flies present with significantly more sleep bouts during the night, compared to these control lines (padj<0.05 and padj<0.01, respectively). (D) The daily number of sleep episodes longer than 2 hr is also reduced with glial sxc knockdown (χ2(4) = 81.215, p<0.001), but only compared to the UAS control line (padj<0.001) and not the GAL4 control line (padj=0.3). *p<0.05, **p<0.01, ***p<0.001.

Update of

  • doi: 10.1101/2023.06.28.546900

References

    1. Ashton-Beaucage D, Udell CM, Lavoie H, Baril C, Lefrançois M, Chagnon P, Gendron P, Caron-Lizotte O, Bonneil E, Thibault P, Therrien M. The exon junction complex controls the splicing of MAPK and other long intron-containing transcripts in Drosophila. Cell. 2010;143:251–262. doi: 10.1016/j.cell.2010.09.014. - DOI - PubMed
    1. Bartolomé-Nebreda JM, Trabanco AA, Velter AI, Buijnsters P. O-GlcNAcase inhibitors as potential therapeutics for the treatment of Alzheimer’s disease and related tauopathies: analysis of the patent literature. Expert Opinion on Therapeutic Patents. 2021;31:1117–1154. doi: 10.1080/13543776.2021.1947242. - DOI - PubMed
    1. Berry JA, Cervantes-Sandoval I, Chakraborty M, Davis RL. Sleep facilitates memory by blocking dopamine neuron-mediated forgetting. Cell. 2015;161:1656–1667. doi: 10.1016/j.cell.2015.05.027. - DOI - PMC - PubMed
    1. Brent JR, Werner KM, McCabe BD. Drosophila larval NMJ dissection. Journal of Visualized Experiments: JoVE. 2009;24:1107. doi: 10.3791/1107. - DOI - PMC - PubMed
    1. Capotosti F, Hsieh JJD, Herr W. Species selectivity of mixed-lineage leukemia/trithorax and HCF proteolytic maturation pathways. Molecular and Cellular Biology. 2007;27:7063–7072. doi: 10.1128/MCB.00769-07. - DOI - PMC - PubMed

Substances

LinkOut - more resources