. 2024 Dec 11;15(12):e0293024.
doi: 10.1128/mbio.02930-24. Epub 2024 Nov 13.

Type I interferon signaling in dendritic cells limits direct antigen presentation and CD8+ T cell responses against an arthritogenic alphavirus

Affiliations

Type I interferon signaling in dendritic cells limits direct antigen presentation and CD8+ T cell responses against an arthritogenic alphavirus

Christopher B Bullock et al. mBio. .

Abstract

Ross River virus (RRV) and other alphaviruses cause chronic musculoskeletal syndromes that are associated with viral persistence, which suggests deficits in immune clearance mechanisms, including CD8+ T-cell responses. Here, we used a recombinant RRV-gp33 that expresses the immunodominant CD8+ T-cell epitope of lymphocytic choriomeningitis virus (LCMV) to directly compare responses with a virus, LCMV, that strongly induces antiviral CD8+ T cells. After footpad injection, we detected fewer gp33-specific CD8+ T cells in the draining lymph node (DLN) after RRV-gp33 than LCMV infection, despite similar viral RNA levels in the foot. However, less RRV RNA was detected in the DLN compared to LCMV, with RRV localizing principally to the subcapsular region and LCMV to the paracortical T-cell zones. Single-cell RNA-sequencing analysis of adoptively transferred gp33-specific transgenic CD8+ T cells showed rapid differentiation into effector cells after LCMV but not RRV infection. This defect in RRV-specific CD8+ T effector cell maturation was corrected by local blockade of type I interferon (IFN) signaling, which also resulted in increased RRV infection in the DLN. Studies in Wdfy4-/-, CD11c-Cre B2mfl/fl, or Xcr1-Cre Ifnar1fl/fl mice that respectively lack cross-presenting capacity, MHC-I antigen presentation by dendritic cells (DCs), or type I IFN signaling in the DC1 subset show that RRV-specific CD8+ T-cell responses can be improved by enhanced direct antigen presentation by DCs. Overall, our experiments suggest that antiviral type I IFN signaling in DCs limits direct alphavirus infection and antigen presentation, which likely delays CD8+ T-cell responses.IMPORTANCEChronic arthritis and musculoskeletal disease are common outcomes of infections caused by arthritogenic alphaviruses, including Ross River virus (RRV), due to incomplete virus clearance. Unlike other viral infections that are efficiently cleared by cytotoxic CD8+ T cells, RRV infection is surprisingly unaffected by CD8+ T cells as mice lacking or having these cells show similar viral persistence in joint and lymphoid tissues. To elucidate the basis for this deficient response, we measured the RRV-specific CD8+ T-cell population size and activation state relative to another virus known to elicit a strong T-cell response. Our findings reveal that RRV induces fewer CD8+ T cells due to limited infection of immune cells in the draining lymph node. By increasing RRV susceptibility in antigen-presenting cells, we elicited a robust CD8+ T-cell response. These results highlight antigen availability and virus tropism as possible targets for intervention against RRV immune evasion and persistence.

Keywords: T cells; T-cell immunity; alphavirus; interferons; viral pathogenesis.


Conflict of interest statement

M.S.D. is a consultant or advisor for Inbios, Vir Biotechnology, IntegerBio, Moderna, Merck, Bavarian Nordic, GlaxoSmithKline, and Akagera Medicines. The Diamond laboratory has received unrelated funding support in sponsored research agreements from Vir Biotechnology, Moderna, IntegerBio, Bavarian Nordic, and Emergent BioSolutions.

Figures

Fig 1
Fig 1
RRV and LCMV infection in wild-type and CD8α−/− mice. Three- to 4-week-old male WT C57BL/6 J or CD8α−/− mice were inoculated in the left footpad with 103 FFU of (A) RRV or (B) LCMV (n = 6–10 mice per group, three experiments). At the indicated day post-infection, tissues were harvested and homogenized. RRV and LCMV viral RNA in the ipsilateral foot (left panels) and spleen (right panels) were titered by qRT-PCR. Statistical analysis: Mann–Whitney test comparing genotypes at each timepoint; ns = not significant; ***P < 0.001; ****P < 0.0001. Bars indicate mean values; dotted lines indicate the limit of detection (LOD).
Fig 2
Fig 2
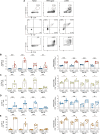
Antigen-specific CD8+ T-cell responses in the DLN after RRV and LCMV infection. Three- to 4-week-old male WT C57BL/6 J mice were inoculated in the left footpad with 103 FFU of RRV-gp33 or LCMV (n = 9 mice per group, three experiments). At the indicated day post-infection, leukocytes were isolated from the DLN (popliteal), and CD8+ T cells were analyzed by flow cytometry. (A) Representative flow cytometry contour plots of the gp33 tetramer, IFNγ, TNF, and GrB staining at 5 dpi. (B–E) Frequency (left panels) and total numbers (right panels) of CD8+ T cells in the DLN. (B) Gp33-tetramer positive CD8+ T cells. (C and D) Cells were restimulated ex vivo with gp33 peptide for 4 hours before intracellular staining and flow cytometry for IFNγ+ (C) or TNF+ (D) CD8+ T cells. (E) Granzyme B+ CD8+ T cells. Statistical analysis: Mann–Whitney test comparing between viruses at each time point; ns = not significant, *P < 0.05, **P < 0.01, ***P < 0.001, and ****P < 0.0001. Column heights indicate mean values; dotted lines indicate the LOD.
Fig 3
Fig 3
Transcriptomic analysis of transferred gp33-specific CD8+ T cells after RRV and LCMV infection. Three- to 4-week-old male WT C57BL/6 J mice were adoptively transferred to 106 gp33-specific P14-transgenic CD8+ T cells and then inoculated in the left footpad with 103 of RRV-gp33 or LCMV (n = 7 mice per group, one experiment). Five days later, leukocytes were isolated from DLNs and pooled for each respective group. Gp33-specific CD8+ T cells were enriched via sorting, and single-cell RNA sequencing was done using the 10X Genomics platform. (A) Experimental design. (B) Clustering of isolated gp33-specific CD8+ T cells and counts per cluster. (C) Change in the expression of CD8+ T-cell activation genes, per cluster/sample, relative to the mean expression in cluster 0 of the naive sample. (D) Expression of selected CD8+ T-cell activation genes.
Fig 4
Fig 4
RRV and LCMV RNA infection and localization in the DLN. Three- to 4-week-old male WT C57BL/6 J mice were inoculated in the left footpad with 103 FFU of RRV or LCMV. At the indicated day post-infection, DLNs were harvested. (A) RRV and LCMV RNA levels (n = 10 mice per group, three experiments). (B) Representative images of RRV and LCMV viral RNA localization at 0, 1, 3, 5, or 7 dpi as stained by in situ hybridization (scale bars: 500 µm) and high-magnification insets (scale bars: 100 µm) (n = 3 mice per group, three experiments). Blue arrow, RRV RNA; red arrow, LCMV RNA. (C) Representative images of RRV and LCMV viral RNA localization in the ipsilateral foot at 5 dpi, as stained by in situ hybridization (scale bars: 2.5 mm), medium-magnification insets (scale bars: 500 µm), and high-magnification insets (scale bars: 250 µm) (n = 3 mice per group, two experiments). Blue arrow, RRV RNA; red arrow, LCMV RNA. Statistical analysis: Mann–Whitney test comparing between viruses at each time point; *P < 0.05, **P < 0.01, and ***P < 0.0001. Bars indicate mean values; dotted lines indicate the LOD.
Fig 5
Fig 5
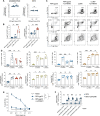
Local treatment with anti-IFNAR1 blocking antibody augments RRV-specific CD8+ T-cell responses in the DLN. Three- to 4-week-old male WT C57BL/6 J mice were inoculated in the left footpad and sacrificed at 5 dpi. (A and B) Inoculation with 103 FFU of RRV-gp33, 106 FFU of RRV-gp33, or 103 FFU LCMV (n = 6–8 mice per group, three experiments). (A) RRV RNA in the ipsilateral foot (left panel) and DLN (right panel) was titered by qRT-PCR. (B) Gp33-tetramer-positive CD8+ T cells in the DLN: frequency (left panels) and total numbers (right panels). (C and D) Inoculation with 103 FFU of RRV-gp33 or LCMV, with or without anti-IFNAR1 blocking mAb (α-IFNAR1, 100 µg; 6 mg/kg) treatment administered in the footpad (n = 6–10 mice per group, three experiments). (C) Representative flow cytometry contour plots of the gp33 tetramer, IFNγ, TNF, and GrB staining in the DLN. (D) Summary data in of gp33-tetramer+, IFNγ+, and TNF+ staining after ex vivo peptide restimulation and GrB+ CD8+ T cells in the DLN: frequency (top panels) and total numbers (bottom panels). (E) Inoculation with 103 FFU of RRV-gp33, with or without anti-IFNAR1 mAb treatment (n = 7 mice per group, three experiments). CD8+ T cells isolated from the DLN at 5 dpi were incubated with labeled naive splenocytes pulsed with 5 µg/mL of gp33 or OVA peptide. After 4 hours, cells were stained with 7-AAD to determine the percent killing of gp33-peptide-pulsed cells by gp33-specific CD8+ T cells. (F) Inoculation with 103 FFU of RRV, with or without anti-IFNAR1 mAb treatment (n = 6–11 mice per group, three experiments). Total numbers of IFNγ+ CD8+ T cells in the DLN after ex vivo peptide restimulation. Statistical analysis: (A) Mann–Whitney test; (B) one-way ANOVA with Holm–Sidak’s post-test, comparisons between 103 FFU RRV-gp33 and 106 FFU RRV-gp33 and between 106 FFU RRV-gp33 and 103 LCMV; (D) one-way ANOVA with Holm–Sidak’s post-test, comparisons between RRV-gp33 and RRV-gp33 + anti-IFNAR1, RRV-gp33 + anti-IFNAR1 and LCMV, and LCMV and LCMV + anti-IFNAR1; (E) two-way ANOVA with Holm–Sidak’s post-test, comparisons between naive and RRV-gp33, naive and RRV-gp33 + anti-IFNAR1, and RRV-gp33 and RRV-gp33 + anti-IFNAR1; (F) Mann–Whitney test with Holm–Sidak’s post-test comparing with and without anti-IFNAR1 treatment for each peptide; ns = not significant, *P < 0.05, **P < 0.01, ***P < 0.001, and ****P < 0.0001. Bars and column heights indicate mean values; dotted lines indicate the LOD.
Fig 6
Fig 6
RRV infection in the DLN after local treatment of the anti-IFNAR1 blocking antibody. Three- to 4-week-old male WT C57BL/6 J mice were inoculated in the left footpad with 103 FFU of RRV or LCMV, with or without anti-IFNAR1 mAb treatment (α-IFNAR1). DLNs were harvested at 1, 3, or 5 dpi. (A) RRV or (B) LCMV RNA in the DLN titered by qRT-PCR (n = 8–10 mice per group, three experiments). (C) Representative images of RRV RNA localization after anti-IFNAR1 mAb treatment in the DLN at 1, 3, or 5 dpi, as stained by in situ hybridization (scale bars: 500 µm) and high-magnification insets (scale bars: 100 µm) (n = 3 mice per group, three experiments). Blue arrow, RRV RNA. (D–F) Three- to 4-week-old male WT C57BL/6 J mice were inoculated in the left footpad with 4 × 10⁵ FFU of RRV-Venus, with or without anti-IFNAR1 mAb treatment. DLNs were harvested at 36 hours post infection (n = 8–10 mice per group, three experiments). (D) RRV infection in DLN cells identified by Venus fluorescence using flow cytometry. (E) Representative flow cytometry contour plots of DC1 and DC2 Venus fluorescence (RRV infection) and expression of DC activation markers, CD40, CD80, and CD86. Statistical analysis: (A and B) Mann–Whitney test comparing between treatment groups at each time point; (D) Mann–Whitney test with Holm–Sidak’s post-test comparing between treatment groups; ns = not significant, **P < 0.01, ***P < 0.001, and ****P < 0.0001. Bars and column heights indicate mean values; dotted lines indicate the LOD.
Fig 7
Fig 7
Increased CD8+ T-cell priming with anti-IFNAR1 mAb treatment depends on CD11c+ DCs. Three-to 4-week-old male and female WT C57BL/6 J or indicated KO mice were inoculated in the left footpad with 103 of RRV-gp33, with or without anti-IFNAR1 mAb (α-IFNAR1) treatment (n = 7–10 mice per group, three experiments). At 5 dpi, leukocytes were isolated from the DLN, and CD8+ T cells were analyzed by flow cytometry for gp33 tetramer binding, intracellular cytokines after ex vivo peptide restimulation, and granzyme B expression. (A) Representative flow cytometry contour plots of CD8+ T-cell activation in Wdfy4−/− mice. (B) Summary data of gp33-tetramer+, IFNγ+, TNF+, and GrB+ CD8+ T cells in Wdfy4−/− mice; frequency (top panels) and total numbers (bottom panels). (C) Representative flow cytometry contour plots of CD8+ T-cell activation in CD11c-Cre B2mfl/fl mice. (D) Summary data of gp33-tetramer+, IFNγ+, TNF+, and GrB+ CD8+ T cells in CD11c-Cre B2mfl/fl mice; frequency (top panels) and total numbers (bottom panels). Statistical analysis: one-way ANOVA with Holm–Sidak’s post-test; comparisons are within genotypes with and without anti-IFNAR1 mAb treatment and across genotypes with anti-IFNAR1 mAb treatment; *P < 0.05, **P < 0.01, ***P < 0.001, and ****P < 0.0001. Bars and column heights represent mean values; dotted lines indicate the LOD.
Fig 8
Fig 8
Loss of IFNAR1 signaling in DC1s results in increased CD8+ T-cell polyfunctionality after RRV infection. Three- to 4-week-old male and female WT, Ifnar1−/−, Xcr1-Cre+ Ifnar1fl/fl, or littermate Cre- Ifnar1fl/fl mice were inoculated in the left footpad. (A–C) At 36 hours post-infection with 4 × 10⁵ FFU of RRV-Venus, leukocytes were isolated from the DLN and analyzed by flow cytometry. (A) Representative histograms of IFNAR1 expression on myeloid cells (CD3- NK1.1- B220- CD11b+), DC1s, and DC2s. (B) Summary data of IFNAR1 median fluorescent intensity (n = 4–7 mice per group, two experiments). (C) RRV infection of CD11b+ myeloid cells, CD11c+ Xcr1+ DC1s, and CD11c+ Sirpα+ DC2s identified by Venus fluorescence using flow cytometry (n = 7–10 mice per group, two experiments). (D and E) At 5 days post-infection with 103 FFU of RRV-gp33, leukocytes were isolated from the DLN, and CD8+ T cells were analyzed by flow cytometry (n = 13–15 mice per group, four experiments). (D) Representative flow cytometry contour plots of CD8+ T-cell activation in Xcr1-Cre Ifnar1fl/fl mice. (E) Summary data of gp33-tetramer+, IFNγ+, TNF+, and GrB+ CD8+ T cells in Xcr1-Cre Ifnar1fl/fl mice. Statistical analysis: (B and C) Mann–Whitney test with Holm–Sidak’s post-test comparing between Cre and Cre+ mice for each cell type; (E) Mann–Whitney test; ns = not significant, *P < 0.05, **P < 0.01, and ***P < 0.001. Bars and column heights represent mean values; dotted lines indicate the LOD.

References

    1. Zeller H, Van Bortel W, Sudre B. 2016. Chikungunya: its history in Africa and Asia and its spread to new regions in 2013-2014. J Infect Dis 214:S436–S440. doi:10.1093/infdis/jiw391 - DOI - PubMed
    1. Russell RC, Kay BH. 2004. Medical entomology: changes in the spectrum of mosquito‐borne disease in Australia and other vector threats and risks, 1972–2004. Aust J Entomol 43:271–282. doi:10.1111/j.1326-6756.2004.00436.x - DOI
    1. Harley D, Sleigh A, Ritchie S. 2001. Ross River virus transmission, infection, and disease: a cross-disciplinary review. Clin Microbiol Rev 14:909–932. doi:10.1128/CMR.14.4.909-932.2001 - DOI - PMC - PubMed
    1. Mylonas AD, Brown AM, Carthew TL, McGrath B, Purdie DM, Pandeya N, Vecchio PC, Collins LG, Gardner ID, de Looze FJ, Reymond EJ, Suhrbier A. 2002. Natural history of Ross River virus-induced epidemic polyarthritis. Med J Aust 177:356–360. doi:10.5694/j.1326-5377.2002.tb04837.x - DOI - PubMed
    1. Fraser JR. 1986. Epidemic polyarthritis and Ross River virus disease. Clin Rheum Dis 12:369–388. - PubMed

MeSH terms