. 2025 Jan;12(2):e2406865.
doi: 10.1002/advs.202406865. Epub 2024 Nov 13.

Integrin β8 Facilitates Macrophage Infiltration and Polarization by Regulating CCL5 to Promote LUAD Progression

Affiliations

Integrin β8 Facilitates Macrophage Infiltration and Polarization by Regulating CCL5 to Promote LUAD Progression

Lei Song et al. Adv Sci (Weinh). 2025 Jan.

Abstract

The tumor microenvironment (TME) influences cancer progression and metastasis. Integrin β8 (ITGβ8), a member of the integrin family, is upregulated in various cancers. In this study, it is determined as a key factor that mediates the interaction between lung adenocarcinoma (LUAD) cells and macrophages. Increased expression levels of ITGβ8 are associated with increased numbers of CD163+ macrophages and poor prognosis in LUAD patients. The overexpression of ITGβ8 in LUAD cells promotes the polarization of THP-1 macrophages toward the M2 phenotype. In contrast, TCM (conditioned medium from the co-culture system) from THP-1 macrophages and ITGβ8-overexpressing A549 cells promoted the proliferation and invasion of A549 cells. Mechanistically, chemokine (C-C motif) ligand 5 (CCL5) plays an important role in mediating ITGβ8-induced macrophage polarization, and the phosphoinositide 3-kinase (PI3K)/AKT serine/threonine kinase (AKT)/interferon regulatory factor 9 (IRF9) pathway is involved in this process. Moreover, interleukin 8 (IL8) and interleukin 10 (IL10) produced by M2-like macrophages regulate the expression of ITGβ8 in LUAD cells through the spi-1 proto-oncogene (SPI1). This study elucidates the feedback mechanism of ITGβ8 between LUAD cells and macrophages.

Keywords: CCL5; ITGβ8; LUAD; TME; macrophage.


Conflict of interest statement

The authors declare no conflict of interest.

Figures
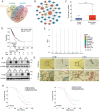
Figure 1
Figure 1
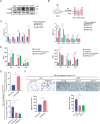
High ITGβ8 expression is correlated with poor prognosis and an increased number of TAMs in LUAD. A) Venn diagram showing significant DEGs in the TCGA and GEO databases. B) Network of DEGs and immune‐ and EMT‐related genes. Blue indicates DEGs, and red and green indicate immune‐ and EMT‐related genes, respectively. C) ITGβ8 expression in human LUAD tissues (n = 515) and normal tissues (n = 59) from the TCGA database. D) Kaplan–Meier curves showing the relationship between ITGβ8 expression and OS in LUAD patients. E) The distribution of ITGβ8 expression in the TME according to data from the GSE189357 dataset. F) ITGβ8 expression levels in LUAD tumor (T) tissues and matched adjacent para‐carcinoma (N) tissues were examined by Western blotting. G) Representative images of IHC staining of ITGβ8 and CD163 in human LUAD tissues. Magnification, 100× and 400×. The CD163 protein accumulated to higher levels in LUAD tissues with high expression of ITGβ8. H) Survival curves displaying the relationships between ITGβ8 or CD163 expression and OS in LUAD patients. (ns, not significant; *p < 0.05; **p < 0.01; ***p < 0.001; ****p < 0.0001).
Figure 2
Figure 2
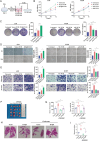
ITGβ8 plays a crucial role in the polarization of macrophage toward the M2 phenotype and recruitment. A) Western blotting analysis of ITGβ8 in HBE cells and four human LUAD cell lines. B) Schematic of an in vitro model in which THP‐1 macrophages were co‐cultured with transfected LUAD cells. C) qRT‐PCR was used to measure the expression of biomarkers of M1‐like and M2‐like macrophages in THP‐1 macrophages co‐cultured with LUAD cells. D) ELISA was used to measure the concentrations of IL4, IL8, and IL10 in the co‐culture system. E) Flow cytometry was used to explore the percentage of CD163+ THP‐1 macrophages co‐cultured with LUAD cells. F) Transwell assays were conducted to assess the effect of LUAD‐CM on the chemotactic ability of THP‐1 macrophages. (ns, not significant; *p < 0.05; **p < 0.01; ***p < 0.001; ****p < 0.0001).
Figure 3
Figure 3
ITGβ8 promotes the malignant phenotype of LUAD through M2‐like macrophages. A) Schematic of an in vitro model of LUAD cells treated with TCM collected from the co‐culture system. B,C) The effects of TCM on LUAD cell viability were analyzed via CCK‐8 (B) and colony formation (C) assays. D,E) The effects of TCM on the migration and invasion ability of LUAD cells were evaluated via wound healing (D), Transwell migration (upper panel), and invasion (lower panel) assays (E). F,G) Clodronate was injected into BALB/c nude mice to deplete mouse macrophages. Stably transfected A549‐Vector or A549‐ITGβ8 cells were subcutaneously injected into the right axillary regions of nude mice (n = 4). The resulting tumors were harvested (F), and the tumor volume (left panel) and tumor weight (right panel) were measured (G). H,I) Tail vein injection of A549‐Vector or A549‐ITGβ8 cells into nude mice treated with or without clodronate (n = 4). H&E‐stained images of lung tissues (H), and the number of metastatic nodules (I) are shown. (ns, not significant; *p < 0.05; **p < 0.01; ***p < 0.001; ****p < 0.0001).
Figure 4
Figure 4
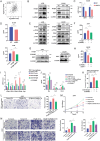
ITGβ8 induces the polarization and chemotactic activity of THP‐1 macrophages via CCL5. A) Volcano plot showing DEGs in the A549‐Vector and A549‐ITGβ8 groups. B) qRT‐PCR and ELISA were used to quantify the regulation of CCL5 mRNA and secretion levels induced by ITGβ8. C) qRT‐PCR analysis of the expression of CCR5 in THP‐1 macrophages co‐cultured with LUAD cells. D) The expression of CCR5 in the TME according to data from the GSE189357 dataset. E) In ITGβ8high tissues, CCR5 is highly expressed (TCGA‐LUAD). F) M1‐like and M2‐like macrophage biomarker levels were measured via qRT‐PCR (upper panel); IL4, IL8, and IL10 secretion levels were quantified via ELISA (lower panel). G) Flow cytometry was used to explore the percentage of CD163+ THP‐1 macrophages co‐cultured with LUAD cells. H) Transwell assays were used to assess the effect of LUAD‐CM on the chemotactic ability of THP‐1 macrophages. I) The effect of TCM on LUAD cell viability was analyzed via a CCK‐8 assay. J) The effects of TCM on the migration and invasion ability of LUAD cells were assessed via Transwell migration (upper panel) and invasion assays (lower panel). (ns, not significant; *p < 0.05; **p < 0.01; ***p < 0.001; ****p < 0.0001).
Figure 5
Figure 5
ITGβ8 regulates CCL5 via PI3K/AKT/IRF9 signaling. A) Correlation analysis of IRF9 and CCL5 was performed via GEPIA2. B) The expression level of IRF9 in LUAD cells was measured by Western blotting. C) The expression of IRF9 and CCL5 mRNA levels was measured via qRT‐PCR in H1299‐siIRF9 cells. D) ELISA was used to assess the level of CCL5 secretion by H1299 and A549 cells. E) Western blotting was used to measure the levels of key signal transduction proteins. F) The effect of LY294002 (50 µM) on the secretion of CCL5 was evaluated via ELISA. G) Western blotting was used to assess the effect of LY294002 on the expression level of IRF9 in LUAD cells. H) The effects of LY294002 and siIRF9 on the level of CCL5 secretion were measured via ELISA. I) M1‐like and M2‐like macrophage biomarker expression was measured via qRT‐PCR. J) IL4, IL8, and IL10 secretion were quantified via ELISA. K) Flow cytometry was used to explore the percentage of CD163+ THP‐1 macrophages co‐cultured with LUAD cells treated with or without LY294002. L) Transwell assays were conducted to assess the effect of LY294002 on the chemotactic ability of THP‐1 macrophages induced by ITGβ8. M) The proliferation ability of A549 cells was analyzed via a CCK‐8 assay. N) The migration and invasion abilities of A549 cells were assessed via Transwell migration (upper panel) and invasion (lower panel) assays. (ns, not significant; *p < 0.05; **p < 0.01; ***p < 0.001; ****p < 0.0001).
Figure 6
Figure 6
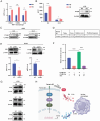
ITGβ8 facilitates LUAD progression in vivo. Stably transfected Vector/ITGβ8 cells (A549 cells expressing luciferase) were subcutaneously injected into the armpit regions of nude mice (n = 5). A) Tumor formation was monitored via bioluminescence imaging. B) Images of resulting tumors on Day 35. C) Tumor volume (left panel) and tumor weight (right panel) in the different groups. D) Western blotting analysis of the expression of the indicated markers in protein extracts obtained from harvested tumors. E) H&E and IHC staining were used to confirm the expression of the indicated markers in the two groups of tumor samples. Magnification, 100×. F) Apex cordis blood was extracted for ELISA to determine the concentration of CCL5. (ns, not significant; *p < 0.05; **p < 0.01; ***p < 0.001; ****p < 0.0001).
Figure 7
Figure 7
Induction of ITGβ8 expression in tumor cells by M2‐like macrophages. A) M2‐like macrophage biomarkers were detected in THP‐1 macrophages treated with IL4 via qRT‐PCR. B,C) The concentration of IL8 and IL10 in M0/M2‐CM were measured via ELISA (left panel), Western blotting was used to measure the expression of ITGβ8 in A549 cells treated with M0/M2‐like macrophage‐CM (B, right panel) or IL8/IL10 (100 ng mL−1) (C). D) Prediction of the binding site of SPI1 and ITGβ8 promoters via JASPAR. E) Western blotting (upper panel) and qRT‐PCR (lower panel) were used to determine the effect of SPI1 knockdown on the expression of ITGβ8. F) Relative luciferase activity in HEK293T cells after cotransfection of plasmids (pcDNA3.1) carrying the ITGβ8 promoter (WT or Mut) with or without an SPI1‐overexpressing construct. G) Western blotting was used to measure the expression of SPI1 in A549 cells treated with M0/M2‐like macrophage‐CM (upper panel) or IL8 (middle panel) and IL10 (lower panel). H) Schematic model of the role of ITGβ8 in LUAD and macrophage crosstalk. Some of the materials are sourced from FigDraw. (ns, not significant; *p < 0.05; **p < 0.01; ***p < 0.001; ****p < 0.0001).

References

    1. Bray F., Laversanne M., Sung H., Ferlay J., Siegel R., Soerjomataram I., Jemal A., CA Cancer J. Clin. 2024, 74, 229. - PubMed
    1. Leiter A., Veluswamy R., Wisnivesky J., Nat. Rev. Clin. Oncol. 2023, 20, 624. - PubMed
    1. Schabath M., Cote M., Cancer Epidemiol. Biomarkers Prev. 2019, 28, 1563. - PMC - PubMed
    1. Allemani C., Matsuda T., Carlo V. D., Lancet 2018, 391, 1023. - PMC - PubMed
    1. Romain R., Christian B., Jorge G., Diane D., Marie C., Dieu N., Catherine S., Wolf H., Charles A., Nasser K., Miriam M., Sacha G., Am J. Respir. Crit. Care Med. 2014, 191, 90.

MeSH terms

LinkOut - more resources