. 2025 Mar;19(3):682-697.
doi: 10.1002/1878-0261.13750. Epub 2024 Nov 13.

Adenoviral delivery of the CIITA transgene induces T-cell-mediated killing in glioblastoma organoids

Affiliations

Adenoviral delivery of the CIITA transgene induces T-cell-mediated killing in glioblastoma organoids

Ilaria Salvato et al. Mol Oncol. 2025 Mar.

Abstract

The immunosuppressive nature of the tumor microenvironment poses a significant challenge to effective immunotherapies against glioblastoma (GB). Boosting the immune response is critical for successful therapy. Here, we adopted a cancer gene therapy approach to induce T-cell-mediated killing of the tumor through increased activation of the immune system. Patient-based three-dimensional (3D) GB models were infected with a replication-deficient adenovirus (AdV) armed with the class II major histocompatibility complex (MHC-II) transactivator (CIITA) gene (Ad-CIITA). Successful induction of surface MHC-II was achieved in infected GB cell lines and primary human GB organoids. Infection with an AdV carrying a mutant form of CIITA with a single amino acid substitution resulted in cytoplasmic accumulation of CIITA without subsequent MHC-II expression. Co-culture of infected tumor cells with either peripheral blood mononuclear cells (PBMCs) or isolated T-cells led to dramatic breakdown of GB organoids. Intriguingly, both wild-type and mutant Ad-CIITA, but not unarmed AdV, triggered immune-mediated tumor cell death in the co-culture system, suggesting an at least partially MHC-II-independent process. We further show that the observed cancer cell killing requires the presence of either CD8+ or CD4+ T-cells and direct contact between GB and immune cells. We did not, however, detect evidence of activation of canonical T-cell-mediated cell death pathways. Although the precise mechanism remains to be determined, these findings highlight the potential of AdV-mediated CIITA delivery to enhance T-cell-mediated immunity against GB.

Keywords: MHC‐II; T‐cells; adenovirus; gene therapy; glioblastoma; tumor organoids.


Conflict of interest statement

The authors declare no conflict of interest.

Figures

Fig. 1
Fig. 1
Expression of MHC‐II‐related transcripts in human glioblastoma and associated models. (A) Bulk RNA‐seq gene expression in GB patient tumors (n = 163) versus control normal brain (n = 207). The box limits indicate the 25th and 75th percentiles, centerlines show the medians; whiskers show a minimum of two measures: extreme values or 1.5 IQR from the closest quartile; points depict individual samples. *P < 0.01 (one‐way ANOVA). (B) Single‐cell RNA‐seq gene expression in GB patient tumors. (C) Heatmap representing bulk RNA‐seq (human specific) gene expression in GB PDOXs. Gray color indicates lack of expression. PDOX replicates are indicated by numbers. (D) Flow cytometric analysis of surface MHC‐II (anti‐HLA‐DR/DP/DQ‐FITC), in control conditions (cells unstained or mock‐stimulated) and upon IFN‐γ stimulation. n = 3. GB, glioblastoma; HLA, human leukocyte antigen; IFN, interferon; IQR, interquartile range; MHC‐II, major histocompatibility complex class II; PDOX, patient‐derived orthotopic xenograft; RNA‐seq, RNA‐sequencing.
Fig. 2
Fig. 2
Characterization of Ad‐CIITA and Ad‐CIITA mutant in human glioblastoma stem‐like cells. (A) AdV vectors used in the study. (B–D) Virus quality check in human P3NS and T16NS infected at multiplicity of infection (MOI) 50. mRNA (B) and protein levels (C) of CIITA and HLA‐DRα were analyzed 72 h post‐infection by qRT–PCR (n = 3) and western blot (n = 1, 3 technical replicates), respectively. qRT–PCR was normalized to Ef1a, while western blot to GAPDH. Mean ± SD. ****P < 0.0001 (one‐way ANOVA). (D) Flow cytometric analysis of surface MHC‐II (anti‐HLA‐DR/DP/DQ‐FITC) at 72 h and 6 days post‐infection. n = 3. AdV, adenovirus; CIITA, major histocompatibility complex class II transactivator; CMV, cytomegalovirus; Ef1a, elongation factor 1‐alpha; GAPDH, glyceraldehyde 3‐phosphate dehydrogenase; GFP, green fluorescent protein; HLA, human leukocyte antigen; MHC‐II, major histocompatibility complex class II; MOI, multiplicity of infection; qRT–PCR, quantitative reverse transcription PCR.
Fig. 3
Fig. 3
Successful infection of human primary glioblastoma organoids by adenoviral vectors. (A) Western Blot analysis of CIITA and HLA‐DRα expression at 72 h post‐infection in P3 organoids (n = 1, 3 technical replicates). (B) Representative H&E (top) and anti‐HLA‐DRα (bottom) staining at 72 h post‐infection at multiplicity of infection (MOI) 50. Scale bar = 100 μm. n = 3. (C) Flow cytometric analysis of surface MHC‐II (anti‐HLA‐DR/DP/DQ‐FITC) at 72 h and 6 days post‐infection (MOI 50). n = 3. (D) Evaluation of virus‐mediated cytotoxicity (P3dsRed) via Incucyte S3. n = 3. Mean ± SEM. CIITA, major histocompatibility complex class II transactivator; GAPDH, glyceraldehyde 3‐phosphate dehydrogenase; H&E, hematoxylin and eosin; HLA, human leukocyte antigen; MHC‐II, major histocompatibility complex class II; MOI, multiplicity of infection.
Fig. 4
Fig. 4
Immune cell‐mediated tumor cell killing in human primary GB organoids induced by Ad‐CIITA and Ad‐CIITA mutant. (A) Schematic of adenovirus AdV‐infected GB organoids co‐cultured with immune cells. (B, C) Tumor cell viability in P3dsRed organoids (MOI 75): (B) alone (no co‐culture) or co‐cultured with PBMCs; (C) co‐cultured with CD3+, CD4+ or CD8+ T‐cells. The arrow marks the co‐culture start. Scale bar = 1 mm. n = 3. Mean ± SEM. *P < 0.05, **P < 0.01, ***P < 0.001, and ****P < 0.0001 (two‐way ANOVA). (D) Flow cytometric analysis showing the proportion of live/dead cells in CD90+ tumor cells at 72 h post‐co‐culture: alone (left), co‐cultured with PBMCs (middle), and co‐cultured with CD3+ T‐cells (right). n = 3. Mean ± SD. *P < 0.05, **P < 0.01, ***P < 0.001, and ****P < 0.0001 (one‐way ANOVA). (E) Tumor cell viability in P3dsRed organoids (MOI 75) co‐cultured with HLA‐matched PBMCs or CD3+ T‐cells. The arrow marks the co‐culture start. Scale bar = 1 mm. n = 3. Mean ± SEM. *P < 0.05, **P < 0.01, ***P < 0.001, and ****P < 0.0001 (two‐way ANOVA). AdV, adenovirus; CIITA, major histocompatibility complex class II transactivator; GB, glioblastoma; MHC‐II, major histocompatibility complex class II; MOI, multiplicity of infection; PBMC, peripheral blood mononuclear cell; RCU, red calibrated unit; T0, time zero; T : E ratio, tumor : effector ratio.
Fig. 5
Fig. 5
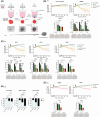
CIITA expression and cell‐to‐cell contact, but not antigen presentation, are required for immune‐mediated tumor cell killing. (A) In vitro proliferation assay of CD3+ T‐cells co‐cultured with OVA323‐339‐pulsed GL261 tumor cells or BMDM (positive control). n = 3. (B) Tumor cell viability in P3dsRed organoids (MOI 75) when co‐cultured with CD3+ T‐cells (T : E ratio of 1 : 10), comparing the effects of unpulsed versus CPI pool‐pulsed organoids. The arrow marks the co‐culture start. n = 3. Mean ± SEM. (two‐way ANOVA). (C–E) P3dsRed organoids (MOI 75) co‐cultured with PBMCs (T : E – 1 : 10). (C) GFP expression in Ad‐GFP‐infected vs non‐infected organoids. Scale bar = 1 mm. n = 3. Mean ± SD. ****P < 0.0001 (two‐way ANOVA). (D) Tumor cell viability in Ad‐GFP‐ or Ad‐CIITA‐infected GB organoids compared to non‐infected control. The arrow marks the co‐culture start. Scale bar = 1 mm. n = 3. Mean ± SEM. ****P < 0.0001 (one‐way ANOVA). (E) Tumor cell viability in two‐layer transwell co‐culture model. The arrow marks the co‐culture start. Scale bar = 1 mm. n = 3. Mean ± SEM. **P < 0.01 (one‐way ANOVA). CIITA, major histocompatibility complex class II transactivator; CPI pool, cytomegalo‐, parainfluenza, and influenza virus peptide pool; GB, glioblastoma; GFP, green fluorescent protein; MOI, multiplicity of infection; PBMC, peripheral blood mononuclear cell; RCU, red calibrated unit; T0, time zero; T : E ratio, tumor : effector ratio.
Fig. 6
Fig. 6
Immune‐mediated tumor cell killing of GB organoids does not involve T‐cell degranulation or canonical death receptor signaling pathways. (A) Flow cytometric analysis of surface CD107a (left panel) and intracellular IFN‐γ (right panel) in CD4+ and CD8+ T‐cells at 24 h post co‐culture. n = 3. Mean ± SD. *P < 0.05, **P < 0.01 and ***P < 0.001 (one‐way ANOVA). (B) Neutralization assay using anti‐human TNF‐R (MAB225) (left panel) or anti‐human FasL (MAB126) (right panel). The arrow marks the co‐culture start. n = 3. Mean ± SEM. (C) Heatmap of the most upregulated and downregulated proteins detected via protein cytokine array (bottom left). Graphs showing levels of secreted EMMPRIN and RANTES (bottom right). n = 1 (2 technical replicates). Mean ± SD. CIITA, major histocompatibility complex class II transactivator; EMMPRIN, extracellular matrix metalloproteinase inducer; FasL, fas ligand; GB, glioblastoma; IFN, interferon; MFI, mean fluorescence intensity; PBMC, peripheral blood mononuclear cell; RANTES, regulated upon activation normal T‐cell expressed and secreted; RCU, red calibrated unit; T0, time zero; T : E ratio, tumor : effector ratio; TNF‐R, tumor necrosis factor receptor.

Similar articles

Cited by

References

    1. Pires‐Afonso Y, Niclou SP, Michelucci A. Revealing and harnessing tumour‐associated microglia/macrophage heterogeneity in glioblastoma. Int J Mol Sci. 2020;21(3):689. - PMC - PubMed
    1. Quail DF, Joyce JA. The microenvironmental landscape of brain tumors. Cancer Cell. 2017;31(3):326–341. - PMC - PubMed
    1. Woroniecka K, Chongsathidkiet P, Rhodin K, Kemeny H, Dechant C, Farber SH, et al. T‐cell exhaustion signatures vary with tumor type and are severe in glioblastoma. Clin Cancer Res. 2018;24(17):4175–4186. - PMC - PubMed
    1. Burster T, Gärtner F, Bulach C, Zhanapiya A, Gihring A, Knippschild U. Regulation of MHC I molecules in glioblastoma cells and the sensitizing of NK cells. Pharmaceuticals (Basel). 2021;14(3):236. - PMC - PubMed
    1. Salvato I, Marchini A. Immunotherapeutic strategies for the treatment of glioblastoma: current challenges and future perspectives. Cancer. 2024;16(7):1276. - PMC - PubMed

MeSH terms