. 2024 Dec;11(48):e2411515.
doi: 10.1002/advs.202411515. Epub 2024 Nov 13.

Inactivation of Pseudovirus Expressing the D614G Spike Protein Mutation using Nitric Oxide-Plasma Activated Water

Affiliations

Inactivation of Pseudovirus Expressing the D614G Spike Protein Mutation using Nitric Oxide-Plasma Activated Water

Paritosh Patel et al. Adv Sci (Weinh). 2024 Dec.

Abstract

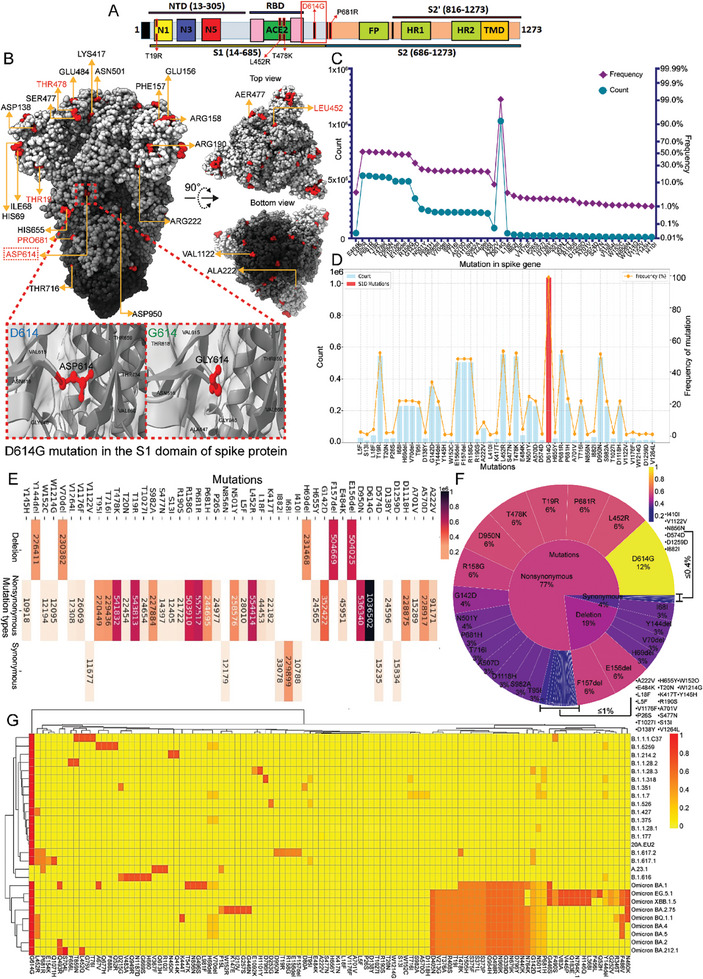
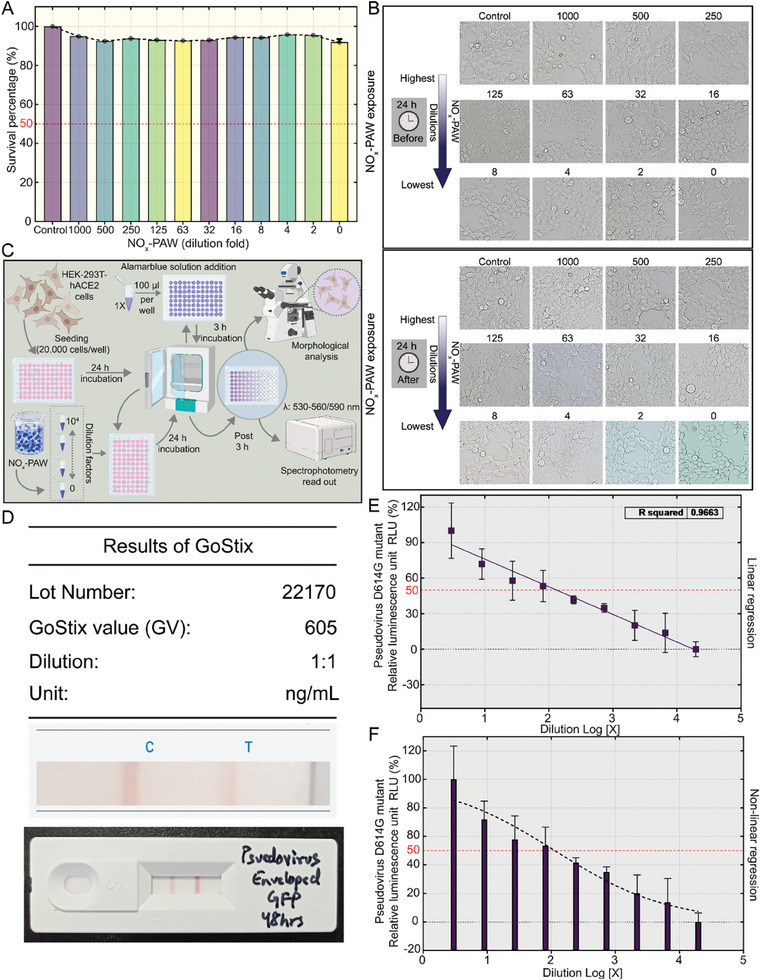
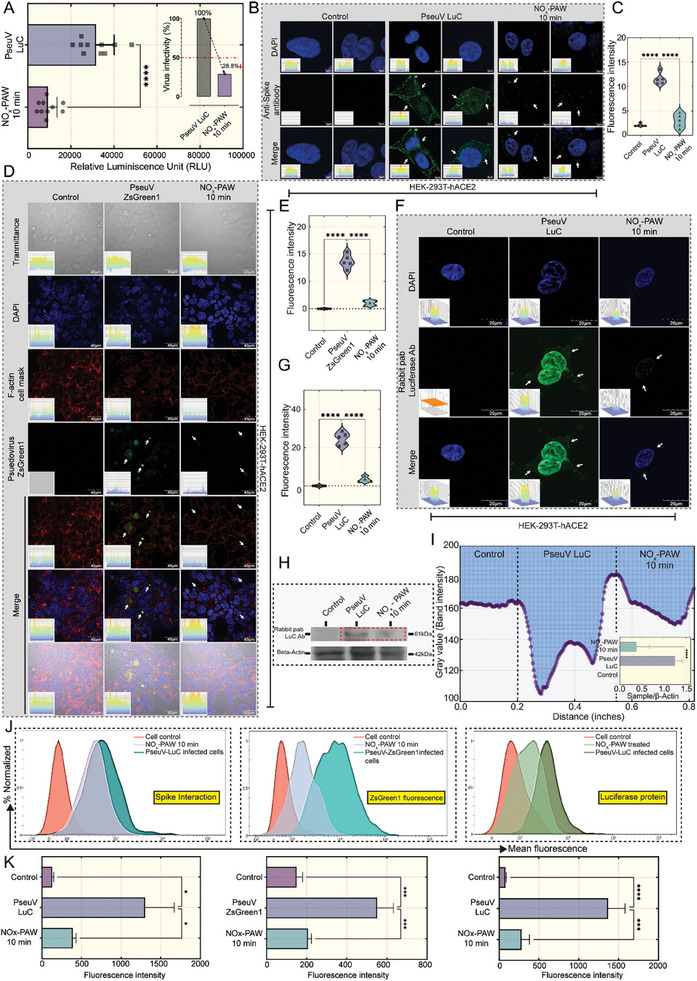
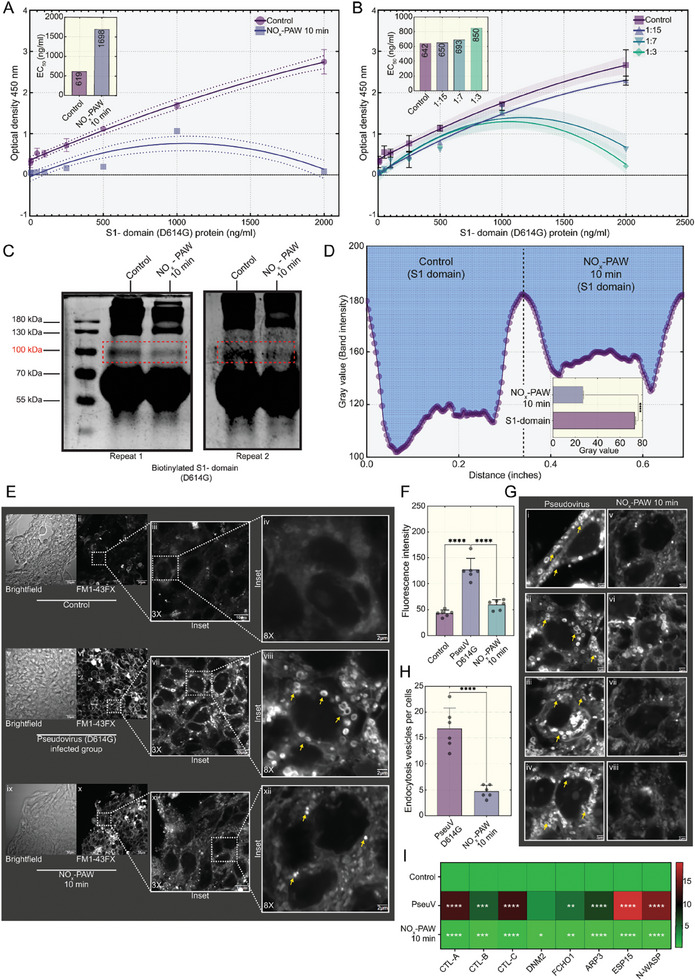
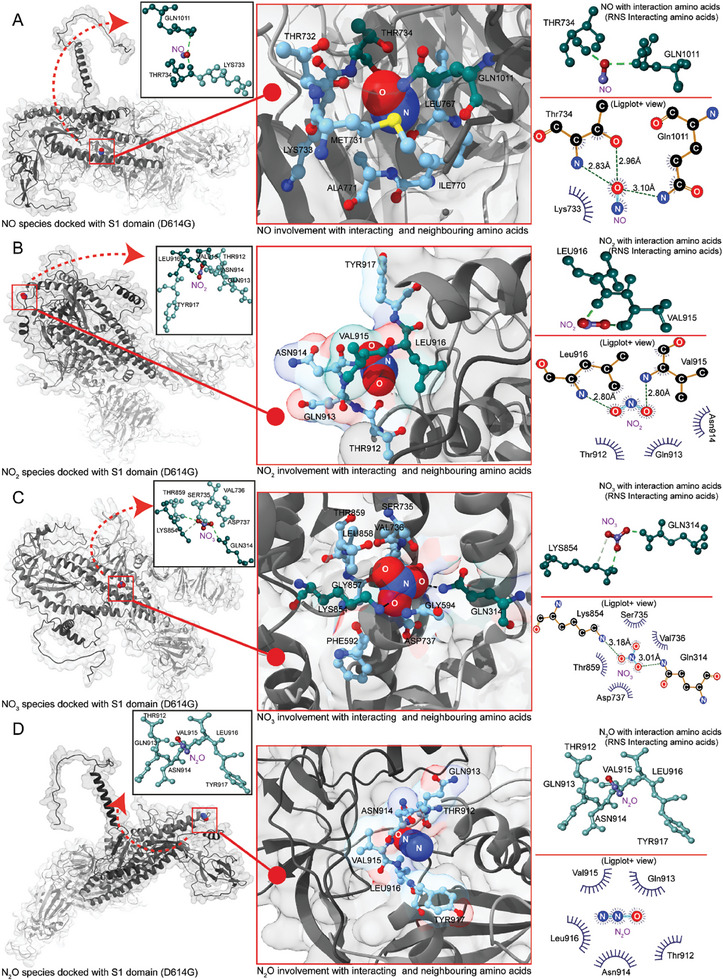
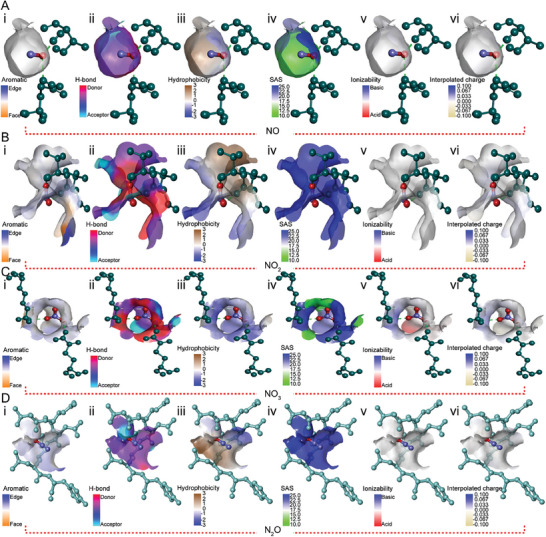
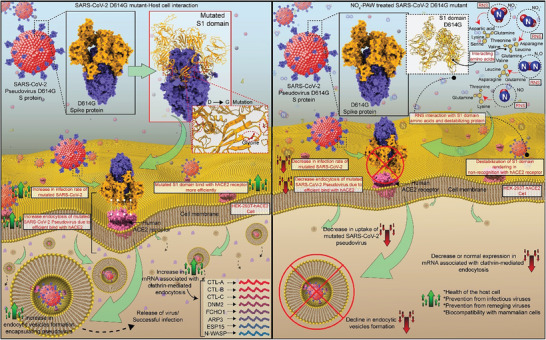
Variants of concern (VOCs) of Severe Acute Respiratory Syndrome Coronavirus 2 (SARS-CoV-2) exhibit high infectivity due to mutations, particularly in the spike protein, that facilitate enhanced binding of virus to human angiotensin-converting enzyme 2 (hACE2). The D614G mutation, situated in S1-domain, promotes the open conformation of spike protein, augmenting its interaction with hACE2. Activated water neutralizes pathogens by damaging biological molecules; however, its effect on mutated SARS-CoV-2 or VOCs requires further exploration. Here, the efficacy of nitric oxide (NOx)-plasma activated water (PAW) in inhibiting infections by SARS-CoV-2 pseudovirus expressing D614G-mutated spike protein is investigated, which serves as a model for mutated SARS-CoV-2. Results demonstrated high prevalence of D614G mutation in SARS-CoV-2 and its VOCs. NOx-PAW is non-toxic to cells at high concentration, inhibiting infection by 71%. Moreover, NOx-PAW induced structural changes in S1-domain of spike protein, reducing its binding affinity and lowering clathrin-mediated endocytosis-related gene expression. Additionally, in silico analysis revealed NOx species in NOx-PAW played key role in impairing S1-domain function of the mutated SARS-CoV-2 pseudovirus by interacting directly with it. Collectively, these findings reveal the potent inactivation ability of PAW against mutated SARS-CoV-2 and suggest its potential application in combating emerging variants of SARS-CoV-2 and other viral threats.

Keywords: SARS‐CoV‐2 pseudovirus D614G spike mutant; mutated virus inactivation; nitric oxides; plasma activated water; variants of concern.


Conflict of interest statement

The authors declare no conflict of interest.

Figures

Figure 1
Figure 1
Protein sequence analysis of the Severe Acute Respiratory Syndrome Coronavirus 2 (SARS‐CoV‐2) spike protein. (A) Schematic representation of the domain organization of the spike protein, denoting the most prevalent mutations. (B) The 3D trimeric architecture of the spike protein (PDB ID: 7dzw) variant is shown. Each region is shown at 90° rotations to show the location of the mutations. Graph demonstrating the mutational landscape of the SARS‐CoV‐2 spike protein (C) and S1‐domain (D), based on 1.2 million sequences from the NCBI virus database. Amino acid positions and mutations are shown on the X‐axis, and mutation count and frequency are presented on the Y‐axis. Peaks in the mutation count highlight structurally significant regions. (E) Heat map analysis of mutations across the SARS‐CoV‐2 spike protein. Rows correspond to discrete amino acids within the protein sequence. Columns represent distinct sequences, illustrating variant diversity. The map highlights mutation trends and changes in mutation frequencies in specific regions. Color intensities correlate with mutation frequency, with warmer colors indicating higher mutation rates. (F) Sunburst plot representing mutation types and frequencies. The inner circle is divided into three sectors for different mutation types, while the outer circle is categorized by frequency, corresponding to mutation frequency. Frequency values are shown in the outer sectors, with warmer colors indicating higher occurrence rates. (G) Analysis of SARS‐CoV‐2 spike protein mutations, visualizing genetic variation and enabling identification of mutation hotspots and patterns across viral sequences. Rows correspond to amino acid positions, and columns represent individual variants, with color intensity indicating mutation frequency.
Figure 2
Figure 2
Plasma setup and diagnostic of cylindrical dielectric discharge plasma. (A) Diagram illustrating the configuration of the CDBDP setup, (B) electrode layout, (C) voltage‐current profile, (D) analysis of optical emission spectra (OES), (E) Boltzmann plot analysis for determination of vibrational temperature (Tv), and (F) optimal fitting of experimental data for calculation of the rotational temperature (Tr).
Figure 3
Figure 3
Examination of the physiochemical characteristics and reactive species in cylindrical dielectric barrier discharge plasma. (A) Fourier transform infrared spectroscopy (FTIR) revealed the composition of gases produced in the plasma. Concentrations of (B) NO, (C) NO2, and (D) N2O determined by FTIR. (E) Time‐averaged concentrations of reactive species over a 30‐min plasma exposure period. (F) Aging effects on plasma‐activated water (PAW). Concentrations of (G) NO2 and (H) H2O2 in PAW. (I) FTIR evaluation of PAW liquid. Evaluation of the (J) pH, (K) oxidation‐reduction potential (ORP), and (L) electrical conductivity of PAW at different times during plasma treatment. (M,N) Contact angle of PAW for distilled water (DW) and bleach on glass and polyethylene surfaces. Statistical analysis between groups was conducted using one‐ and two‐way ANOVA with Dunnett's and Tukey's multiple comparison tests. The level of significance was determined, and stars (*) in graphs denote p‐values (*** p ≤ 0.001 and **** p ≤ 0.0001).
Figure 4
Figure 4
Biocompatibility testing and pseudovirus titration. (A) Alamar Blue assay was used to assess HEK‐293T expressing human angiotensin‐converting enzyme 2 (HEK‐293T‐hACE2) cell viability in various nitric oxide‐plasma activated water (NOx‐PAW) dilutions. (B) Microscopy results of the morphological changes in HEK‐293T‐hACE2 cells post‐incubation with NOx‐PAW dilutions. (C) Schematic representation of the workflow of the toxicity assessment in hACE2‐overexpressing HEK‐293T cells. (D) Quantification of SARS‐CoV‐2 pseudovirus with the D614G mutation using Lenti‐X GoStix Plus. (E, F) 50% tissue culture infectious dose (TCID50/mL) was determined by plotting virus dilution against relative luminescence unit using the Reed–Muench method. Statistical analysis between groups was conducted using ordinary one‐way ANOVA with Dunnett's multiple comparison test. The level of significance was determined, and graphs with non‐significant values were left blank.
Figure 5
Figure 5
Inactivation of the D614G pseudovirus by nitric oxide (NOx)‐plasma‐activated water (PAW) (NOx‐PAW). (A) Assessment of the inactivation of the pseudovirus using a luciferase luminescence assay to identify the presence of pseudovirus (D614G, carrying a luciferase reporter gene) infection in HEK‐293T expressing human angiotensin‐converting enzyme 2 (HEK‐293T‐hACE2 cells) (RLU, relative luminescence unit). (B,C) Confocal microscopy analysis and fluorescent intensity analysis of the interaction between the SARS‐CoV‐2 pseudovirus D614G spike protein and HEK‐293T‐hACE2 cells. Groups: Control cells; PseuV LuC, cells infected with pseudovirus D614G carrying a luciferase reporter gene; and NOx‐PAW 10 min, cells infected with NOx‐PAW treated pseudovirus D614G for 10 min. (D,E) Confocal microscopy and fluorescent intensity analysis of HEK‐293T‐hACE2 cells infected with SARS‐CoV‐2 pseudovirus (D614G, carrying a ZsGreen1 reporter gene).Groups: Control cells; PseuV ZsGreen1, cells infected with pseudovirus D614G carrying a ZsGreen1 reporter gene; and NOx‐PAW 10 min, cells infected with NOx‐PAW treated pseudovirus D614G for 10 min. Confocal microscopy images of the presence of luciferase in HEK‐293T‐hACE2 cells infected with SARS‐CoV‐2 pseudovirus (D614G, carrying a luciferase reporter gene) and the fluorescence intensities (F,G). (H) Western blot analysis of luciferase in HEK‐293T‐hACE2 cells infected with the pseudovirus (D614G, carrying a luciferase reporter gene) and the Gray value, measured using ImageJ (I). (J) Flow cytometric analysis of the mean fluorescence of spike protein interactions (left), ZsGreen1 (middle), and Luciferase protein (right) with their corresponding graph (K). Statistical analysis between groups was conducted using ordinary one/two‐way ANOVA with Dunnett's or Tukey's multiple comparison tests. The level of significance was determined, and stars (*) in the graphs denote p‐values (* p ≤ 0.05, *** p ≤ 0.001, and **** p ≤ 0.0001).
Figure 6
Figure 6
Inactivation of the S1‐domain by nitric oxide‐plasma activated water (NOx‐PAW) (A, B) Enzyme‐linked immunoassay of biotinylated S1 protein domain. Groups: control, biotinylated S1‐domain; NOx‐PAW 10 min, biotinylated S1‐domain treated with NOx‐PAW for 10 min, and treatment of biotinylated S1‐domain with various NOx‐PAW dilutions (1:15, 1:7 and 1:3). EC50 values, determined from the graph by plotting across from optical density at 450 nm to various concentrations of biotinylated S1‐domain. (C) SDS‐PAGE analysis of the S1‐domain. Groups: control (the S1‐domain) and NOx‐PAW 10 min (S1‐domain treated with NOx‐PAW for 10 min). Expression of the S1‐domain in SDS‐PAGE was analyzed using ImageJ (D). (E) Confocal microscopy image of endocytic vesicles in the HEK‐293T‐hACE2 cells, with cell membranes stained with FM1‐43FX dye: (E, i–iv) Control: without pseudovirus, no formation of vesicles; (E, v–viii) pseudovirus (D614G)‐infected cells, formation of vesicles, (E, ix‐xii) NOx‐PAW treated 10 min group: pseudovirus (D614G) treated with NOx‐PAW for 10 min, reduced formation of vesicles. Endocytic vesicles were measured using ImageJ (F). (G, funding acquisition H) Formation of endocytic vesicles in groups with and without NOx‐PAW treatment for 10 min (I) qRT‐PCR analysis of mRNA expression for a gene associated with clathrin‐mediated endocytosis. Statistical analysis between groups was conducted using ordinary‐one/two‐way ANOVA and an unpaired t‐test (two‐tailed) with Tukey's multiple comparison tests. The level of significance was determined, and stars shown in the graphs denote p‐values (* p ≤ 0.05, ** p ≤ 0.01, *** p ≤ 0.001, and **** p ≤ 0.0001). Graphs with non‐significant values were left blank or marked “ns.”.
Figure 7
Figure 7
Representation of S1‐domain (D614G) interacting with reactive nitrogen species (RNS), highlighting amino acids that formed covalent bonds. Teal‐colored aa were involved in covalent bonds with RNS. Light blue coloring in the ChimeraX image represents (image in the middle) neighboring and hydrophobic amino acids, while light teal in the DSV image represents hydrophobic residues. The accompanying 2D (ligplot+) (image on the right) interaction image visualizes covalent and hydrophobic bonds, including bond distances. (A) Representation of nitric oxide (NO) species docked with S1‐domain. (B) Depiction of NO2 species docked with the S1‐domain. (C) Illustration of NO3 species docked with S1‐domain. D) Visualization of N2O species docked with the S1‐domain.
Figure 8
Figure 8
Surface properties of the S1‐domain (D614G) amino acids participating in covalent bonds with reactive nitrogen species The properties displayed include: i) Aromatics, ii) H‐Bonds, iii) Hydrophobicity, iv) SAS (Solvent Accessible Surface), v) Ionizability, and vi) Interpolated charge. (A) The surface of the S1‐domain (D614G) during its interaction with NO. (B) The surface of the S1‐domain (D614G) during its interaction with NO2. (C) The surface of the S1‐domain (D614G) upon its interaction with NO3. (D) The surface of the S1‐domain (D614G) during its interaction with N2O.
Figure 9
Figure 9
An overview of the mechanism of inactivation by reactive nitrogen species of pseudovirus harboring D614G mutated spike protein, which leads to abrogation of receptor‐mediated endocytosis (clathrin‐mediated endocytosis) by host cells.

Similar articles

References

    1. COVID – Coronavirus Statistics – Worldometer, https://www.worldometers.info/coronavirus/, (accessed: February 2024).
    1. Bai Y., Du Z., Wang L., Lau E. H. Y., Fung I. C. H., Holme P., Cowling B. J., Galvani A. P., Krug R. M., Meyers L. A., Emerg. Infect. Dis. 2024, 30, 262. - PMC - PubMed
    1. Panda P. K., Arul M. N., Patel P., Verma S. K., Luo W., Rubahn H. G., Mishra Y. K., Suar M., Ahuja R., Sci. Adv. 2020, 6, abb8097. - PMC - PubMed
    1. Kaushik N., Patel P., Bhartiya P., Shin Y., Kim J. H., Choi E. H., Kaushik N. K., Microbes Infect. 2023, 25, 105150. - PMC - PubMed
    1. Bhatt A. N., Kumar A., Rai Y., Kumari N., Vedagiri D., Harshan K. H., Chinnadurai V., Chandna S., SSRN Electron. J. 2022, 295, 120411. - PMC - PubMed

Supplementary concepts

LinkOut - more resources