. 2024 Nov;28(21):e70171.
doi: 10.1111/jcmm.70171.

Integrated machine learning developed a prognosis-related gene signature to predict prognosis in oesophageal squamous cell carcinoma

Affiliations

Integrated machine learning developed a prognosis-related gene signature to predict prognosis in oesophageal squamous cell carcinoma

Peng Tang et al. J Cell Mol Med. 2024 Nov.

Abstract

The mortality rate of oesophageal squamous cell carcinoma (ESCC) remains high, and conventional TNM systems cannot accurately predict its prognosis, thus necessitating a predictive model. In this study, a 17-gene prognosis-related gene signature (PRS) predictive model was constructed using the random survival forest algorithm as the optimal algorithm among 99 machine-learning algorithm combinations based on data from 260 patients obtained from TCGA and GEO. The PRS model consistently outperformed other clinicopathological features and previously published signatures with superior prognostic accuracy, as evidenced by the receiver operating characteristic curve, C-index and decision curve analysis in both training and validation cohorts. In the Cox regression analysis, PRS score was an independent adverse prognostic factor. The 17 genes of PRS were predominantly expressed in malignant cells by single-cell RNA-seq analysis via the TISCH2 database. They were involved in immunological and metabolic pathways according to GSEA and GSVA. The high-risk group exhibited increased immune cell infiltration based on seven immunological algorithms, accompanied by a complex immune function status and elevated immune factor expression. Overall, the PRS model can serve as an excellent tool for overall survival prediction in ESCC and may facilitate individualized treatment strategies and predction of immunotherapy for patients with ESCC.

Keywords: machine‐learning algorithm; oesophageal squamous cell carcinoma; predictive model; random survival forest; tumour‐infiltrating immune cells.


Conflict of interest statement

The authors declare no conflicts of interest.

Figures

FIGURE 1
FIGURE 1
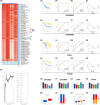
Screening for prognostic genes in ESCC using univariate Cox analysis. (A) A workflow of this study illustrated the overall process across the study, which created with BioGDP.com. (B) Univariate Cox regression analysis identified that 7 genes were associated with poor prognosis (p < 0.001, HR >1) and that 10 genes were associated with good prognosis (p < 0.001, HR <1) in the Merge dataset. (C) These genes were further verified in the GSE53622, (D) GSE53624 and (E) TCGA cohorts.
FIGURE 2
FIGURE 2
ML for constructing and validating of the prognosis‐related genes. (A) After integrating 10 classical algorithms and 99 machine learning combinations, RSF which had the highest average C‐index. (B) Genes identified according to the importance of the variables and the construction of an RSF algorithms model. (C) In the GSE53622 dataset, patients with high‐risk scores had significantly shorter OS than those with low‐risk scores. (D) The ROC‐AUC valuesfor predicting 1‐ and 3‐year OS. (E) The predictive efficacy of clinical parameters for predicting 3‐year OS. (F) DCA diagram for predicting 3‐year survival. (G) Patients with high‐risk scores had a notaly shorter OS than those with low‐risk scores in the GSE53624, (K) TCGA and (O) Merge cohorts. (H) The AUCs predicting 1‐, 3‐ and 5‐year OS in the GSE53624, (L) TCGA and (P) Merge datasets. (I) The predictive performance of clinical parameters for 3‐year OS across the GSE53624, (M) TCGA and (Q) Merge datasets. (J) The DCA plot for the 3‐year OS prediction of the PRS model in the GSE53624, (N) TCGA and (R) Merge datasets. The C‐index of the PRS model in the (S) GSE53622, (T) GSE53624, (U) TCGA and (V) Merge datasets. (W, X) The PRS scores were higher for ESCC patients who died than for those who were alive. (Y, Z) Patients with stage III disease exhibited significantly higher PRS scores than those with stage I disease.
FIGURE 3
FIGURE 3
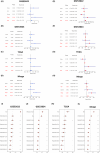
Cox regression for the PRS and comparisons with prior ESCC signatures. Based on univariate Cox analysis, PRS and stage were related to poor prognosis across (A) GSE53622, (B) GSE53624 and (C) TCGA datasets. (D) PRS, stage and age were associated with poor prognosis in the Merge dataset. Multivariate Cox analysis of the (E) GSE53622, (F) GES53624, (G) TCGA and (H) Merge datasets demonstrated that PRS independently served as a prognostic factor in ESCC patients. (I) The C‐index of the PRS predictive model ranked first among the other previously published signatures in the GSE53622, (K) TCGA and (L) Merge datasets. (J) The C‐index of the PRS model ranked second in the GSE53624 cohort, with no significant difference from that of the first‐ranked model.
FIGURE 4
FIGURE 4
Potential biological functions and pathways associated with the PRS according to GSEA and GSVA. (A) The adaptive immune response, activation of the immune response, immune response regulating the cell surface receptor signalling pathway, and lymphocyte mediated immunity were enriched in the high‐risk group based on GSEA‐GO. (B) CAMs, cytokine and cytokine receptor interactions, the intestinal immune network for IgA production and immune‐related diseases were enriched in the high‐risk group according to GSEA‐KEGG. (C) The IFN‐r response, IFN‐a response, KARS signalling up, epithelial mesenchymal transition and inflammatory response were enriched in the high‐risk group according to GSEA‐Hallmark. (D) Compared with those in the low‐risk group, the GSVA scores for immune‐related pathways were elevated in the high‐risk group (E) Similar results were observed in the Hallmark pathway enrichment analysis.
FIGURE 5
FIGURE 5
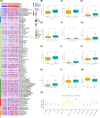
Immune microenvironment and characteristics in different PRS subgroups. (A) Seven immune algorithms were used to estimate the abundance of TIICs comprehensively. (B) The high‐risk group exhibited a significantly elevated ImmuneScore and (C) StromalScore according to the ESTIMATE algorithm. (D) The xCell algorithm revealed a higher ImmuneScore in the high‐risk group. (E) CD8+ T cells exhibited greater infiltration in the high‐risk group, as indicated by the MCPcounter, (F) EPIC, (G) xCell and (H) TIMER algorithms. (I) Tregs displayed increased infiltration in the high‐risk group, which was particularly evident in the xCell and (J) QUANTISEQ algorithms. (K) DC exhibited increased infiltration in the high‐risk group, which was notably pronounced in the xCell and (L) TIMER algorithms. (M) The high‐risk group demonstrated decreased tumour purity. (N) The high‐risk group exhibited elevated scores for various signatures related to immune function.
FIGURE 6
FIGURE 6
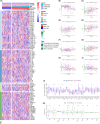
Immune cytokines and features in different PRS subgroups. (A) Cytokine and cytokine receptor levels were assessed in the high‐risk and low‐risk groups. (B) There were significant associations between CXCL14 (r = −0.44), (C) CSF1 (r = 0.32), (D) FAS (r = 0.24), (E) CXCL10 (r = 0.24), (F) IFNB1 (r = 0.23), (G) IL2RA (r = 0.21), (H) EGF (r = −0.21) and (I) CCR5 (r = −0.21) and the PRS score. (J) Fifteen immune checkpoint genes exhibited increased expression in the high‐risk group, while 3 genes were more pronounced in the low‐risk group. (K) IFNG, Merck18, CD8 and CAF showed higher levels in the high‐risk group.
FIGURE 7
FIGURE 7
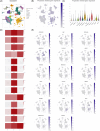
Gene expression distribution of PRS on distinct cell types on single cell level. In the GSE16029 dataset, (A) 13 major lineage cell populations were identified. (B) The UMAP plot displayed and (C) the grid violin plot detailed the average expression distribution of the 17‐gene on each type of cells. (D) The gene proportion were shown individually in three cell subtypes visualized by heatmaps, including immune, malignant and stromal cells. (E) 17‐gene expression were explored in 13 major lineage cell populations visualized by UMAP diagrams.

References

    1. Cancer Genome Atlas Research, N , Analysis Working Group: Asan University , BC Cancer Agency . Integrated genomic characterization of oesophageal carcinoma. Nature. 2017;541(7636):169‐175. - PMC - PubMed
    1. Moody S, Senkin S, Islam SMA, et al. Mutational signatures in esophageal squamous cell carcinoma from eight countries with varying incidence. Nat Genet. 2021;53(11):1553‐1563. - PubMed
    1. Liu Z, Zhao Y, Kong P, et al. Integrated multi‐omics profiling yields a clinically relevant molecular classification for esophageal squamous cell carcinoma. Cancer Cell. 2023;41(1):181‐195. - PubMed
    1. Rahman SA, Walker RC, Lloyd MA, et al. Machine learning to predict early recurrence after oesophageal cancer surgery. Br J Surg. 2020;107(8):1042‐1052. - PMC - PubMed
    1. Zhang Y, Zhang L, Li B, et al. Machine learning to predict occult metastatic lymph nodes along the recurrent laryngeal nerves in thoracic esophageal squamous cell carcinoma. BMC Cancer. 2023;23(1):197. - PMC - PubMed

MeSH terms

Substances

LinkOut - more resources