Review
. 2024 Nov 27;124(22):12573-12660.
doi: 10.1021/acs.chemrev.4c00293. Epub 2024 Nov 13.

Molecular Spies in Action: Genetically Encoded Fluorescent Biosensors Light up Cellular Signals

Affiliations
Review

Molecular Spies in Action: Genetically Encoded Fluorescent Biosensors Light up Cellular Signals

Anneliese M M Gest et al. Chem Rev. .

Abstract

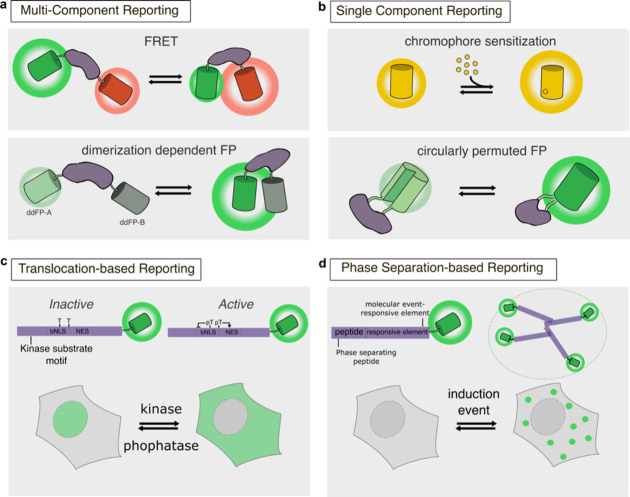
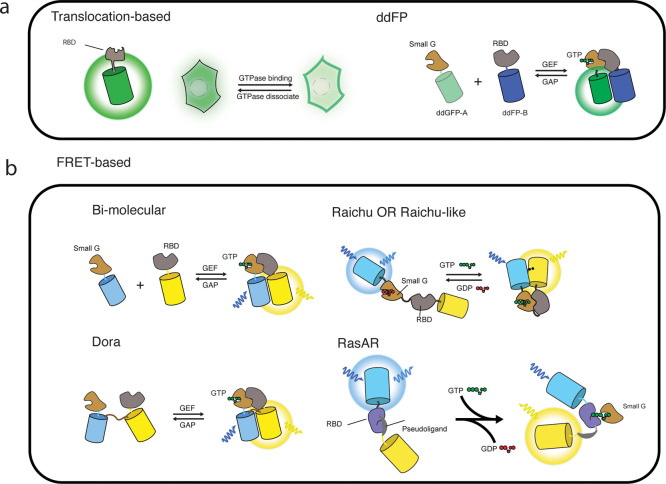
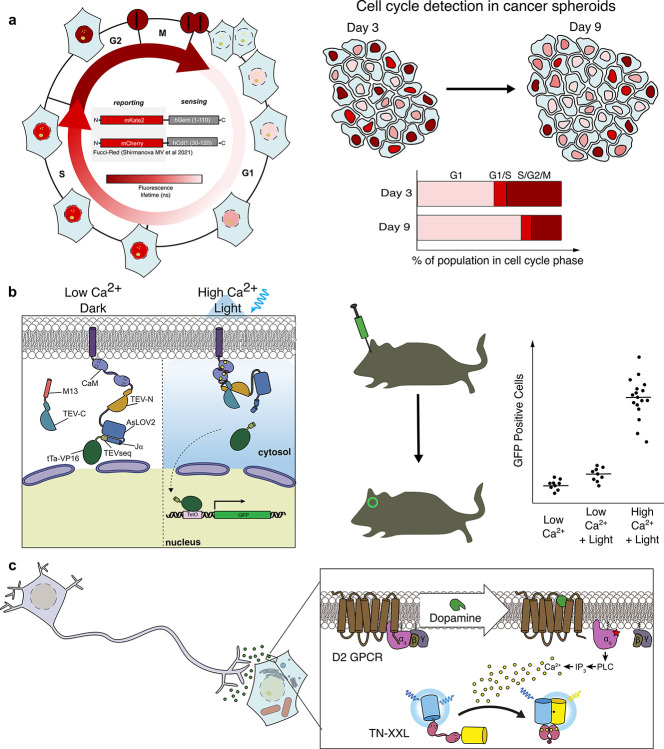
Cellular function is controlled through intricate networks of signals, which lead to the myriad pathways governing cell fate. Fluorescent biosensors have enabled the study of these signaling pathways in living systems across temporal and spatial scales. Over the years there has been an explosion in the number of fluorescent biosensors, as they have become available for numerous targets, utilized across spectral space, and suited for various imaging techniques. To guide users through this extensive biosensor landscape, we discuss critical aspects of fluorescent proteins for consideration in biosensor development, smart tagging strategies, and the historical and recent biosensors of various types, grouped by target, and with a focus on the design and recent applications of these sensors in living systems.


Conflict of interest statement

The authors declare no competing financial interest.

Figures

Figure 1
Figure 1
Structural modifications of FPs. (a) In the split FP system, N- and C-terminal fragments of the FP (FP-N and FP-C, respectively) are split at residue 158 and reconstitute when in proximity to one another in a nonspontaneous manner. (b) In the split superfolder FP system, FP strands 1–10 (FP1–10) and strand 11 (FP11) are split and spontaneously reconstitute. (c) In the tripartite split FP system, the FP is split into three parts: FP strands 1–9 (FP1–9), strand 10 (FP10), and strand 11 (FP11). Upon interaction of FP10 and FP11, both strands reconstitute with FP1–9.
Figure 2
Figure 2
Split-FP labeling for imaging a protein of interest. The 11th β-strand (FP11) of split superfolder GFP is fused to a protein of interest, and reconstitution of FP11 with untargeted FP1–10 allows for labeling of structures such as actin in live cells.
Figure 3
Figure 3
BiFC and FRET approaches to detect protein–protein interactions. (a) In bimolecular fluorescence complementation (BiFC), two complementary fragments of a split-FP, FP-N, and FP-C, are tagged to different proteins of interest (POIs). When the two POIs interact, the FP fragments undergo irreversible complementation and chromophore maturation, resulting in fluorescence emission. (b) In trimolecular fluorescence complementation (TriFC), β-strands 11 (FP11) and 10 (FP10) of sfGFP are tagged to two different POIs, along with untargeted FP1–9. As with BiFC, interaction of the two POIs induces irreversible FP reconstitution and fluorescence emission. (c) In Förster/fluorescence resonance energy transfer (FRET)-based PPI detection, a donor (e.g., green) and acceptor (e.g., red) FP are tagged to two different POIs, such that interaction between the POIs brings the two FPs into molecular proximity (<10 nm distance), resulting in increased acceptor fluorescence and decrease donor fluorescence. (d) FRET requires significant overlap between the donor emission spectrum and the acceptor absorption spectrum. During FRET, excitation of the donor will lead to increased emission from the acceptor increases (dashed red line) and reduced emission from the donor (dashed green line). Thus, the acceptor-to-donor emission ratio can be calculated as an indicator of FRET. (e) FRET can also be quantified by monitoring the fluorescence lifetime of the donor fluorophore. The donor fluorescence emission decays more rapidly in the presence of a FRET acceptor (dashed line) compared to when no FRET acceptor is present (solid line).
Figure 4
Figure 4
Using FP labels for imaging at different biological scales. (a) FPs fused to nucleic acid-binding proteins or histones to allow for labeling of mRNAs or chromatin structure, respectively. (b) FP fusion to organelle-targeting sequences allows labeling of various organelles in live cells. Imaging two FPs targeted to different organelles can indicate organelle contact sites at regions with colocalized fluorescent signals. (c) Expression of FPs driven by cell-type specific promoters can enable labeling of groups of cells or tissues. This approach can be used to distinguish cancerous cells from neighboring healthy tissue.
Figure 5
Figure 5
Types of reporting units. (a) Multicomponent reporting units can be based on FRET (upper panel) or dimerization-dependent FPs (ddFPs, lower panel). In the FRET system, the donor (green) and acceptor (red) fluorophores are tagged to the termini of the sensing unit (purple). Upon a sensing a specific molecular event, a conformational change in the sensing unit alters the proximity and orientation of the donor and acceptor fluorophores, resulting in a change in FRET. In the ddFP-based system, ddFP-A (dimly fluorescent) and ddFPB (nonfluorescent) are tethered to either end of the sensing unit. Analogous to the FRET-based design, a conformational change resulting from a sensing event alters the interaction between the two ddFP partners, modulating the fluorescence intensity of ddFP-A. (b) Single-component reporting units can consist of a single FP that exhibits sensitivity to the target (upper panel). In this reporting scheme, the target directly binds to the FP chromophore and leads to altered fluorescence intensity. Alternatively, a circularly permuted FP (cpFP) can be integrated with a sensing unit, with the sensing event leading to altered fluorescence intensity in the cpFP. (c) An example of translocation-based reporting, in which the function of tandem nuclear localization and export signals is modulated by a molecular event (e.g., kinase-mediated phosphorylation of a substrate peptide; T, threonine), leading to changes in the nucleocytoplasmic shuttling of a tethered FP. (d) Phase separation-based reporting involves tagging an FP to a peptide or protein capable of forming dynamic, multivalent interactions in response to a molecular event, sequestering the FP into phase-separated biomolecular condensates, shown here as green cytosolic puncta.
Figure 6
Figure 6
Types of genetically encoded voltage indicators (GEVIs). (a,b) Voltage sensing domain (VSD)-based GEVIs incorporate a voltage-gated ion channel or voltage-sensitive phosphatase as a sensing domain, tagged to either a FRET-pair (a) or cpFP (b). Membrane depolarization induces a conformational change that alters FRET efficiency or fluorescence intensity of the cpFP. (c,d) Rhodopsin-based GEVIs include a 7-transmembrane photoreceptor, or rhodopsin, as the sensing unit. The rhodopsin exhibits an intrinsic fluorescence signal that is affected by membrane depolarization. In the single-fluorophore design (c), this intrinsic fluorescence change is the readout of membrane potential. Electrochromic FRET-based GEVIs (d) include a bright FP as a FRET donor paired with the rhodopsin, which acts as an acceptor. Upon membrane depolarization, donor FP fluorescence is quenched, yielding a decrease in fluorescence intensity.
Figure 7
Figure 7
Monitoring ion concentrations using FP-based sensors. (a) The three primary biosensor design strategies used for ion sensors: FRET-based sensors (upper), single-FP sensors (middle), and sensors in which the FP itself responds to changes in ion concentration (lower). (b) Sensing units for ion biosensors are generally either bipartite designs (top panel) as used in GCaMP, or unimolecular sensors (bottom panel), such as the zinc fingers used in the ZifCY series of sensors. (c,d) An example of one strategy for measuring absolute ion concentrations using a single-FP sensor. (c) PEAQ biosensing leverages the photochromism of some cpEGFP-based biosensors. In the presence of Ca2+ (top panel), fluorescence is increased with violet light illumination, and decreased with cyan illumination. In the absence of Ca2+ (bottom panel) the inverse is true, with violet light turning the sensor “off” and cyan turning it “on”. (d) The workflow for PEAQ or iPEAQ biosensing. The sensor is measured under both violet and cyan illumination in vitro, in the presence of different concentrations of Ca2+, from 0 to a saturating amount. The fluorescence intensity at each wavelength is used to calculate (ΔF/F0)hv at each of the various Ca2+ concentrations. This calibration is then applied to data from Ca2+ imaging in live cells, enabling determination of absolute Ca2+ concentrations in biological contexts, e.g., after histamine stimulation.
Figure 8
Figure 8
Genetically encoded fluorescent indicators for detecting various cellular analytes. (a) Most FRET- and single-FP-based cAMP indicators have been developed using cAMP-binding domains derived from either EPAC or PKA. A cAMP-binding domain from the bacterium Mesorhizobium loti (mlCNBD) was recently used to generate a highly responsive single-FP cAMP indicator, G-Flamp1. cGMP indicators are constructed similarly to cAMP indicators, using a cGMP-specific binding domain derived from PKG. (b) Translocation-based phosphoinositide (PtdIns) indicators (upper) are constructed by directly fusing an FP to a PtdIns-binding domain, such as a pleckstrin homology (PH) domain. When expressed in cells, PtdIns indicators will translocate to (or from) the endogenous location where the target PtdIns is produced (or degraded). The FRET-based FLLIP PtdIns indicator (middle) uses a hinge-like linker and a specific PtdIns-binding domain (e.g., PH domain from GRP1) inserted between a FRET pair and can report changes in plasma membrane PtdIns levels through changes in FRET. InPAkt (lower) utilizes the PH domain from Akt and a negatively charged pseudoligand as a molecular switch to drive PtdIns-dependent FRET changes and can be targeted to different subcellular compartments to examine local PtdIns dynamics. (c) OxyFRET (upper) and PerFRET (middle) use different sensing units for H2O2 and show opposite FRET changes upon H2O2 increases. The Hyper series of single-FP-based H2O2 indicators use E. coli transcription factor OxyR, which can be specifically oxidized by H2O2, resulting in dramatic conformational changes that shift the cpYFP excitation peak from 420 nm to 500 nm (lower).
Figure 9
Figure 9
Neurotransmitter sensors. (a) GPCR-based sensors respond to neurotransmitter binding, resulting in a conformational change in the receptor that is transmitted to the coupled cpFP, giving a change in fluorescence intensity. (b) Periplasmic-binding protein (PBP)-based sensors consist of the PBP coupled to a cpFP and tethered to a transmembrane helix, which presents the sensor on the extracellular face of the plasma membrane. Neurotransmitter binding to the PBP results in a change in cpFP fluorescence. (c) Neurotransmitter sensors localize to the neuronal plasma membrane and enable imaging of neurotransmitter detection at a single synapse in response to a single action potential.
Figure 10
Figure 10
Biosensors for monitoring various stages of GPCR-mediated signaling. (a) Receptor activation: Analyte binding to a GPCR causes a conformational change that results in decreased FRET between donor and acceptor FPs tethered to the GPCR. (b) G-Protein recruitment: An FP-tagged G-protein complex is recruited to activated, FP-tagged receptor. Increased proximity between the GPCR and the recruited G-protein leads to increased FRET. (c) β-arrestin recruitment: Luciferase-tagged β-arrestin produces bioluminescence in the presence of substrate. Upon recruitment of β-arrestin to an activated GPCR, the luminescence signal is quenched due to the occurrence of BRET between the luciferase and a membrane-targeted acceptor FP, leading to increased fluorescence. The increased BRET signal can persist upon GPCR internalization and trafficking to endosomes.
Figure 11
Figure 11
Protease biosensor designs. (a) Two FRET-compatible FPs are connected by a linker that contains a protease recognition and cleavage sequence. When the protease cleaves the recognition sequence, the distance bewtween the FPs increases, leading to decreased FRET. (b) A similar design incorporates the two components of a ddFP pair, whereupon protease-medated cleavage leads to a decrease in fluorescence intensity. (c) A split-FP is physically constrained from undergoing reconstitution by the insertion of linkers containing a protease cleavage sequence. In the presence of protease activity, the linker is cleaved, alowing the split-FP to reconstitute, shown in more detail in (d). (d) Flip-GFP involves β-strands 11 and 10 of cpGFP tethered to one another by a linker sequence as well as E5 and K5 peptides. This keeps the two strands locked in a parallel conformation, rather than their natural antiparallel state. The linker contains a protease cleavage sequence which, in the presence of an active protease, enables a return to the antiparallel conformation and GFP reconstitution and fluorescence. In the absence of protease, no reconstitution occurs.
Figure 12
Figure 12
Illuminating the kinome using genetically encoded fluorescent biosensors. (a) Kinase activity reporters incorporate a substrate sequence for the kinase of interest to report endogenous kinase activity. Different design strategies for kinase activity reporters are shown. (b) Kinase activation sensors typically utilize native conformational changes with a full-length kinase of interest and report the activation dynamics of the kinase itself, which is overexpressed as part of the sensor. (c) An overview of currently available kinase biosensors (marked by pentagons) across the kinome tree (generated by KinMap, illustration reproduced courtesy of Cell Signaling Technology, Inc. (www.cellsignal.com)). Different design strategies are color-coded, and selected kinases are used as examples to show the available designs for kinase sensors.
Figure 13
Figure 13
Biosensor designs for monomeric GTPases. (a) Translocation-based GTPase indicators (left) contain an RBD, which mediates recruitment of a fused FP to subcellular compartments where activated GTPases are present. ddFP-based GTPase indicators (right) depend on the interaction of a ddFP-A-tagged GTPase (Small G) and ddFP-B-tagged RBD and essentially report the dynamics of endogenous GEF and GAP activities, rather than measuring GTPase activation directly. (b) FRET-based GTPase reporters often similarly use a molecular switch composed of a GTPase and RBD, either in a bimolecular or unimolecular format (e.g., Raichu and Dora), and thus rely on GEF and GAP activity, while a pseudoligand-based design (e.g., RasAR) can be used to directly measure GTPase activity.
Figure 14
Figure 14
Multistep reporting systems. (a) The cell cycle reporter FUCCI-Red incorporates two red-emitting FPs, mKate2 and mCherry, which have distinct fluorescence lifetimes, tagged to hGem (1–110) and hCdt1 (30–120), respectively (left). As the cell progresses through the cell cycle, the observed fluorescence lifetime changes based on expression of mKate2 or mCherry, indicated by the deep red to pink gradient. FUCCI-Red was used to detect cell cycle states in cancer spheroids throughout their growth and revealed increased proportions of cells in the G1 phase compared to G1/S or S/G2/M phases at day 9 of growth compared to day 3 (right). (b) The Ca2+ integrator FLiCRE is a dual-gated reporter that, in high-Ca2+ environments and upon blue-light exposure, binds Ca2+ and leads to cleavage of the TEVp cleavage site, freeing the transcription factor to translocate to the nucleus and induce GFP expression. This reporter was used in mice to visualize the history of activated neurons in the nucleus accumbens of the mouse brain upon various inputs. (c) CNiFERs are reporters developed to detect the release of various neurotransmitters in vivo. The CNiFER for dopamine includes a dopamine-specific GPCR. Dopamine binding to the receptor triggers cytosolic Ca2+ release, which is detected using the FRET-based Ca2+ indicator TN-XXL.

Similar articles

Cited by

References

    1. Chalfie M.; Tu Y.; Euskirchen G.; Ward W. W.; Prasher D. C. Green Fluorescent Protein as a Marker for Gene Expression. Science 1994, 263, 802–805. 10.1126/science.8303295. - DOI - PubMed
    1. Inouye S.; Tsuji F. I. Aequorea Green Fluorescent Protein. Expression of the Gene and Fluorescence Characteristics of the Recombinant Protein. FEBS Lett. 1994, 341, 277–280. 10.1016/0014-5793(94)80472-9. - DOI - PubMed
    1. Lambert T. J. FPbase: A Community-Editable Fluorescent Protein Database. Nat. Methods 2019, 16, 277–278. 10.1038/s41592-019-0352-8. - DOI - PubMed
    1. Heim R.; Prasher D. C.; Tsien R. Y. Wavelength Mutations and Posttranslational Autoxidation of Green Fluorescent Protein. Proc. Natl. Acad. Sci. U.S.A. 1994, 91, 12501–12504. 10.1073/pnas.91.26.12501. - DOI - PMC - PubMed
    1. Craggs T. D. Green Fluorescent Protein: Structure, Folding and Chromophore Maturation. Chem. Soc. Rev. 2009, 38, 2865–2875. 10.1039/b903641p. - DOI - PubMed