. 2024 Nov 5;34(11):bhae415.
doi: 10.1093/cercor/bhae415.

Neural signatures of visual awareness independent of postperceptual processing

Affiliations

Neural signatures of visual awareness independent of postperceptual processing

Michael A Cohen et al. Cereb Cortex. .

Abstract

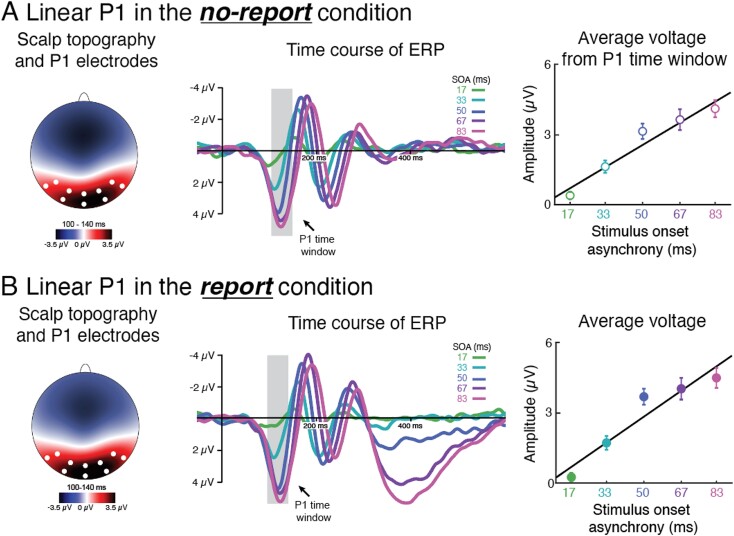
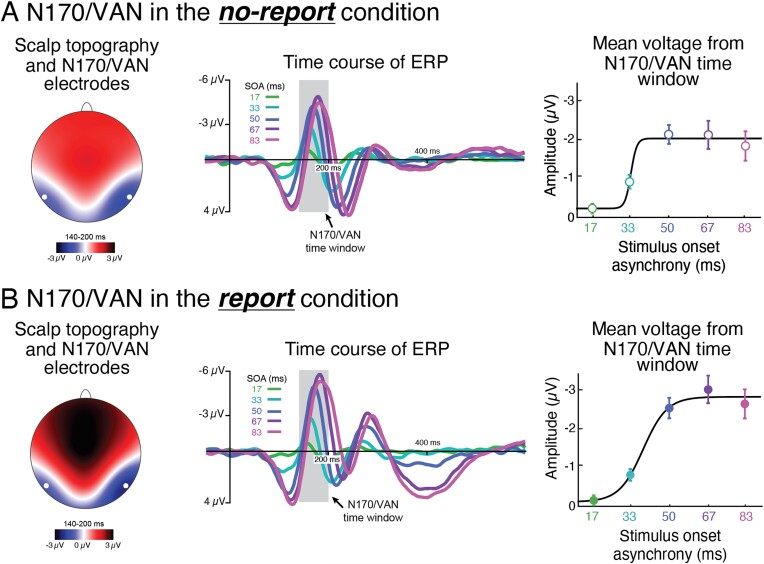
What are the neural processes associated with perceptual awareness that are distinct from preconscious sensory encoding and postperceptual processes such as reporting an experience? Using electroencephalography and a no-report visual masking paradigm, we manipulated stimulus visibility by varying the time between stimuli and masks in linear steps (17, 33, 50, 67, and 83 ms). Awareness increased nonlinearly, with stimuli never seen at the two shortest intervals, always seen at the two longest, and 50% seen at the intermediate interval. Separate report and no-report conditions were used to isolate awareness from task performance. Our results revealed a neural signal closely linked to perceptual awareness, independent of the task: a fronto-central event-related potential that we refer to as the N2 (~250 to 300 ms). Earlier event-related potential signals reflected the linear manipulation of stimulus strength, while later signals like P3b and temporal generalization of decoding were tied to task performance, appearing only in the report condition. Taken together, these findings inform current debates regarding theories of consciousness and offer new avenues for exploring the neural mechanisms supporting conscious processing.

Keywords: EEG; attention; awareness; consciousness; perception; vision.


Figures

Fig. 1
Fig. 1
Behavioral paradigm and results. A) Design of visual masking paradigm. A face (or blank) was presented for 8 ms, followed by a variable SOA, and then two successive masks, each presented for 100 ms. In the report condition, subjects were tasked with reporting whether they saw or didn’t see a face on each trial (Y/N). In the no-report condition, the subjects’ task was to detect occasional ring targets randomly presented throughout the stream (i.e. sometimes superimposed on a face and sometimes shown when no face is present). B) Report condition behavioral results. Face-seen rates are presented on the y-axis, and the different SOAs are presented on the x-axis. Error bars represent the standard error of the mean, and the five data points are fit with a nonlinear regression.
Fig. 2
Fig. 2
Visualizations of the P1 in the no-report and report conditions. A) No-report and B) report conditions. Left: Topographical voltage distributions between 100 and 140 ms with all electrodes used to analyze the P1 indicated on the scalp map. Center: P1 waveforms for all five SOAs plotted over time. Right: Average amplitudes from electrodes used for the P1 across all five SOAs. Error bars represent the standard error of the mean, and the five data points are fit with a linear regression.
Fig. 3
Fig. 3
Visualizations of the P3b in the no-report and report conditions. A) No-report and B) report conditions. Left: Topographical voltage distributions between 300 and 500 ms with all electrodes used to analyze the P3b indicated on the scalp map. Center: P3b waveforms for all five SOAs plotted over time. Right are the average amplitudes from all electrodes used for the P3b across all five SOAs. Error bars represent the standard error of the mean, and the five data points are fit with a nonlinear regression.
Fig. 4
Fig. 4
Visualizations of the N170/VAN in the no-report and report conditions. A) No-report and B) report conditions. Left: Topographical voltage distributions between 140 and 200 ms with the electrodes used to analyze the N170/VAN indicated on the scalp map. Center: N170/VAN waveforms for all five SOAs plotted over time. Right: Average amplitudes from electrodes used for the N170/VAN analysis across all five SOAs. Error bars represent the standard error of the mean, and the five data points are fit with a nonlinear regression.
Fig. 5
Fig. 5
Visualizations of the N2 in the no-report and report conditions. A) No-report and B) report conditions. Left: Topographical voltage distributions between 250 and 290 ms with all electrodes used to analyze the N2 indicated on the scalp map. Center: N2 waveforms for all five SOAs plotted over time. Right: Average amplitudes across all electrodes used for the N2 across all five SOAs. Error bars represent the standard error of the mean, and the five data points are fit with a nonlinear regression.
Fig. 6
Fig. 6
N2 waveforms in the report condition from two groups of participants sorted by P3b peak amplitude (median split, n = 20 in each group). A) Waveforms for the largest P3b group and B) waveforms for the smallest P3b group. Left: Topographical voltage distributions between 250 and 290 ms with the electrodes used to analyze the N2 indicated on the scalp map. Center: N2 waveforms for all five SOAs plotted over time. Right: Average amplitudes from electrodes used for the N2 analysis across all five SOAs. Error bars represent the standard error of the mean, and the five data points are fit with a nonlinear regression.
Fig. 7
Fig. 7
Temporal generalization matrices in no-report and report conditions. A) No-report and B) report conditions. Decoders were trained to discriminate stimulus-present and stimulus-absent trials at each time point between 0 and 700 ms and tested at all time points. In the no-report condition A), decoding was successful only along the training–testing diagonal, suggesting a sequential activation of different brain regions. However, in the report condition B), while the 33 ms SOA only allowed for weak decoding along the diagonal, the longer SOAs elicited a combination of diagonal decoding and late sustained generalization (square-shaped patterns) that begins roughly 300 ms after stimulus onset. The right panel represents a hypothetical result interpreted under the proposal that late temporal generalization reflects conscious perception, depicting the diagonal associated with unconscious processing and the square shape associated with conscious processing. The current results challenge this proposal.
Fig. 8
Fig. 8
Intertrial EEG variability in no-report and report conditions at centro-parietal electrodes. Top row corresponds to the no-report condition, and the bottom row corresponds to the report condition. On the horizontal axes are the five SOAs (ms), and on the vertical axes is the intertrial variability of evoked activity as a function of the signal-to-noise (SNR) at these different time windows. Note that the electrode cluster used in this analysis is the same one used for the P3b in the present study, which is highly similar to the group of electrodes used by Sergent et al. (2021) in their previous variability analysis.

Similar articles

References

    1. Bekinschtein TA, Dehaene S, Rohaut B, Tadel F, Cohen L, Naccache L. Neural signature of the conscious processing of auditory regularities. Proc Natl Acad Sci USA. 2009:106:1672–1677. 10.1073/pnas.0809667106. - DOI - PMC - PubMed
    1. Berkovitch L, Del Cul A, Maheu M, Dehaene S. Impaired conscious access and abnormal attentional amplification in schizophrenia. NeuroImage Clin. 2018:18:835–848. - PMC - PubMed
    1. Bola M, Doradzinska L. Perceptual awareness negativity—does it reflect awareness or attention? Front Hum Neurosci. 2021:15:742513. 10.3389/fnhum.2021.742513. - DOI - PMC - PubMed
    1. Boly M, Massimini M, Tsuchiya N, Postle BR, Koch C, Tononi G. Are the neural correlates of consciousness in the front of or in the back of the cerebral cortex? Clinical and neuroimaging evidence. J Neurosci. 2017:37:9603–9613. 10.1523/JNEUROSCI.3218-16.2017. - DOI - PMC - PubMed
    1. Brown R, Lau H, LeDoux JE. Understanding the higher-order approach to consciousness. Trends Cogn Sci. 2019:23:754–768. 10.1016/j.tics.2019.06.009. - DOI - PubMed

Publication types

LinkOut - more resources