. 2025 Jun;47(3):3027-3042.
doi: 10.1007/s11357-024-01426-3. Epub 2024 Nov 13.

The impact of inactivation of the GH/IGF axis during aging on healthspan

Affiliations

The impact of inactivation of the GH/IGF axis during aging on healthspan

Sher Bahadur Poudel et al. Geroscience. 2025 Jun.

Abstract

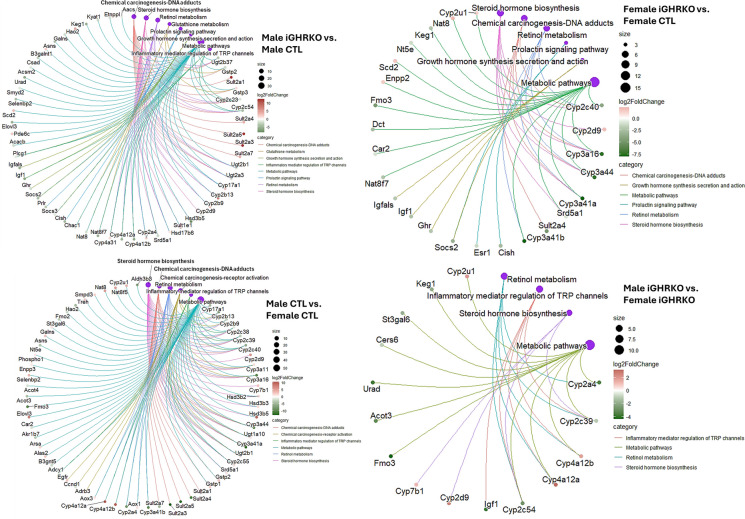
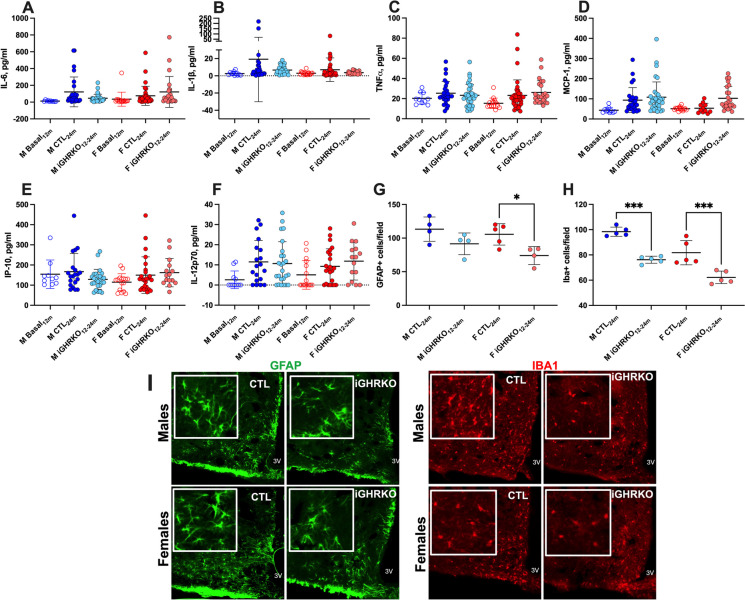
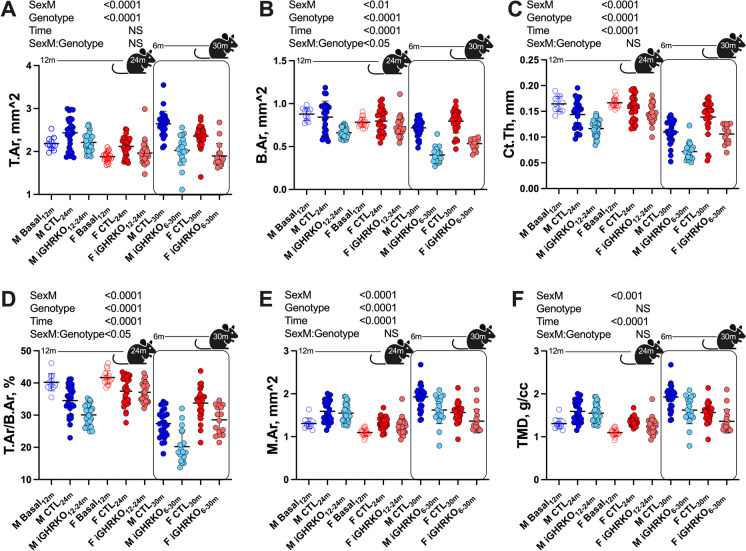
Several mouse lines with congenital growth hormone (GH)/insulin-like growth factor-1 (IGF-1) axis disruption have shown improved health and extended lifespan. The current study investigated how inactivating this axis, specifically during aging, impacts the healthspan. We used a tamoxifen-inducible global GH receptor (GHR) knockout mouse model starting at 12 months and followed the mice until 24 months of age (iGHRKO12-24 mice). We found sex- and tissue-specific effects, with some being pro-aging and others anti-aging. Measuring an array of cytokines in serum revealed that inactivation of the GH/IGF-1 axis at 12 months did not affect systemic inflammation during aging. On the other hand, hypothalamic inflammation was significantly reduced in iGHRKO12-24 mice, evidenced by GFAP+ (glial fibrillary acidic protein, a marker of astrocytes) and Iba-1+ (a marker for microglia). Liver RNAseq analysis indicated feminization of the male transcriptome, with significant changes in the expression of monooxygenase, sulfotransferase, and solute-carrier-transporter gene clusters. Finally, we found impaired bone morphology, more pronounced in male iGHRKO12-24 mice and correlated with GH/IGF-1 inactivation onset age. We conclude that inhibiting the GH/IGF-1 axis during aging only partially preserves the beneficial healthspan effects observed with congenital GH deficiency.

Keywords: Aging; Bone; Growth hormone; Inflammation; Insulin-like growth factor-1; Liver; Micro-CT.


Conflict of interest statement

Declarations. Ethics approval: Animal protocol was reviewed and approved by the Institutional Animal Care and Use Committee of NYU, NY, NY. Conflict of interest: The authors declare no competing interests.

Figures

Fig. 1
Fig. 1
Adult-induced inactivation of the GH axis impacts systemic hormones. A Experimental design. 12-month-old GHR.fl/fl Cre+ mice were randomly allocated to cages, injected with tamoxifen or vehicle (oil), and followed up to 24 months of age. B Serum IGF-1 levels were determined by ELISA. C Body weights and D body lengths were taken at dissection. Sample size, descriptive statistics, and multiple regression models are presented in Supplementary Table 1. Serum levels of E insulin, F FGF21, and G leptin were measured using the MesoScale Discovery U-Plex platform. Data presented as mean ± SD, sample size, descriptive statistics, and multiple regression models are presented in Supplementary Table 2
Fig. 2
Fig. 2
Adult-induced inactivation of the GH axis results in transcriptional remodeling in the liver. RNAseq analysis was performed for livers from 24-month-old male and female mice (M CTL n = 6, M iGHRKO12-24 n = 4, F CTL n = 5, F iGHRKO12-24 n = 5). Gene hit counts were extracted and used for differential expression analysis. A Principal component analysis (PCA). B Venn diagram showing that the cyp2d9 gene was significantly affected in all genotypes. C Presented are volcano plots of differentially expressed genes (DEG), and D a heat map of DEG. GEO access number: GSE272069
Fig. 3
Fig. 3
Adult-induced inactivation of the GH axis results in feminizing the male liver transcriptome. Pathway enrichment analysis was conducted using the KEGG database to identify significantly enriched pathways among the differentially expressed genes (DEGs) between A CTL and iGHRKO12-24 male, B CTL and iGHRKO12-24 female, C CTL male and female, and D iGHRKO12-24 male and female mice. The top significantly enriched KEGG pathways were ranked by their enrichment scores and shown in c-net (category network) plots. The purple nodes represent the enriched pathways, with more prominent nodes indicating more associated genes. The nodes adjacent to specific DEGs are colored based on the statistical significance and enrichment of the corresponding pathways. They are presented in a spectrum of red (upregulated genes) to green (downregulated genes) colors
Fig. 4
Fig. 4
Adult-induced inactivation of the GH axis does not alter systemic inflammation but is associated with reduced neuroinflammation. Serum levels of A IL-6, B IL-1β, C TNFα, D MCP-1, E IP-10, and F IL-12p70 were measured using the MesoScale Discovery U-Plex platform. Data presented as mean ± SD, sample size, descriptive statistics, and multiple regression models are presented in Supplementary Table 2. The number of G GFAP-positive and H Iba-positive cells was assessed from sections of the hypothalamic arcuate nucleus. Data presented as mean ± SD of four to five mice/group
Fig. 5
Fig. 5
Effects of adult-induced inactivation of the GH axis on cortical bone. Cortical bone morphology was assessed at the femur mid-diaphysis. Parameters measured included A total cross-sectional area (T.Ar), B bone area (B.Ar), C cortical bone thickness (Ct.Th), D B.Ar/T.Ar, E marrow area (M.Ar), and F bone tissue mineral density (TMD). Data presented as mean ± SD, sample size, descriptive statistics, and multiple regression models are presented in Supplementary Table 3
Fig. 6
Fig. 6
Effects of adult-induced inactivation of the GH axis on trabecular bone. Trabecular bone morphology was assessed at the femur mid-diaphysis (AD) and the L5 vertebral body (EH). Parameters measured included A, E bone volume/total volume (BV/TV); B, F bone mineral density (BMD); C, G trabecular thickness (Tb.Th); and D, H trabecular number (Tb.N). Data presented as mean ± SD, sample size, descriptive statistics, and multiple regression models are presented in Supplementary Table 3. Serum levels of I P1NP, J CTX, and K PTH were measured using marker-specific ELISA kits. Data presented as mean ± SD, sample size, descriptive statistics, and multiple regression models are presented in Supplementary Table 2. L, M The number of osteoclasts on bone surfaces was calculated from L5 paraffin sections stained with tartrate-resistant acid phosphatase (TRAP). Data was presented as mean ± SD, with sample size as follows: M CTL n = 13, M iGHRKO n = 14, F CTL n = 10, F iGHRKO n = 12

References

    1. List EO, et al. Common and uncommon mouse models of growth hormone deficiency. Endocrine Rev. 2024;bnae017. 10.1210/endrev/bnae017/7690304. - PMC - PubMed
    1. Hage C, Salvatori R. Growth hormone and aging. Endocrinol Metab Clin North Am. 2023;52(2):245–57. - PubMed
    1. Tavares MR, Frazao R, Donato J. Understanding the role of growth hormone in situations of metabolic stress. J Endocrinol. 2023;256(1). 10.1530/JOE-22-0159. - PubMed
    1. Bartke A. Somatotropic axis, pace of life and aging. Front Endocrinol (Lausanne). 2022;13:916139. - PMC - PubMed
    1. Masternak MM, et al. Dwarf mice and aging. Prog Mol Biol Transl Sci. 2018;155:69–83. - PubMed

Substances

LinkOut - more resources