. 2024 Dec 2;223(12):e202401084.
doi: 10.1083/jcb.202401084. Epub 2024 Nov 13.

Non-cell autonomous regulation of cell-cell signaling and differentiation by mitochondrial ROS

Affiliations

Non-cell autonomous regulation of cell-cell signaling and differentiation by mitochondrial ROS

Yipeng Du et al. J Cell Biol. .

Abstract

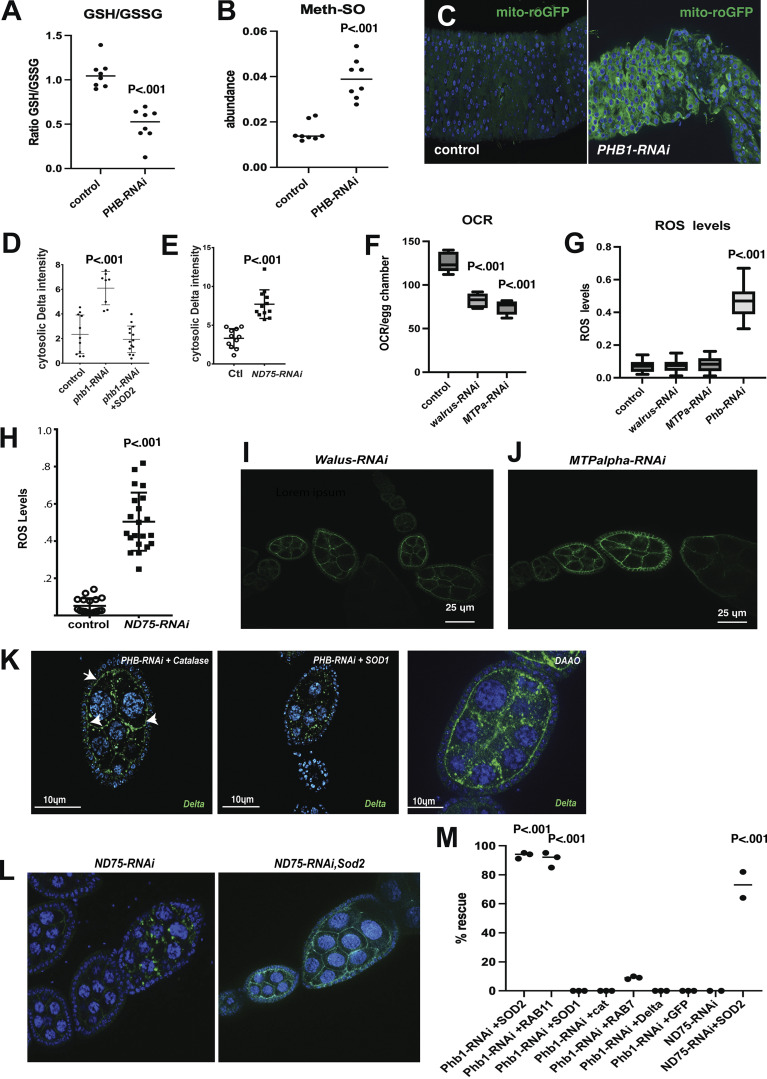
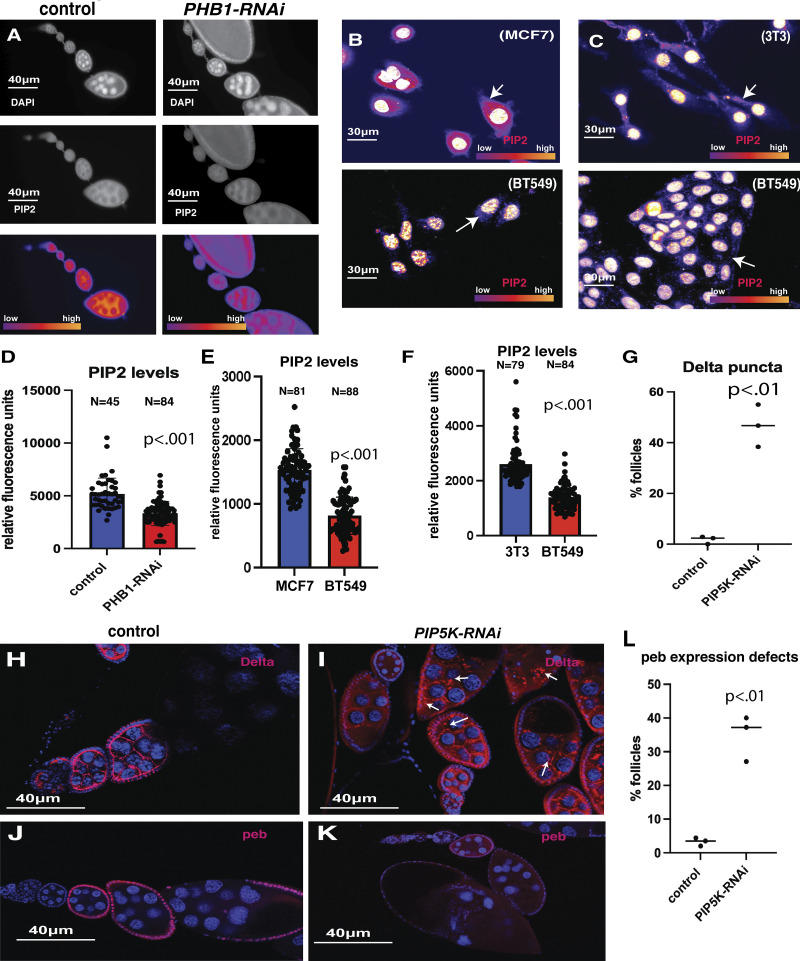
Mitochondrial reactive oxygen species (ROS) function intrinsically within cells to induce cell damage, regulate transcription, and cause genome instability. However, we know little about how mitochondrial ROS production non-cell autonomously impacts cell-cell signaling. Here, we show that mitochondrial dysfunction inhibits the plasma membrane localization of cell surface receptors that drive cell-cell communication during oogenesis. Within minutes, we found that mitochondrial ROS impairs exocyst membrane binding and leads to defective endosomal recycling. This endosomal defect impairs the trafficking of receptors, such as the Notch ligand Delta, during oogenesis. Remarkably, we found that overexpressing RAB11 restores ligand trafficking and rescues the developmental defects caused by ROS production. ROS production from adjacent cells acutely initiates a transcriptional response associated with growth and migration by suppressing Notch signaling and inducing extra cellualr matrix (ECM) remodeling. Our work reveals a conserved rapid response to ROS production that links mitochondrial dysfunction to the non-cell autonomous regulation of cell-cell signaling.


Conflict of interest statement

Disclosures: The authors declare no competing interests exist.

Figures

Figure 1.
Figure 1.
Germ cell Mitochondrial dysfunction prevents follicle cell differentiation. (A) A diagram describing the use of Drosophila oogenesis to examine the non-cell autonomous effects of germline mitochondrial dysfunction on somatic follicle cell development. (B–E) DAPI stained images of stage 10 and stage 14 egg chambers from control and PHB1-RNAi ovaries. (F and G) Ovarioles stained with DAPI and phosphohistone H3 (red) from the matα–>DsRed-RNAi (control) and matα (one copy)–>PHB1-RNAi females. F′ and G′ are zoomed-in images of egg chambers from F and G. (H) Follicle cell number counts from stage 10 egg chambers represented as a box and whisker plot. (n = 25 follicles). (I) Size measurements of stage 14 egg chambers. The line in the plot represents the average value. n = 10 egg chambers. (J) The number of PH3+ follicle cells from control and matα–>PHB1-RNAi females (n = 30 ovarioles). (K) Follicle cell nucleus size measurements of control and PHB1-RNAi stage 10 egg chambers (N = 20). (L and M) Images of Control and PHB1-RNAi follicle cell clones: blue represents DAPI, and green represents GFP from the follicle cell clone. (N) A graph representing the frequency of one to two cell clones in control RNAi clones and PHB1-RNAi clones. (O) RNA-seq data examining the expression of known germ cell-expressed genes. The precise fold change is overlayed on the heatmap. (Genes marked with a red fold change display an FDR < 0.05). LpR1, LpR2, and yl are known to be expressed in germ cells during late oogenesis (Stage 9–12). P) RNA-seq data examining the expression of known follicle cell-expressed genes (genes marked in red display an FDR < 0.05). The control used in all RNAi experiments is mata ->dsRED-RNAi All RNA seq-data represents three biological replicates. Student’s t test was used for all pairwise comparisons, and one-way ANOVA was used for all experiments containing >2 sample groups. Error bars represent the standard deviation.
Figure S1.
Figure S1.
Germline mitochondrial dysfunction disrupts Drosophila ooegenesis. (A–C) Whole ovary images from control, mataX2(2 copies)–> PHB-RNAi, and mataX1PhB-RNAi females. (D–F) DAPI staining images of control, mataX2 PhB-RNAi, and mataX1PhB-RNAi ovarioles. (G) PH3+ positive cell counts from control and PHB1-RNAi#2 ovarioles (n = 20). (H and I) PH3 staining images of control and PHB1-RNAi #2 ovarioles. (J) RNAi-knockdown efficiencies measured by Q-PCR from control and RNAi transgenes used in this manuscript (n = 3). (K) GFP antibody staining images from the mata-GAL4-> UAS-GFP ovarioles confirming the germline-specific expression of the driver. (L) Gene ontology enrichment analysis for genes Downregulated in the PHB1-RNAi follicles. (M) Gene ontology enrichment analysis for genes upregulated in the PHB1-RNAi follicles. (N) A volcano plot of RNA-seq data comparing mRNA expression between control follicles and PHB1-RNAi expressing oocytes (FDR < 0.05). (O) RNA seq- data examining the expression of genes involved with follicle cell specification and patterning in PHB1-RNAi follicles. (P) RNA-seq data examining the expression of ecdysone pathway genes in PHB-RNAI follicles. (Genes marked with a red fold change display an FDR < 0.05). The control used in all RNAi experiments is mata ->dsRED-RNAi. Student’s t test was used for all pairwise comparisons, and one-way ANOVA was used for all experiments containing >2 sample groups. Error bars represent the standard deviation.
Figure 2.
Figure 2.
Mitochondrial dysfunction impairs Notch signaling between germ cells and follicle cells. (A) A diagram depicting the mitosis to endocycle transition, a very early step in follicle cell differentiation, and its regulation by Notch signaling. (B and C) Ovarioles from dsRED-RNAi control and PHB1-RNAi females stained with Delta ligand antibodies (red) and DAPI. (D) Immunofluorescence images of control and PHB1-RNAi egg chambers stained with Delta Antibodies (Red), NRE-GFP reporter(green), and DAPI. (E and F) immunofluorescence images of dsRED-RNAi control and PHB1-RNAi ovarioles stained with peb antibodies (green) and DAPI. (G) A graph showing NRE-GFP expression in control and PHB1-RNAi egg chambers (n = 20 follicles). (H) A graph showing the differences in cytosolic delta levels (n = 20 follicles). (I) Peb expression levels in control and Phb1-RNAi ovarioles (n = 20). Student’s t test was used for all pairwise comparisons, and one-way ANOVA was used for all experiments containing >2 sample groups. Error bars represent the standard deviation.
Figure S2.
Figure S2.
Mitochondrial dysfunction imairs the trafficking to specific receptors. (A) Images of egg chambers from control, PHB1-RNAI #2, and PHB1TS1 temperature-sensitive mutants stained for Delta ligand green. (B) Gurken antibody-stained egg chambers from control and PHB1-RNAi females. (C–D’’) Immunostaining of control and PHB1-RNAi egg chambers depicting delta (red) localization and mCD8-GFP (green) localization. (E–F′) Images of PTP69D staining in control and PHB1-RNAi ovarioles. (G–J) Notch-ECD (green) staining images of control and PHB1-RNAi egg chambers. (K) Fluorescence levels from antibody-stained images of control and PHB1-RNAi ovarioles (n = 25). Student’s t test was used for all pairwise comparisons, and one-way ANOVA was used for all experiments containing >2 sample groups. Error bars represent the standard deviation.
Figure S3.
Figure S3.
Mitochondrial dysfunction prevents Delta trafficking independent of developmental arrest. (A–F) Whole ovariole images and images of Delta stained ovarioles from RNAi transgenes for known mitochondrial genes, including control, PHB2-RNAi, ATP5CF6-RNAi, Bor-RNAi, Cype-RNAi, and tomm22-RNAi. Whole ovary images represent females with two copies of the matα-GAL4 driver and immunofluorescence images ovarioles from females carrying one-Copy of the matα-GAL4 driver. (G–L) Whole ovariole images and images of Delta stained ovarioles from RNAi transgenes for non-mitochondrial genes including Fib-RNAi, Nob5-RNAi, HSC-70-4-RNAi, Prosalpha7-RNAi, Prosbeta5-RNAi, and OCT1-RNAi. Whole ovary images represent females with two copies of the matα-GAL4 driver and immunofluorescence images ovarioles from females carrying one-Copy of the matα-GAL4 driver.
Figure 3.
Figure 3.
ROS production regulates Delta ligand trafficking. (A) ATP measurements from control and PHB1-RNAi egg chambers (n = 3 independent samples). (B) Seahorse-based oxygen consumption rate from control and PHB1-RNAi ovarioles (n = 6 sets of three ovarioles). (C) Measurements of TMRE fluorescence from control and PHB1-RNAi egg chambers (n = 10 independent samples). (D and E) TMRE stained images of control, PHB1-RNAi. (F) ROS measurements from control, PHB1-RNAi, and PHB1-RNAi +SOD2 ovarioles. Follicle cells function as an internal control. The data is expressed as a nurse cell/follicle cell fluorescence ratio. (n = 10 independent samples). (G–I) whole ovary images of control, PHB1-RNAi, and PHB1-RNAi +SOD2 egg chambers (2 copies of GAL4). (J–L) DHE staining images of ROS levels of control, PHB1-RNAi, and PHB1-RNAi +SOD2 egg chambers (1 copy of GAL4). (M–O) Immunofluorescence images of control, PHB1-RNAi, and PHB1-RNAi +SOD2 egg chambers (one copy of GAL4) stained with Delta antibodies. (P and S) DHE staining of control and ND-75-RNAi egg chambers. (Q, R, T, and U) Immunofluorescence images of control and ND-75-RNAi egg chambers stained with Delta antibodies (1 copy of GAL4). Student's t test was used for all pairwise comparisons, and one-way ANOVA was used for all experiments containing >2 sample groups. Error bars represent the standard deviation.
Figure S4.
Figure S4.
ROS production regulates Delta protein trafficking. (A) LC/MS GSH/GSSG ratio measurements from control and PHB1-RNAi egg chambers (n = 8 biological samples). (B) LC/MS measurements of Methionine-sulphoxide levels from control and PHB1-RNAi egg chambers (n = 8 biological samples). (C) images of mito-roGFP (green) fluorescence from control and PHB1-RNAi expression intestines. (D) Cytosolic delta levels of control, PHB1-RNAi, and PHB1-RNAi +SOD2 egg chambers (n = 20 independent samples). (E) Cytosolic delta levels of control and ND-75-RNAi egg chambers (n = 20 independent samples). (F) oxygen consumption rate measurements from control, walrus-RNAi, and MTPalpha-RNAi staged egg chambers (N = 6 sets stage 10 egg chambers). Egg chambers were used in this experiment to correct for delays in development. (G) ROS levels from control, walrus-RNAi, MTPalpha-RNAi, and ND75-RNAi egg chambers based on fluorescent imaging. Follicle cells are used as an internal control, and the data is expressed as a ratio of nurse cell/follicle cell fluorescence (n = 20 egg chambers). (H) ROS-level quantification from control and ND75-RNAi egg chambers (n = 20 egg chambers). (I and J) Delta staining images of ovarioles from Walrus-RNAI and MTPalpha-RNAi females. (K) Delta staining of PHB-RNAi+catalase, PHB-RNAi+SOD1, and DAAO-expressing ovarioles. Arrows point to areas where Delta localization to the membrane is rescued. (L) Delta staining images from ND75-RNAi and ND75-RNAi+SOD2 ovarioles. (M) A summary graph measuring the %rescue of ovarioles showing normal Delta membrane staining of all UAS-transgenes used in this study. The expression of all the transgenes used in this graph is driven by matα-GAL4. Each data point represents an experiment of at least 25 ovarioles. Student’s t test was used for all pairwise comparisons, and one-way ANOVA was used for all experiments containing >2 sample groups. Error bars represent the standard deviation.
Figure 4.
Figure 4.
ROS prevents exocyst binding to the membrane. (A) A diagram describing the MCF7 cell model used to examine the impact of a 30-min ROS exposure on the membrane proteome. (B) A volcano plot examining the changes in membrane proteome caused by ROS exposure (FDR < 0.05). (C) A heat map depicting the expression changes of the top 100 most differentially regulated proteins in membranes isolated from ROS-exposed cells (FDR < 0.05). (D) Protein abundances for several common membrane proteins in control and H2O2-treated cells. (E) Membrane abundances for exocyst complex components in control and H2O2-treated MCF7 cells (FDR < 0.05). (F) A heat map showing the top 100 most differentially regulated proteins in membrane fraction from 3T3 cells and 3T3 treated with H2O2. (G) A heat map representing proteomic-based measurements of the detectable subunits of the exocyst complex from membrane fractions isolated from Drosophila eggs. (H) A heat map representing proteomic-based measurements of the detectable subunits of the exocyst complex from membrane fractions isolated from NIH3T3 cells. (I) A heat map representing proteomic-based measurements of known exocyst regulators from membrane fractions isolated from MCF7 cells. (J) Western blot validation for EXOC 1 and 6 from MFC7 total cell lysate, cytosolic fractions, and purified membrane fractions. (K) Western blots examining the levels of Exoc1 and Exoc6 in membrane fractions from MCF7 cells and BT549 cells. (L) Western blots examining Exoc1, Exoc3, and Exoc6 levels in control liver and Myc-O/E hepatic tumors. Student’s t test was used for all pairwise comparisons, and one-way ANOVA was used for all experiments containing >2 sample groups. Error bars represent the standard deviation. Source data are available for this figure: SourceData F4.
Figure S5.
Figure S5.
ROS production disrupts endosomal traffikcing and cell cell communication. (A) GO enrichment for protein domains found in proteins downregulated in membrane fractions purified from MCF7 cells exposed to ROS. (B) ROS levels from MCF7 cells and BT549 cells. (C) Quantification of the levels of EXOC1 and EXOC6 in membrane fractions from MCF7 cells and BT549 cells (n = 3). (D) A heat map showing the abundance of RAB family GTPases in purified membrane fractions from MCF7 cells. (E) DHE staining of PHB1-RNAi and PHB1-RNAI; +RAB11-O/E ovarioles. (F) quantification of peb antibody staining fluorescence from control and PIPK-RNAi ovarioles (n = 20). (G) volcano plot depicting the protein level differences between control 3T3cell and 3T3 cells cultured with H2O2. (H) A heat map depicting the expression of NRF2 target genes in cells adjacent to ROS-producing cells. (I) a heatmap of the gene expression abundance changes in genes associated with the term “secreted protein.” Expression levels are expressed as a ratio ROS-coculture/control. (J) A heatmap of the top 100 most significant differentially regulated genes in cells adjacent to ROS-producing cells. (K) A heatmap of the abundance of genes associated with the gene ontology term “extracellular protein” from our list of genes downregulated in cells adjacent to ROS-producing cells(Red text indicates a known role in cancer growth, metastasis, and angiogenesis). (L) ROS-Levels in Hek293 control cells, DAAO-expressing, and cells co-cultured adjacent to ROS-producing DAAO+ cells (n = 25). (M) A Venn diagram showing the overlap of genes known to be regulated by extracellular ROS exposure (NCBI GEO: GSE227554, H2O2 exposure for 6 h) and our list of genes regulated by co-culture in contact with ROS-producing cells. (N) GO term enrichment for the 23 genes overlapping our data and the H2O2-regulated genes studied in GSE227554. Student’s t test was used for all pairwise comparisons, and one-way ANOVA was used for all experiments containing >2 sample groups. Error bars represent the standard deviation.
Figure 5.
Figure 5.
ROS disrupts exocyst-mediated endosomal recycling of Delta ligands. (A–C) Whole ovary images of control, PHB1-RNAi, and PHB1-RNAi +RAB11(o/e) egg chambers (two copies of GAL4). (D–F) Immunofluorescence images of control, PHB1-RNAi, and PHB1-RNAi +RAB11(o/e) egg chambers stained with Delta antibodies. (G) Ovary size measurements of control, PHB1-RNAi, and PHB1-RNAi +RAB11(o/e) egg chambers (one copy of GAL4) (n = 20 ovaries). (H) cytosolic delta level measurements of control, PHB1-RNAi, and PHB1-RNAi +RAB11(o/e) egg chambers (n = 25 egg chambers). (I) A graph depicting the percentage of mid-oogenesis egg chambers that display Delta membrane localization or cytosolic Delta aggregates (N = 25 egg chamber). (J) Immunofluorescence images of control and RAB11-DN expressing egg chambers stained with Delta antibodies (red) Arrows indicate Delta puncta. Student’s t test was used for all pairwise comparisons, and one-way ANOVA was used for all experiments containing >2 sample groups. Error bars represent the standard deviation.
Figure 6.
Figure 6.
ROS regulates endosomal recycling by reducing the levels of PIP2 in membranes. (A) Images of ovarioles from control and PHB-RNAi females. Top image DAPI, middle Images PIP2, bottom image LUT intensity image of PIP2 levels. (B) images of (MCF7) and (BT549) cells stained with DAPI and PIP2 antibodies (LUT intensity image of PIP2 levels). (C) Images of control (3T3) and (BT549) cells stained with PIP2 antibodies (LUT intensity image of PIP2 levels). Fluorescence levels are expressed with a Fire LUT. Arrows indicate a PIP signal in the cell body. (D) Quantification of PIP2 antibody staining levels from control and PHB-RNAi ovarioles. (E) Quantification of PIP2 antibody staining fluorescence from (MCF7) and (BT549) cells. (F) Quantification of PIP2 antibody staining fluorescence from control (3T3) and (BT549) cells. (G) Quantification of the percentage of follicles containing punctate Delta staining from three independent experiments. (Each experiment contained at least 25 egg chambers, and the total number of eggs assayed for each group was at least 85). (H and I) Delta antibody staining images from control and PIP5K-RNAi (sktl-RNAi) ovarioles. Arrows point to Delta puncta. (J and K) peb antibody staining images from control and PIP5K-RNAi (sktl-RNAi) ovarioles. (L) Quantification of the percentage of follicles containing abnormally low peb expression from three independent experiments. (Each experiment contained at least 25 egg chambers, and the total number of egg chambers assayed for each group was at least 85). Student’s t test was used for all pairwise comparisons, and one-way ANOVA was used for all experiments containing >2 sample groups. Error bars represent the standard deviation.
Figure 7.
Figure 7.
ROS production non-cell autonomously promotes pro-cancer processes in adjacent cells. (A) A diagram describing the mammalian cell model used to examine the impact of ROS production on transcription in adjacent cells. In this model, we co-cultured ROS-producing HEK293 cells expressing (DAAO expressing) with HEK293 cells expressing GFP in the presence of D-amino acids for 8 h. We then isolated the GFP+ cells via flow cytometry and purified mRNA for RNA-seq. All subsequent data is based on three independent biological replicates. All genes that were identified as differentially regulated display an FDR < 0.05). (B) A heat map depicting the expression ratio (ROS-coculture/control) for genes associated with the GO term innate immunity. (C) A heat map depicting the expression ratio (ROS-coculture/control) for genes known to be directly regulated by the RBPL/Notch signaling pathway. (D) A table of Gene ontology terms enriched in genes downregulated(top) or upregulated (bottom) by ROS production in adjacent cells. (E) A heat map depicting the expression ratio (ROS-coculture/control) for genes associated with the GO term extracellular matrix. (red indicates known association with cancer growth and metastasis). (F) A heat map depicting the expression ratio (ROS-coculture/control) for genes associated with the GO term transcription factor (red indicates known association with cancer growth and metastasis). (G) A heat map depicting the expression ratio (ROS-coculture/control) for genes associated with the GO term small cell lung cancer. (H) A model summarizing the transcriptional changes we observed in cells co-cultured adjacent to ROS-producing cells. Student’s t test was used for all pairwise comparisons, and one-way ANOVA was used for all experiments containing >2 sample groups. Error bars represent the standard deviation.

Similar articles

References

    1. Al-Alem, L.F., McCord L.A., Southard R.C., Kilgore M.W., and Curry T.E. Jr.. 2013. Activation of the PKC pathway stimulates ovarian cancer cell proliferation, migration, and expression of MMP7 and MMP10. Biol. Reprod. 89:73. 10.1095/biolreprod.112.102327 - DOI - PMC - PubMed
    1. Alfadda, A.A., and Sallam R.M.. 2012. Reactive oxygen species in health and disease. J. Biomed. Biotechnol. 2012:936486. 10.1155/2012/936486 - DOI - PMC - PubMed
    1. Assa-Kunik, E., Torres I.L., Schejter E.D., Johnston D.S., and Shilo B.Z.. 2007. Drosophila follicle cells are patterned by multiple levels of Notch signaling and antagonism between the Notch and JAK/STAT pathways. Development. 134:1161–1169. 10.1242/dev.02800 - DOI - PubMed
    1. Aytes, A., Mitrofanova A., Kinkade C.W., Lefebvre C., Lei M., Phelan V., LeKaye H.C., Koutcher J.A., Cardiff R.D., Califano A., et al. . 2013. ETV4 promotes metastasis in response to activation of PI3-kinase and Ras signaling in a mouse model of advanced prostate cancer. Proc. Natl. Acad. Sci. USA. 110:E3506–E3515. 10.1073/pnas.1303558110 - DOI - PMC - PubMed
    1. Ban, Y., Tan P., Cai J., Li J., Hu M., Zhou Y., Mei Y., Tan Y., Li X., Zeng Z., et al. . 2020. LNCAROD is stabilized by m6A methylation and promotes cancer progression via forming a ternary complex with HSPA1A and YBX1 in head and neck squamous cell carcinoma. Mol. Oncol. 14:1282–1296. 10.1002/1878-0261.12676 - DOI - PMC - PubMed

LinkOut - more resources