. 2024 Nov 4;65(13):23.
doi: 10.1167/iovs.65.13.23.

Genetic and Cellular Basis of Impaired Phagocytosis and Photoreceptor Degeneration in CLN3 Disease

Affiliations

Genetic and Cellular Basis of Impaired Phagocytosis and Photoreceptor Degeneration in CLN3 Disease

Jimin Han et al. Invest Ophthalmol Vis Sci. .

Abstract

Purpose: CLN3 Batten disease (also known as juvenile neuronal ceroid lipofuscinosis) is a lysosomal storage disorder that typically initiates with retinal degeneration but is followed by seizure onset, motor decline and premature death. Patient-derived CLN3 disease induced pluripotent stem cell-RPE cells show defective phagocytosis of photoreceptor outer segment (POS). Because modifier genes are implicated in CLN3 disease, our goal here was to investigate a direct link between CLN3 mutation and POS phagocytosis defect.

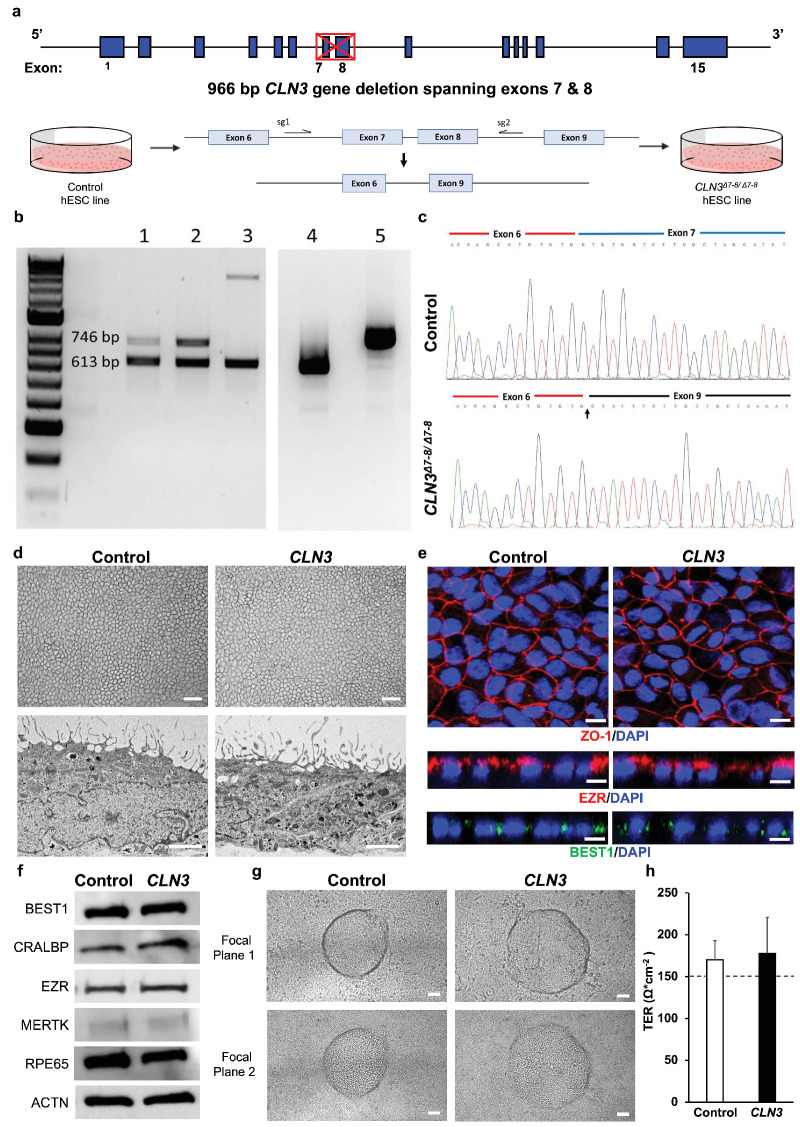
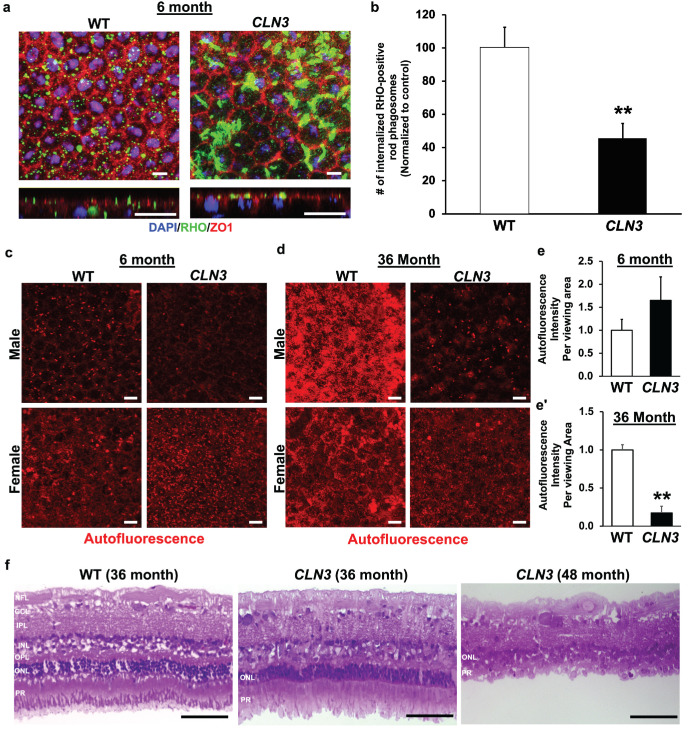
Methods: Isogenic control and CLN3 mutant stem cell lines were generated by CRISPR-Cas9-mediated biallelic deletion of exons 7 and 8. A transgenic CLN3Δ7-8/Δ7-8 (CLN3) Yucatan miniswine was also used to study the impact of CLN3Δ7-8/Δ7-8 mutation on POS phagocytosis. POS phagocytosis by cultured RPE cells was analyzed by Western blotting and immunohistochemistry. Electroretinogram, optical coherence tomography and histological analysis of CLN3Δ7-8/Δ7-8 and wild-type miniswine eyes were carried out at 6, 36, or 48 months of age.

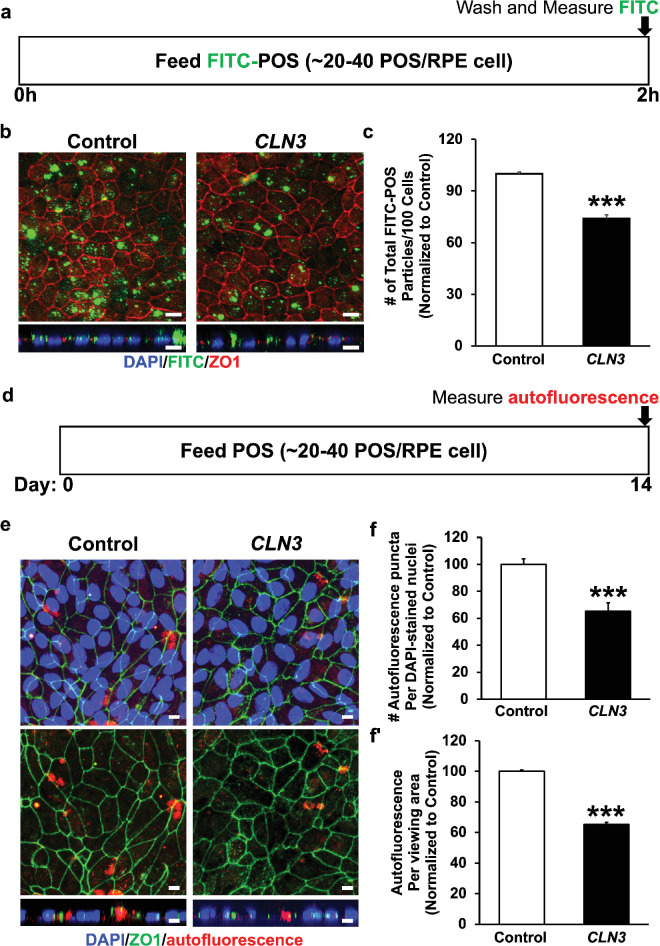
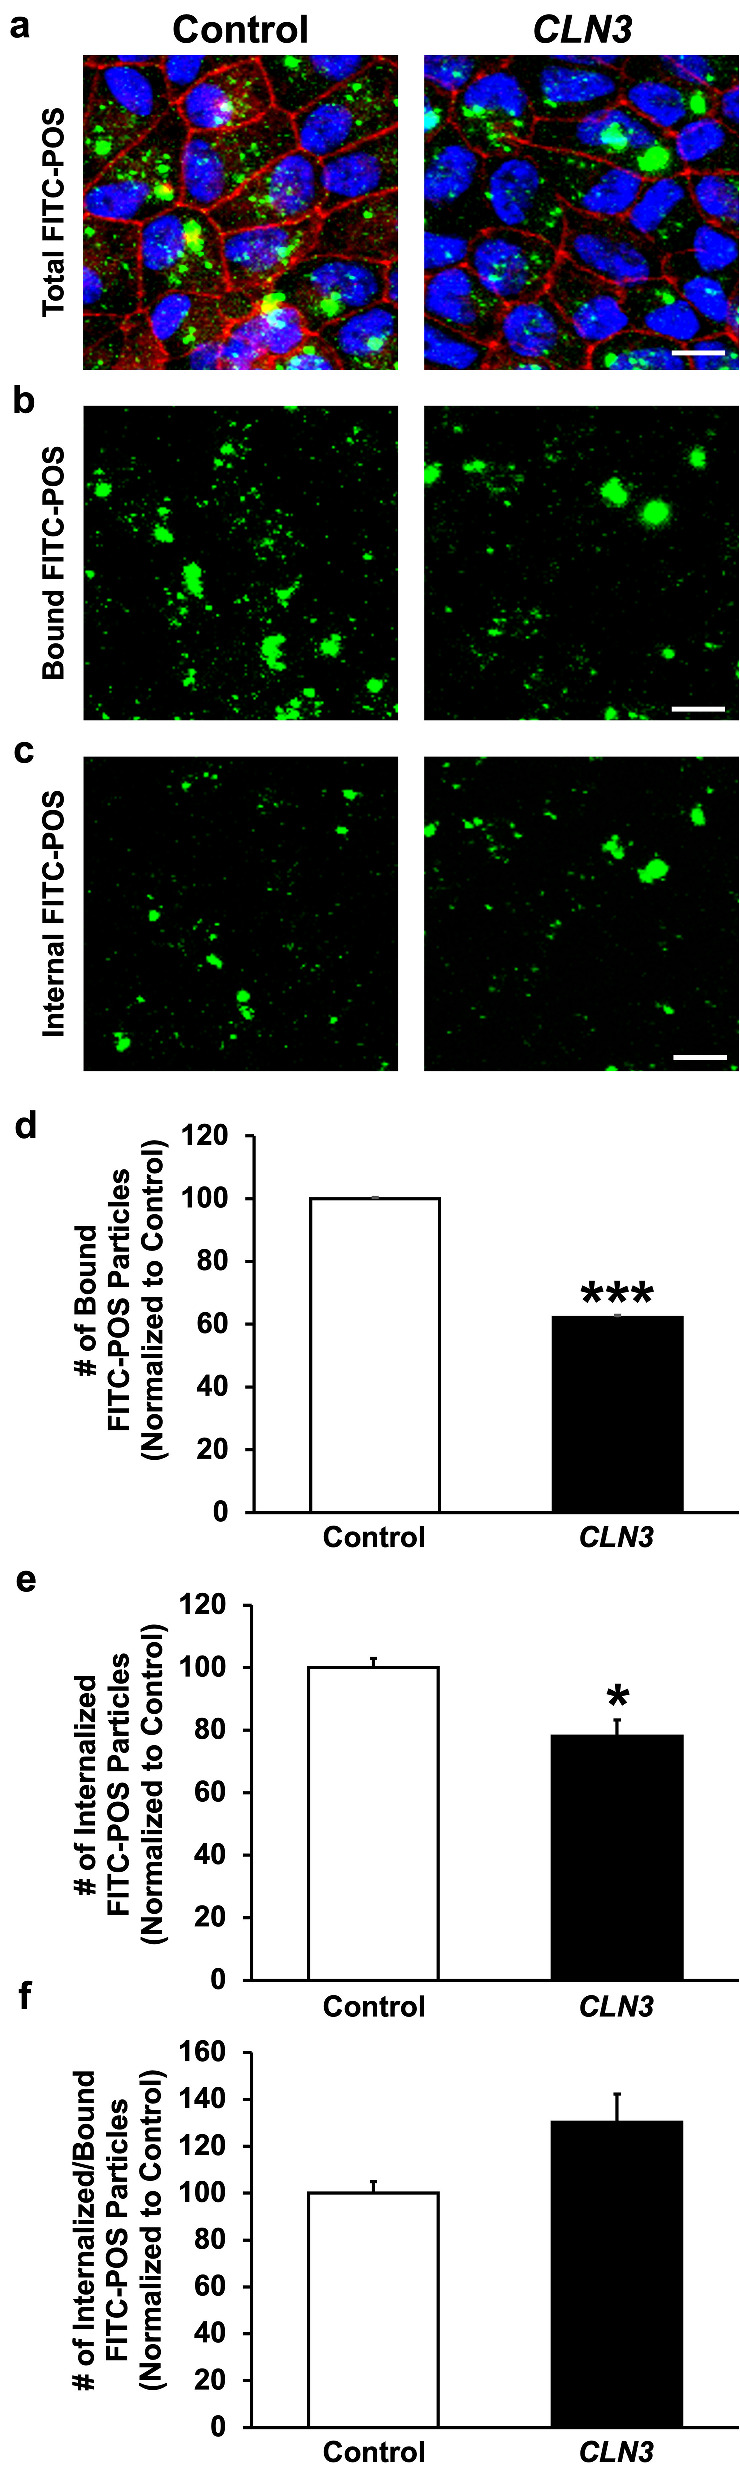
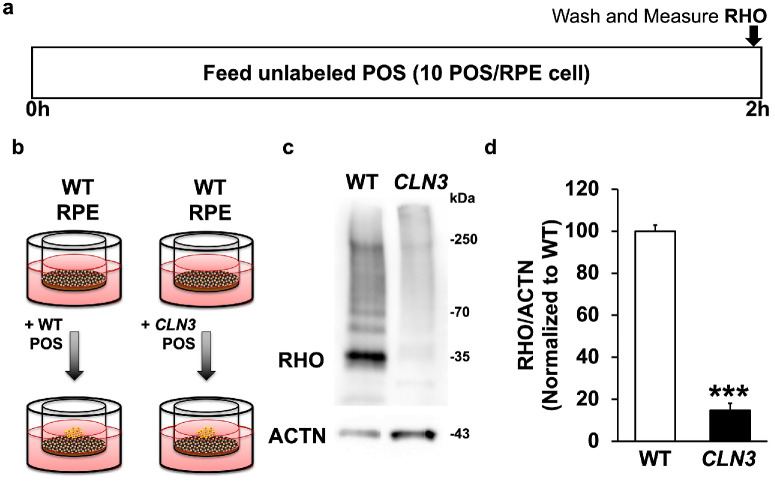
Results: CLN3Δ7-8/Δ7-8 RPE (CLN3 RPE) displayed decreased POS binding and consequently decreased uptake of POS compared with isogenic control RPE cells. Furthermore, wild-type miniswine RPE cells phagocytosed CLN3Δ7-8/Δ7-8 POS less efficiently than wild-type POS. Consistent with decreased POS phagocytosis, lipofuscin/autofluorescence was decreased in CLN3 miniswine RPE at 36 months of age and was followed by almost complete loss of photoreceptors at 48 months of age.

Conclusions: CLN3Δ7-8/Δ7-8 mutation (which affects ≤85% of patients) affects both RPE and POS and leads to photoreceptor cell loss in CLN3 disease. Furthermore, both primary RPE dysfunction and mutant POS independently contribute to impaired POS phagocytosis in CLN3 disease.


Conflict of interest statement

Disclosure: J. Han, None; S. Chear, None; J. Talbot, None; V. Swier, None; C. Booth, None; C. Reuben-Thomas, None; S. Dalvi, None; J.M. Weimer, None; A.W. Hewitt, None; A.L. Cook, None; R. Singh, None

Figures

Figure 1.
Figure 1.
Generation and characterization of isogenic control and CLN3 hESC RPE. (a) Schematic depicting CRISPR-Cas9 deletion of exons 7 and 8 of CLN3 in H9 hESC. Note the CLN3 locus and the location of dual guides to excise exons 7 and 8 from the CLN3 gene. (b) Identification of exons 7 and 8 deletion in CLN3 gene in positive clones. Genomic PCR of clones with homozygous deletion (lanes 1 and 2) and heterozygous deletion (lane 3). RT-PCR analysis of homozygous 1kb deletion clone (lane 4) and control (lane 5). (c) Sequencing alignment of cDNA for control (top) and CLN3Δ7-8/Δ7-8 (bottom) cell lines shows successful biallelic deletion of exons 7 and 8 reflected as splicing of exon 6 to exon 9 (indicated by an arrow). (d) Representative light microscopy images (top) and electron microscopy images (bottom) showing the expected RPE morphology and apical microvilli in isogenic control and CLN3Δ78/Δ78 hESC RPE (CLN3 hRPE) (scale bar, 100 µm). (e) Representative confocal microscopy images showing similar and expected localization of tight junction protein, ZO1 (red, top), RPE microvilli protein, EZR (red, middle), and basolaterally expressed RPE protein, BEST1 (green, bottom) in control and CLN3 hRPE cells. Nuclei were stained with DAPI (blue) (scale bar, 10 µm). (f) Representative Western blot images showing expected presence of RPE signature proteins and ACTN in both control and CLN3 hRPE cells. (g) Representative light microscopy images showing evidence of transepithelial fluid flux with presence of fluid domes in polarized monolayers of control and CLN3 hRPE cells. Note the presence of RPE both within the fluid dome (focal plane 1, top) and outside the fluid dome (focal plane 2, bottom) (scale bar, 50 µm). (h) TER measurements showing evidence of a tight epithelial monolayer in both control and CLN3 hRPE cultures. Note the dotted line represents the known TER threshold for RPE cells in vivo. n ≥ 3 for all experiments in Figure 1.
Figure 2.
Figure 2.
Evaluation of POS phagocytosis and RPE autofluorescence by control vs. CLN3 hRPE cells. (a) Schematic of experimental assay used to measure POS uptake by control and CLN3 hRPE cells after feeding a physiological dose of POS (approximately 20–40 POS/RPE cell) for 2 hours. (b, c) Representative confocal microscopy images (b; scale bar, 10 µm) and quantitative analyses (c) showing decreased phagocytosis of FITC-POS particles (green, b), but similar localization of tight junction protein (ZO1) in CLN3 hRPE cells compared with control hRPE cells. Nuclei were stained with DAPI (blue) (scale bar, 10 µm). ***P ≤ 0.001. (d) Schematic of experimental assay used to measure RPE autofluorescence after daily chronic POS feeding (approximately 20–40 POS/RPE cells/day) for a duration of 14 days by control and CLN3 hRPE cells after feeding a physiologic dose of POS (approximately 20–40 POS/RPE cell) for 2 hours. (e, f) Representative confocal microscopy images (e; scale bar, 10 µm) and quantitative analyses (f, f) showing decreased RPE autofluorescence (count, area) in the red channel (ex, 546 nm; em, 560–615 nm), but similar localization of tight junction protein (ZO1) in CLN3 hRPE cells fed daily with POS compared with control hRPE cells fed daily with POS. Nuclei were stained with DAPI (blue) (scale bar, 10 μm). ***P ≤ 0.001. n ≥ 3 for all experiments in Figure 2.
Figure 3.
Figure 3.
Evaluation of POS binding vs. internalization by control vs. CLN3 hRPE cells. (ac) Representative confocal images of FITC-POS fed (2 hours) RPE monolayers showing decreased number of total FITC-POS particles (a), apical FITC-POS compared with ZO1 (consistent with reduced FITC-POS binding) (b), and basal FITC-POS compared with ZO1 (consistent with reduced FITC-POS internalization) (c) in CLN3 hRPE cells compared with control hRPE cells. Note that a published protocol (PMID: 29456184) that used the position of ZO-1 relative to FITC-POS to estimate bound vs. internalized POS was used in these experiments (scale bar, 10 µm). (df) Quantitative analyses showing decreased number of both bound FITC-POS (d) and internalized FITC-POS (e) in CLN3 hRPE cells compared with control hRPE cells. Consistent with a POS binding defect, the number of internalized FITC-POS relative to number of bound FITC-POS was unchanged between control and CLN3 hRPE cells (f). *P ≤ 0.05, ***P ≤ 0.001. n ≥ 3 for all experiments in Figure 3.
Figure 4.
Figure 4.
Evaluation of POS uptake of WT vs. CLN3 POS by RPE cells. (a, b) Schematic of experimental assay used to measure POS phagocytosis by WT primary miniswine RPE after feeding of WT miniswine POS vs. CLN3 pig POS for 2 hours. (c, d) Representative Western blot image (c) and quantification (d) showing decreased phagocytosis of CLN3 miniswine POS by WT miniswine RPE compared with WT miniswine POS by WT miniswine RPE. ***P ≤ 0.001. n ≥ 3 for Figure 4 experiment.
Figure 5.
Figure 5.
Longitudinal comparison of RPE autofluorescence levels and retina histology in CLN3 miniswine eye. (a, b) Representative confocal microscopy images in the planar view (a, top) and orthogonal (yz) view (a, bottom) and corresponding quantification (b) showing decreased number of RHO-positive rod phagosomes in CLN3 miniswine RPE flatmounts compared with WT miniswine RPE flatmounts at 6 months of age. Scale bar, 10 µm. **P ≤ 0.01. (ce). Representative confocal images (c, d) and quantitative analyses (e, e) showing similar levels of autofluorescence accumulation in RPE of WT and CLN3 miniswine at 6 months of age. In contrast, decreased autofluorescence accumulation was observed in CLN3 miniswine RPE compared with WT miniswine RPE at 36 months of age. Scale bar, 10 µm. **P ≤ 0.01. (f) Representative light microscopy images of WT retina sections (36 months) and CLN3 miniswine retina sections at 36 and 48 months of age showing the presence of POS in CLN3 miniswine retina at 36 months of age, but absence of POS with significant loss of the photoreceptor cell nuclei/ONL at 48 months of age. The retina laminae are labeled in WT retina image. GCL, ganglion cell layer; INL, inner nuclear layer; IPL, inner plexiform layer; NFL, nerve fiber layer; OPL, outer plexiform layer; PR, photoreceptors. Scale bar, 100 µm. n  ≥  3 for all experiments in Figure 5.

Update of

References

    1. Haltia M, Goebel HH.. The neuronal ceroid-lipofuscinoses: a historical introduction. Biochim Biophys Acta. 2013; 1832(11): 1795–1800. - PubMed
    1. Anderson GW, Goebel HH, Simonati A.. Human pathology in NCL. Biochim Biophys Acta. 2013; 1832(11): 1807–1826. - PubMed
    1. Mole SE, Williams RE, Goebel HH.. Correlations between genotype, ultrastructural morphology and clinical phenotype in the neuronal ceroid lipofuscinoses. Neurogenetics. 2005; 6(3): 107–126. - PubMed
    1. Lebrun AH, Moll-Khosrawi P, Pohl S, et al. .. Analysis of potential biomarkers and modifier genes affecting the clinical course of CLN3 disease. Mol Med. 2011; 17(11–12): 1253–1261. - PMC - PubMed
    1. Sakti DH, Cornish EE, Fraser CL, et al. .. Early recognition of CLN3 disease facilitated by visual electrophysiology and multimodal imaging. Doc Ophthalmol. 2023; 146(3): 241–256. - PMC - PubMed

MeSH terms

LinkOut - more resources