. 2024 Dec 23;197(1):kiae613.
doi: 10.1093/plphys/kiae613.

MID1-COMPLEMENTING ACTIVITY regulates cell proliferation and development via Ca2+ signaling in Marchantia polymorpha

Affiliations

MID1-COMPLEMENTING ACTIVITY regulates cell proliferation and development via Ca2+ signaling in Marchantia polymorpha

Megumi Iwano et al. Plant Physiol. .

Abstract

MID1-COMPLEMENTING ACTIVITY (MCA) is a land plant-specific, plasma membrane protein, and Ca2+ signaling component that responds to exogenous mechanical stimuli, such as touch, gravity, and hypotonic-osmotic stress, in various plant species. MCA is essential for cell proliferation and differentiation during growth and development in rice (Oryza sativa) and maize (Zea mays). However, the mechanism by which MCA mediates cell proliferation and differentiation via Ca2+ signaling remains unknown. Here, we address this question using the liverwort Marchantia polymorpha. We show that the M. polymorpha MCA ortholog, MpMCA, is highly expressed in actively dividing regions, such as apical notches in the thalli and developing gametangiophores, and that MpMCA is a plasma membrane protein. In vivo, Ca2+ imaging using a Ca2+ sensor (yellow cameleon) revealed that MpMCA is required for maintaining proper [Ca2+]cyt levels in the apical notch region, egg cells, and antheridium cells. Mpmca mutant plants showed severe cell proliferation and differentiation defects in the thalli, gametangiophores, and gametangia, resulting in abnormal development and unsuccessful fertilization. Furthermore, expression of the Arabidopsis MCA1 gene complemented most of the defects in the growth and development of the Mpmca mutant plants. Our findings indicate that MpMCA is an evolutionarily conserved Ca2+-signaling component that regulates cell proliferation and development across the life cycle of land plants.


Conflict of interest statement

Conflict of interest statement. None declared.

Figures

Figure 1.
Figure 1.
Domain structure of MpMCA protein and expression of MpMCA. A) Schematics of MpMCA protein. A ruler indicates the amino acid (aa) length. An transmembrane (pink), EF-hand like (yellow), a coiled-coil (sky blue), and PLAC8 (green) domains are indicated as each colored rectangle. The target position for two gRNAs is indicated by blue arrowheads. B) Sequence alignment of MpMCA, AtMCA1, and AtMCA2. Identical and conservative amino acid residues are shaded in black and grey, respectively. A transmembrane, EF-hand like, a coiled-coil, and PLAC8 domains are shaded in pink, yellow, sky blue, and green, respectively. Red box and blue box indicate the target position for gRNAI and gRNAII, respectively. C)  proMpMCA:GUS transgenic lines stained by X-Gluc solution (a–j) and proMpMCA:Citrine-NLS line (k). (a–c) Thallus grown for 7 (a), 14 (b), and 21 d (c) under a white light condition. When female and male thalli were irradiated with FR, archegoniophore (d) and antheridiophore (f), respectively, were emerged at the thallus edge. Strong GUS staining was detected in the archegonial (e) and antheridial (f) disks. Cross sections of the disks show archegonia (h) and antheridia (i). In h and i, egg cells and antheridia are indicated by white and black arrow heads, respectively. Strong GUS staining or Citrine fluorescence were observed in the antheridia dissected from the antheridial disks of proMpMCA:GUS (j) or proMpMCA:Citrine-NLS (k), respectively. Similar results were reproducibly observed. Scale bars in j and k are 100 μm.
Figure 2.
Figure 2.
Distribution of [Ca2+]cyt in gemmalings and gametangia of wild type, Mpmca mutant and complementary lines expressing proMpMCA:YC3.60. A) Schematic representation of Forster resonance energy transfer (FRET)-based Ca2+ sensor, yellow cameleon 3.60 (YC3.60). Calmodulin (CaM) and the M13 peptide are bracketed by a FRET pair, CFP, and cpVenus. Calcium binding to calmodulin increases emission from the FRET acceptor. B) CFP and FRET images excited with 430 nm and ratio (FRET/CFP) image of wild type, two alleles Mpmca mutant, and MpMCAcomp in 3-d-old gemmalings. Scale bars = 50 µm. C) Ratio at the notch region of wild type, Mpmca, and MpMCAcomp. The intensity of the region of the interest (ROI) (white circles) of CFP and FRET images was measured and the ratio (FRET/CFP) was calculated, respectively. Letters represent significant difference by one-way ANOVA and Tukey's multiple comparison test (P < 0.001). The data were expressed as mean ± SD. (n = 8). D) Bright-field, cpVenus image excited with 488 nm light, CFP and FRET images excited with 430 nm and ratio image of wild-type archegonia expressing proMpMCA:YC3.60. Scale bars = 100 µm. E–H) Ratio images of wild-type, Mpmca, and MpMCAcomp and quantitative analysis of ratio in egg cells E) and antheridia G). Letters indicate significant difference by one-way ANOVA and Tukey's multiple comparison test (P < 0.001). The data were expressed as mean ± SD. (F, n = 28∼40; H, n = 7∼25) Scale bars = 100 µm.
Figure 3.
Figure 3.
[Ca2+]cyt change and the rhizoid precursor cells of wild-type and Mpmca mutants expressing proEF:YC3.60.  A,B) [Ca2+]cyt changes during just after gemma hydration to germination. The upper images are the ratio images (FRET/CFP) in wild type (A) and Mpmca (B) lines, respectively. The left panel shows ratio changes of the ROI (a white circle in A1 or B1) at a notch region. The right panel shows the intensity of CFP and FRET of the ROI (a white circle in A1 or B1). Numbers in the left panel correspond to each image number of A or B. C) Comparison between wild-type and Mpmca ratios at 1 h or 15 h after hydration, respectively (n = 5). Letters indicate significant difference by ordinary one-way ANOVA and Tukey's multiple comparison test (P < 0.01). D,E) BF, FRET, CFP, and ratio images of the surface of gemmae at 1 h after hydration D) and the number of the rhizoid precursor cells E). Arrowheads show the rhizoid precursor cells. Asterisks indicate significant difference compared with Mpmca by Student's two-tailed unpaired t-test (****; P < 0.0001). Scales bars = 100 µm.
Figure 4.
Figure 4.
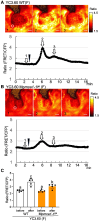
[Ca2+]cyt change induced by osmotic stress at the notch of wild-type and Mpmca mutants expressing proEF:YC3.60.  A,B) [Ca2+]cyt changes before and after the addition of mannitol solution. 8-d-old gemmaling was mounted on the glass-bottomed dish and covered with a small amount of 1/2 Gamborg's medium. For giving osmotic stress, 1/2 Gamborg's medium containing 0.4 m mannitol solution was added to the dish to a final concentration of 200 mm. Arrowheads show timing when mannitol solution was added. The upper images are the ratio images (FRET/CFP) in wild-type (A) and Mpmca (B) lines, respectively. The under panel shows ratio changes of the ROI (a white circle in A1 or B1) at a notch region. The data were collected every 6 s for 18 min. Scales bars = 100 µm. C) Comparison between wild-type and Mpmca ratios before or the maximum value after the addition of mannitol solution, respectively. Letters indicate significant difference by ordinary one-way ANOVA and Tukey's multiple comparison test (P < 0.01). The data were expressed as mean ± SD (n = 5).
Figure 5.
Figure 5.
Phenotype in the vegetative growth of wild-type, Mpmca, and the complemented lines, Mpmca expressing MpMCAcomplement (MpMCAcomp) or AtMCA1 (AtMCA1). A) Growth and development of thalli. 4-wk-old thallus female (a–d) and male (e, f) grown on 1/2 Gamborg's medium containing 10% sugar under continuous white light. WT(F) and WT(M) are wild-type accessions, Tak-2 and Tak-1, respectively. Scale bars = 1 cm. B,C) Fresh weight in 4-wk-old thallus of female or male lines (B, n = 4; C, n = 5). Asterisks indicate significant difference compared with Mpmca by Student's two-tailed unpaired t-test (*; P < 0.05, **; P < 0.01, ****; P < 0.0001). Bars represent mean ± SD. D,E). Analysis of cell proliferation in apical notch region of gemmalings in wild-type, Mpmca, and MpMCAcomp male lines. D) EdU incorporated cells (green) in 3-d-old (upper panels) and 7-d-old (lower panels) gemmalings after incorporation of EdU for 4 h. Arrowheads show the notch. Scale bars = 100 μm. E) The number of EdU-incorporated cells per single notch in 3-d-old gemmalings (n = 10). Whiskers, maximum, and minimum values; box limits, upper, and lower quartiles; center line, median. F) MpMCA-expressed cells (green) visualized in proMpMCA:Citrine-NLS (a) in 3-d-old gemmalings. Magenta signal in (b) shows chlorophyll autofluorescence. Scale bars = 100 μm. G) Relative expression level of MpCYCD;1 determined by qRT-PCR of 3-d-old gemmalings (n = 3). Letters in (E) and (G) indicate significant difference compared with Mpmca by one-way ANOVA and Dunnett's multiple comparison test (P < 0.01). Bars represent mean ± SD. H) TEM image of the apical notch in wild-type (a, c, d) and Mpmca (b) dormant gemmae and wild-type developing gemmae (c, d) on the stalk in the cup. The stage of (c) is earlier than that of (d). Arrowheads show lipid bodies. Each inset shows a magnified image of a black square. Brackets in the inset show the primary wall. Middle lamella (m). Scale bars = 2 µm. Scale bars in insets = 0.5 µm. I) Localization of MpMCAcomp_mNeonGreen (arrowheads) in the plasma membrane of apical notch in gemmae of Mpmca-1ge(F) expressing proMpMCA:MpMCAcomp_mNeonGreen (a). Magenta signal in (b) shows chlorophyll autofluorescence. (c) shows an overlapping image of (a) and (b). White dotted line in shows the edge of apical notch. Scale bars = 20 μm.
Figure 6.
Figure 6.
Phenotype in the reproductive phase of wild-type, Mpmca, and the complemented lines, Mpmca expressing MpMCAcomplement (MpMCAcomp) or AtMCA1 (AtMCA1). A) Archegoniophore formation and morphological analysis in female plants at 1 mo after FR irradiation (a–d), archegoniophore formation (e–h), wild-type (e, f) and Mpmca (g, h) archegonia observed with LM (e, g), and TEM (f, h). In Mpmca, distortion in the egg cell and in the cells surrounding egg cell (arrows in h) was observed. (i–l). Sporophyte formation when crossed with wild-type sperms. B) Antheridiophore formation (a–d) and morphological analysis in male plants at 1 mo after FR irradiation. Antheridiophore (e–h) and sperm cells stained with DAPI (i–k). Cross section of antheridia of wild type (l, m, p, and q) and Mpmca (n, o, r, and s) observed with LM (l–o) and TEM (p–s). Nucleus (N), vacuole (V), and plastids (P). C,D) Time-course analysis of archegonia and antheridiophore formation after FR irradiation. Bars represent mean ± SD from five independent experiments. E) Scheme of antheridiophore formation and cutting position (red line) for LM and TEM observation. F) Vertical cross section to midrib in notch region of thallus at 5 d after FR irradiation. Tissue and cell structure were observed with LM (a–d) and TEM (e, f). Cell clump (arrows) observed at one side of notch region of wild type. Square regions (c, d) in b were magnified in c and d, respectively. G) Cross section of immature wild-type antheridiophore at 7 d after FR irradiation observed with FE-SEM. (a) A panorama (composite) image of immature antheridia (arrowheads) consisting of 35 images. (b) A higher magnification of immature antheridia. Arrowheads show immature antheridium. Square region in b was magnified in c and d, respectively. Plastids (P), nucleus (N), and mitochondria (M).

References

    1. Althoff F, Kopischke S, Zobell O, Ide K, Ishizaki K, Kohchi T, Zachgo S. Comparison of the MpEF1α and CaMV35 promoters for application in Marchantia polymorpha overexpression studies. Transgenic Res. 2014:23(2):235–244. 10.1007/s11248-013-9746-z - DOI - PubMed
    1. Aubert Y, Vile D, Pervent M, Aldon D, Ranty B, Simonneau T, Vavasseur A, Galaud JP. RD20, a stress-inducible caleosin, participates in stomatal control, transpiration and drought tolerance in Arabidopsis thaliana. Plant Cell Physiol. 2010:51(12):1975–1987. 10.1093/pcp/pcq155 - DOI - PubMed
    1. Berridge MJ, Lipp P, Bootman MD. The versatility and universality of calcium signalling. Nat Rev Mol Cell Biol. 2000:1(1):11–21. 10.1038/35036035 - DOI - PubMed
    1. Bowman JL, Arteaga-Vazquez M, Berger F, Briginshaw LN, Carella P, Aguilar-Cruz A, Davies KM, Dierschke T, Dolan L, Dorantes-Acosta AE, et al. The renaissance and enlightenment of Marchantia as a model system. Plant Cell. 2022:34(10):3512–3542. 10.1093/plcell/koac219 - DOI - PMC - PubMed
    1. Chen J, Gutjahr C, Bleckmann A, Dresselhaus T. Calcium signaling during reproduction and biotrophic fungal interactions in plants. Mol Plant. 2015:8(4):595–611. 10.1016/j.molp.2015.01.023 - DOI - PubMed