. 2024 Dec 1;35(12):br26.
doi: 10.1091/mbc.E24-09-0420. Epub 2024 Nov 13.

Calcium dynamics of skin-resident macrophages during homeostasis and tissue injury

Affiliations

Calcium dynamics of skin-resident macrophages during homeostasis and tissue injury

Pearl A Leon Guerrero et al. Mol Biol Cell. .

Abstract

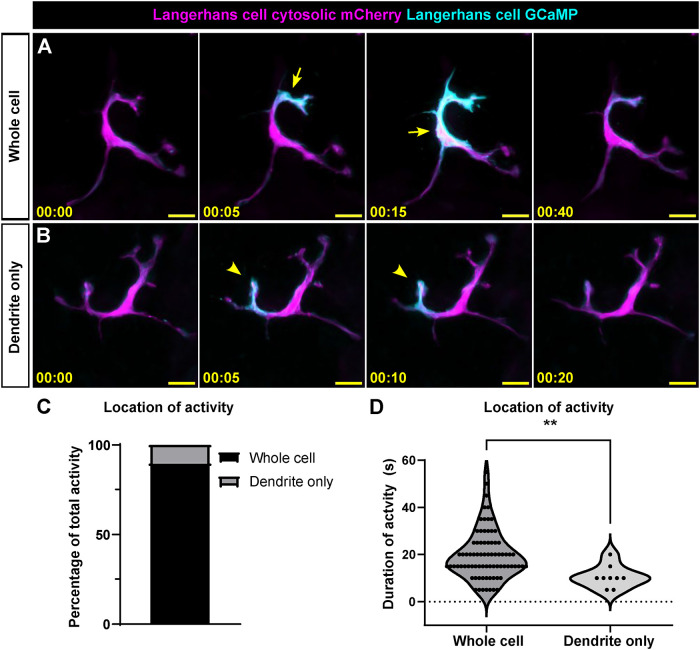
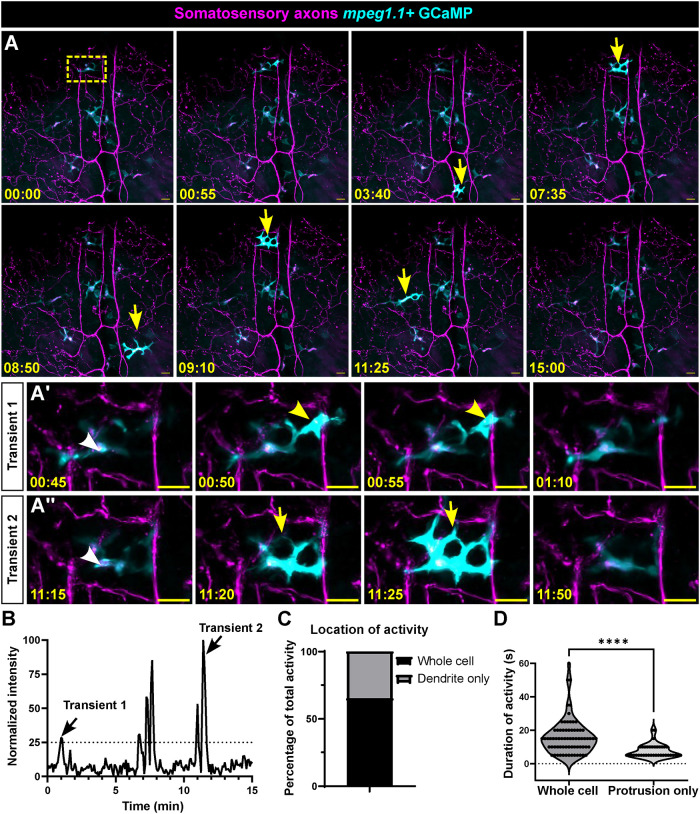
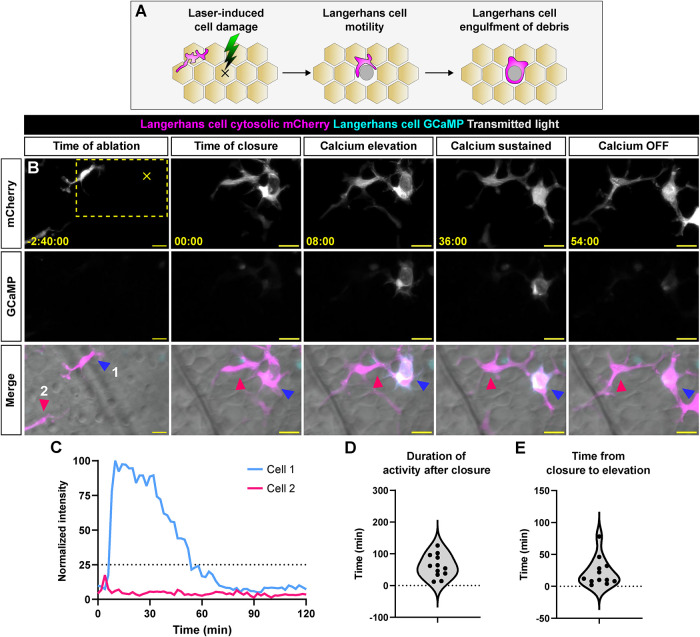
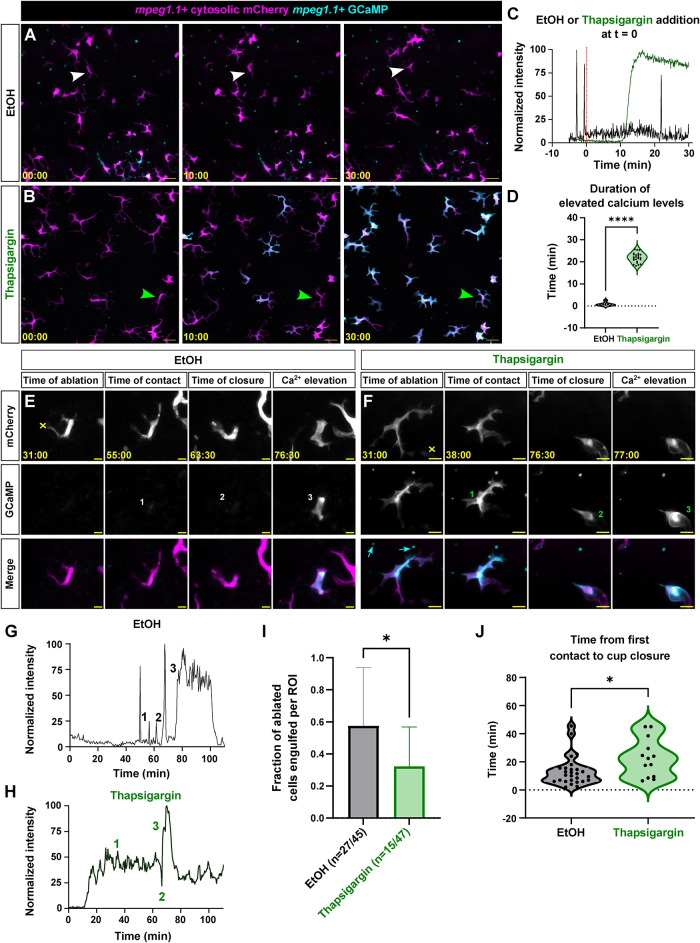
Immune cells depend on rapid changes in intracellular calcium activity to modulate cell function. Skin contains diverse immune cell types and is critically dependent on calcium signaling for homeostasis and repair, yet the dynamics and functions of calcium in skin immune cells remain poorly understood. Here, we characterize calcium activity in Langerhans cells, skin-resident macrophages responsible for surveillance and clearance of cellular debris after tissue damage. Langerhans cells reside in the epidermis and extend dynamic dendrites in close proximity to adjacent keratinocytes and somatosensory peripheral axons. We find that homeostatic Langerhans cells exhibit spontaneous and transient changes in calcium activity, with calcium flux occurring primarily in the cell body and rarely in the dendrites. Triggering somatosensory axon degeneration increases the frequency of calcium activity in Langerhans cell dendrites. By contrast, we show that Langerhans cells exhibit a sustained increase in intracellular calcium following engulfment of damaged keratinocytes. Altering intracellular calcium activity leads to a decrease in engulfment efficiency of keratinocyte debris. Our findings demonstrate that Langerhans cells exhibit context-specific changes in calcium activity and highlight the utility of skin as an accessible model for imaging calcium dynamics in tissue-resident macrophages.


Figures

FIGURE 1:
FIGURE 1:
Langerhans cells elevate calcium levels frequently and transiently. (A) Schematic of in vivo imaging paradigm. (B) Confocal micrograph from in vivo time lapse imaging showing Tg(mpeg1.1:mCherry;mpeg1.1:GCaMP6s-CAAX)+ Langerhans cells. Yellow box denotes the ROI magnified in C. (C) Inset still images showing Tg(mpeg1.1:mCherry;mpeg1.1:GCaMP6s-CAAX)+ Langerhans cell exhibiting increase in calcium activity. (D) Schematic of ex vivo imaging paradigm. (E) Confocal micrograph from in vivo time lapse imaging showing Tg(mpeg1.1:mCherry;mpeg1.1:GCaMP6s-CAAX)+ Langerhans cells. (F) Confocal micrographs from in vivo time lapse imaging showing Tg(mpeg1.1:mCherry;mpeg1.1:GCaMP6s-CAAX)+ Langerhans cells exhibiting changes in calcium levels. Yellow arrows indicate cells exhibiting increases in calcium levels. Yellow box denotes the ROI magnified in H. (G) GCaMP temporal color coding of the 15-min time lapse session from F, indicating that multiple Langerhans cells exhibited increases in calcium activity. (H) Still images showing a Tg(mpeg1.1:mCherry;mpeg1.1:GCaMP6s-CAAX)+ Langerhans cell exhibiting an increase in calcium activity. (I) Normalized intensity plot of GCaMP signal in Langerhans cell shown in H. A minimum threshold of 25% normalized intensity (dashed line) was used to score cells as positive for activity (see Materials and Methods). (J) Boxplot of the percentage of cells exhibiting calcium flux during the 15-min imaging window, n = 13 ROIs tracked from N = 3 fish. (K) Violin plot showing the number of calcium elevations an individual cell produced within the 15-min imaging window, n = 33 cells tracked from N = 13 ROIs. (L) Violin plot showing the duration of elevated calcium levels, n = 87 active cells tracked from N = 13 ROIs. (M) Scatter plot of correlation of time when cells exhibited increases in calcium levels versus distance from other Langerhans cells, n = 52 correlation plots tracked from N = 9 ROIs. Time stamps denote mm:ss. Scale bars: 20 µm (B, E, F, G, H), 10 µm (C).
FIGURE 2:
FIGURE 2:
Spatial heterogeneity of calcium activity in Langerhans cells. (A and B) Confocal micrographs from time lapse imaging showing a Tg(mpeg1.1:mCherry;mpeg1.1:GCaMP6s-CAAX)+ Langerhans cell exhibiting calcium activity in the whole cell (A), or the dendrite only (B). Arrows in A point to whole-cell activity, arrowheads in B point to dendrite-only activity. (C) Quantification of the percentage of calcium activity occurring in the whole cell or dendrite only, n = 88 cells tracked from 13 ROIs from N = 3 fish. (D) Violin plots showing the duration of elevated calcium in the whole cells and dendrites, n = 87 calcium elevation events tracked from N = 34 cells. Mann–Whitney U test was used to determine significance in D, ** = p < 0.01. Time stamps denote mm:ss. Scale bars: 20 µm (A, B).
FIGURE 3:
FIGURE 3:
Location, not duration, of calcium activity in Langerhans cells is altered during axon degeneration. (A) Confocal micrographs from time lapse imaging showing Tg(p2rx3a:mCherry)+ axons degenerating and Tg(mpeg1.1:GCaMP6s-CAAX)+ Langerhans cells engulfing debris and exhibiting changes in calcium levels. Yellow box in first frame denotes insets in A’, A’’. White arrowheads in A’, A’’ indicate engulfed axonal debris. Yellow arrows indicate whole-cell activity, yellow arrowheads indicate dendrite-only activity. (B) Intensity plot of GCaMP signal in Langerhans cell from panels A’, A’’. (C) Quantification of the percentage of calcium activity occurring in the whole cell or dendrite only, n = 109 calcium elevation events tracked from N = 26 cells. (D) Violin plots showing the duration of elevated calcium in the whole cells and dendrites, n = 109 calcium elevation events tracked from N = 26 cells. Mann–Whitney U test was used to determine significance in D, **** = p < 0.0001. Timestamps denote mm:ss. Scale bars: 20 µm (A, A’, A’’).
FIGURE 4:
FIGURE 4:
Langerhans cells exhibit elevated and sustained calcium levels after engulfment of keratinocyte debris. (A) Schematic depicting laser-induced cell damage and subsequent engulfment of debris by Langerhans cell. (B) Confocal micrographs from time lapse imaging showing Tg(mpeg1.1:mCherry;mpeg1.1:GCaMP6s-CAAX)+ Langerhans cell engulfing debris after laser ablation of nearby keratinocyte. Yellow dotted box indicates insets used in panels (00:00 to 54:00). Yellow X indicates the site of laser ablation. Blue and pink arrowheads indicate cells tracked in C. (C) Intensity plot of GCaMP signal in Langerhans cell from panel B. (D) Violin plot showing the length of time from phagocytic cup closure to 25% GCaMP signal, n = 12 cells tracked from N = 7 scales. (E) Violin plot showing the duration of >25% GCaMP signal, n = 12 cells tracked from N = 7 scales. Timestamps denote mm:ss. Scale bars: 20 µm (B).
FIGURE 5:
FIGURE 5:
Thapsigargin-treated Langerhans cells show decreased engulfment efficiency of large debris. (A and B) Confocal micrographs from time lapse imaging showing Tg(mpeg1.1:mCherry;mpeg1.1:GCaMP6s-CAAX)+ Langerhans cells during ethanol (EtOH) (A) or thapsigargin (B) treatment. Arrowheads indicate cells tracked in C. (C) Intensity plot of GCaMP signal in Langerhans cells from panels (A, B). (D) Violin plot showing the duration of elevated calcium levels in EtOH and thapsigargin-treated Langerhans cells, n = 7 EtOH control cells from three ROIs, n = 24 thapsigargin-treated cells from three ROIs. (E and F) Confocal micrographs from time lapse imaging showing Tg(mpeg1.1:mCherry;mpeg1.1:GCaMP6s-CAAX)+ Langerhans cell engulfing large debris during EtOH (E) or thapsigargin (F) treatment. Yellow X indicates the site of laser ablation. Numbers indicate relevant timepoints in G and H. Cyan arrows indicate autofluorescence. (G) Intensity plot of GCaMP signal in Langerhans cells from E. (H) Intensity plot of GCaMP signal in Langerhans cells from panel F. (I) Quantification showing engulfment rates in EtOH and thapsigargin-treated cells from 4 (thapsigargin) or 5 (EtOH) individual experiments. (J) Violin plots showing the amount of time from debris contact to phagocytic cup closure in EtOH and thapsigargin-treated cells, n = 27 EtOH-treated control cells from N = 5 experiments, n = 13 thapsigargin-treated cells from N = 4 individual experiments. Error bars in (I) represent standard deviation. Mann–Whitney U test was used to determine significance in D, I, and J, * = p < 0.01, **** = p < 0.0001. Timestamps denote mm:ss. Scale bars: 10 µm (E, F), 20 µm (A, B).

Update of

Similar articles

Cited by

References

    1. Aman AJ, Parichy DM (2024). Anatomy, development and regeneration of zebrafish elasmoid scales. Dev Biol 510, 1–7. - PMC - PubMed
    1. Balaji R, Bielmeier C, Harz H, Bates J, Stadler C, Hildebrand A, Classen A-K (2017). Calcium spikes, waves and oscillations in a large, patterned epithelial tissue. Sci Rep 7, 42786. - PMC - PubMed
    1. Brand A, Hovav A-H, Clausen BE (2023). Langerhans cells in the skin and oral mucosa: Brothers in arms? Eur J Immunol 53, 2149499. - PubMed
    1. Celli A, Mackenzie DS, Zhai Y, Tu C-L, Bikle DD, Holleran WM, Uchida Y, Mauro TM (2012). SERCA2-controlled Ca2+-dependent keratinocyte adhesion and differentiation is mediated via the sphingolipid pathway: A therapeutic target for Darier's disease. J Invest Dermatol 132, 1188–1195. - PMC - PubMed
    1. Celli A, Tu C-L, Lee E, Bikle DD, Mauro TM (2021). Decreased calcium-sensing receptor expression controls calcium signaling and cell-to-cell adhesion defects in aged skin. J Invest Dermatol 141, 2577–2586. - PMC - PubMed

LinkOut - more resources