. 2024 Dec 4;138(23):1537-1559.
doi: 10.1042/CS20242064.

Protective effect of mesenchymal stromal cells in diabetic nephropathy: the In vitro and In vivo role of the M-Sec-tunneling nanotubes

Affiliations

Protective effect of mesenchymal stromal cells in diabetic nephropathy: the In vitro and In vivo role of the M-Sec-tunneling nanotubes

Federica Barutta et al. Clin Sci (Lond). .

Abstract

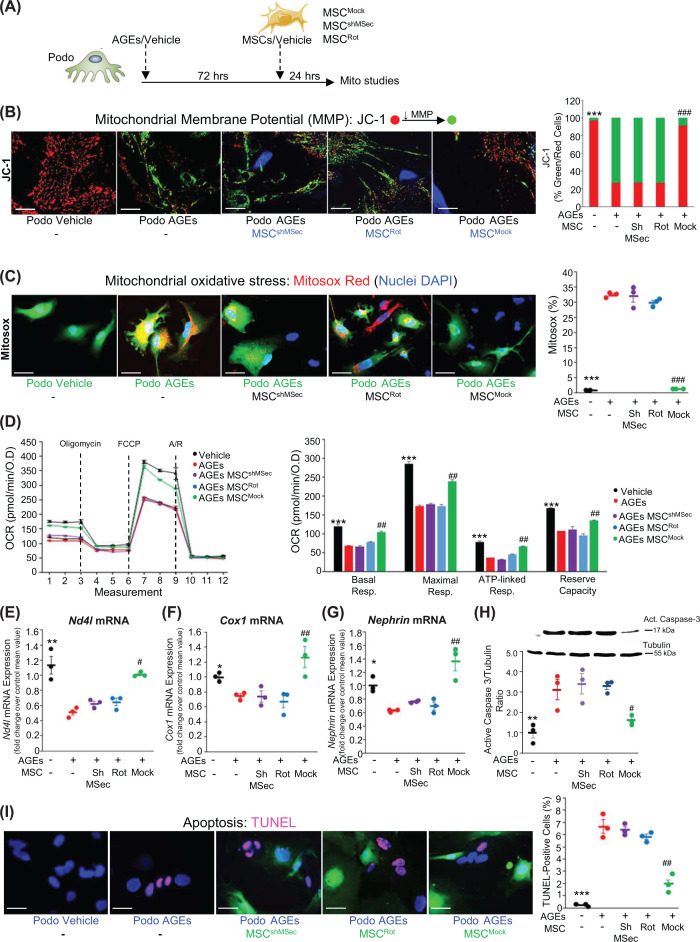
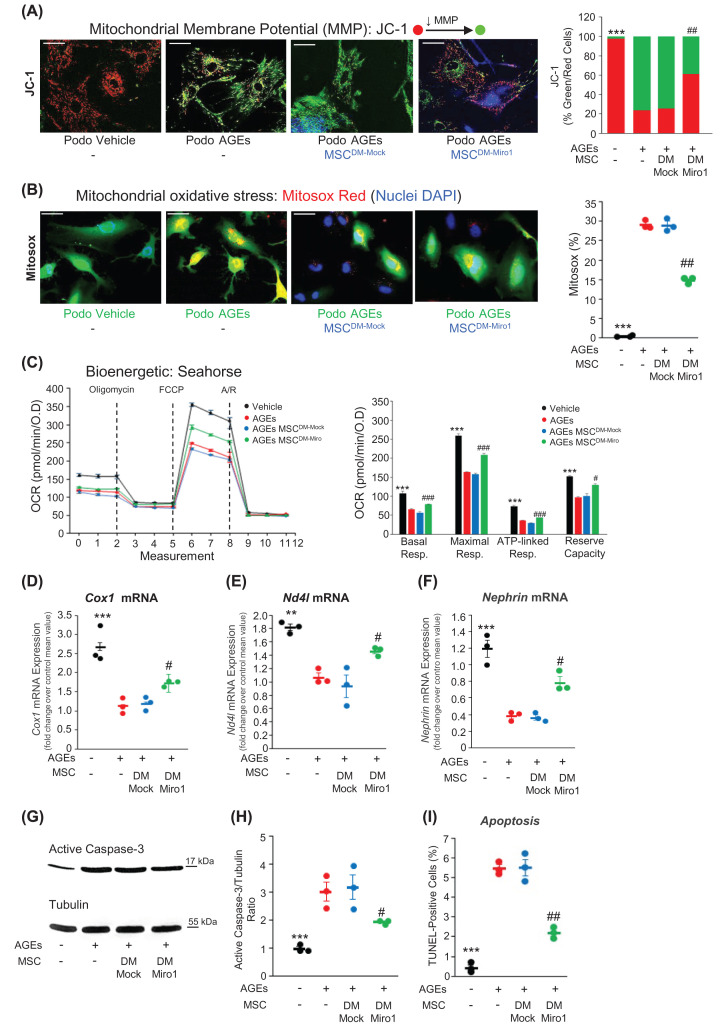
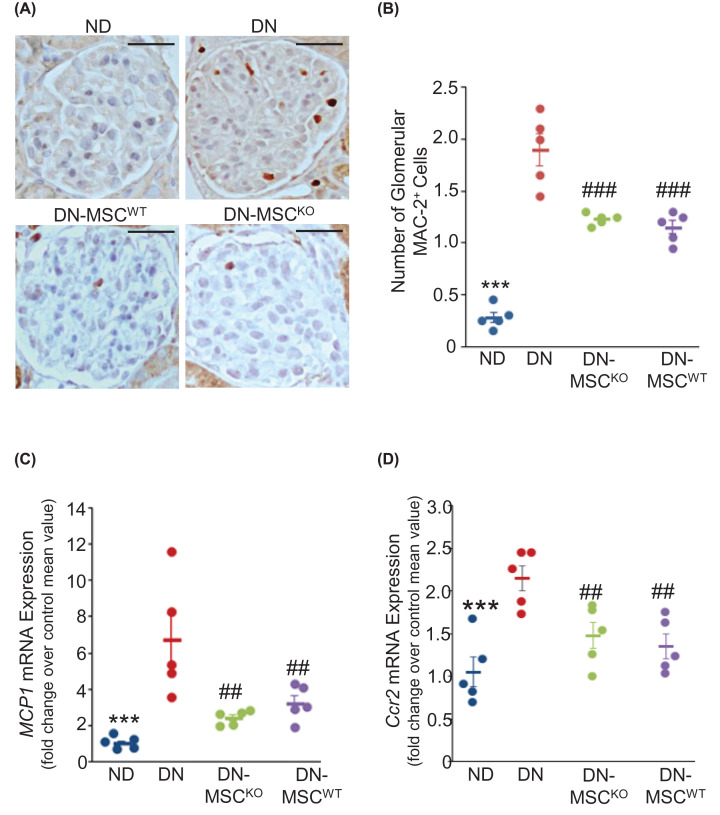
Mitochondrial dysfunction plays an important role in the development of podocyte injury in diabetic nephropathy (DN). Tunnelling nanotubes (TNTs) are long channels that connect cells and allow organelle exchange. Mesenchymal stromal cells (MSCs) can transfer mitochondria to other cells through the M-Sec-TNTs system. However, it remains unexplored whether MSCs can form heterotypic TNTs with podocytes, thereby enabling the replacement of diabetes-damaged mitochondria. In this study, we analysed TNT formation, mitochondrial transfer, and markers of cell injury in podocytes that were pre-exposed to diabetes-related insults and then co-cultured with diabetic or non-diabetic MSCs. Furthermore, to assess the in vivo relevance, we treated DN mice with exogenous MSCs, either expressing or lacking M-Sec, carrying fluorescent-tagged mitochondria. MSCs formed heterotypic TNTs with podocytes, allowing mitochondrial transfer, via a M-Sec-dependent mechanism. This ameliorated mitochondrial function, nephrin expression, and reduced apoptosis in recipient podocytes. However, MSCs isolated from diabetic mice failed to confer cytoprotection due to Miro-1 down-regulation. In experimental DN, treatment with exogenous MSCs significantly improved DN, but no benefit was observed in mice treated with MSCs lacking M-Sec. Mitochondrial transfer from exogenous MSCs to podocytes occurred in vivo in a M-Sec-dependent manner. These findings demonstrate that the M-Sec-TNT-mediated transfer of mitochondria from healthy MSCs to diabetes-injured podocytes can ameliorate podocyte damage. Moreover, M-Sec expression in exogenous MSCs is essential for providing renoprotection in vivo in experimental DN.

Keywords: albuminuria; diabetic nephropathy; mesenchymal stem cell; mitochondria; podocytes; tunneling nanotubes.


Conflict of interest statement

The Authors declares that there are no competing interests associated with the manuscript.

Figures

Figure 1
Figure 1. MSCs form heterotypic TNTs with serum-deprived podocytes
Podocytes were pre-exposed to serum deprivation (Podo-SD) for 24 hours and then co-incubated with MSCs. CellTracker Blue was used for tracking either podocytes or MSCs. Co-cultures were stained with Alexa Fluor 488 (green)-wheat germ agglutinin (WGA) to reveal cell membranes and TNTs. (A) The image shows a TNT in green (arrow) interconnecting a podocyte (blue/green) with a MSC (green). Serial Z-stack images of (A), acquired with a step-size of 0.2 µm, proved that the TNT did not adhere to the substrate as also shown in the combined depth-colour coding image of the z-stack slides where colours from red (bottom) to blue (top) represent the depth in the Z-axis. (B) Fluorescent staining for F-actin in green (Alexa Fluor 488-labelled phalloidin) showed that TNTs, bridging podocytes and CellTracker Blue-labelled MSCs, contained actin (DIC image in the insert). (C) WGA-stained (green) cocultures of podocytes and MSCs were fixed and then immunostained for nephrin (red) to identify podocytes (yellow merge). Nuclei were counterstained with DAPI. (n = 3, magnification X630, scale bar 50 µm).
Figure 2
Figure 2. MSCs form heterotypic TNTs with diabetes-injured podocytes
Podocytes labelled with CellTracker Blue were exposed to high glucose (HG), advanced glycosylated end products-bovine serum albumin (AGEs), monocyte chemoattractant protein-1 (MCP1) and then co-incubated with MSCs. Vehicles and normal glucose concentrations were used as controls. Co-cultures were stained with Alexa Fluor 488-wheat germ agglutinin (WGA-green) to stain cellular membranes and TNTs. (A,B,C) Pictures of TNTs (green), interconnecting MSCs to podocytes (blue/green) are shown in the upper left panels. Magnification X630, scale bar 50 µm. Serial Z-stack images of these pictures (step-size of 0.2/0.25 µm), proving that TNTs did not adhere to the substrate, are shown in the right panels and summarised in the depth-colour coding images, where colours from red (bottom) to blue (top) represent depth in the Z-axis (left lower panels). M-Sec protein expression was assessed by immunoblotting in (D) cultured MSCs (NC: negative control) and in (E) MSCs transfected with either M-Sec short hairpin RNA (MSCshMSec) to silence M-Sec or a mock plasmid (MSCMock) (internal control: tubulin). (F) The graph shows the percentage of podocytes connected with MSCMock and MSCshMSec via TNTs (n = 4, ***P<0.001 HG-MSCMock vs. NG-MSCMock, **P<0.01 AGE-MCP-1-MSCMock vs. vehicles, ###P<0.001 HG-AGE-MCP-1-MSCMock vs. HG-AGE-MCP-1-MSCshMSec).
Figure 3
Figure 3. TNTs transfer mitochondrial from MSCs to diabetes-injured podocytes
CellTracker Blue-labelled podocytes were pre-exposed to (A) high glucose (HG), (B) monocyte chemoattractant protein-1 (MCP-1), (C) advanced glycosylated end products-bovine serum albumin (AGEs), (D) Rotenone (Rot), and then co-cultured with MSCs carrying Red Fluorescent Protein (RFP)-labelled mitochondria. Vehicles and normal glucose (NG) concentrations were used as controls. (A–D) Live fluorescent microscopy images show red mitochondria within TNTs (white dashed lines, DIC-image in the insert) and in the cytosol of recipient blue podocytes (white arrow). Magnification X630, bar 50 µm. (E,F) The graphs show the percentage of podocytes containing MSC-derived mitochondria (dually labelled podocytes - RFP and Blue) as quantified by flow cytometry. In (E), experiments were performed using MSCs expressing M-Sec (MSCMock) or knockdown for M-Sec (MSCshMSec) (n=3, ***P<0.001 Rot-MSCMock, **P<0.01 HG/AGEs-MSCMock, and *P<0.05 MCP1-MSCMock vs. controls and MSCshMSec). In (F) experiments were performed in the presence/absence of latrunculin B (n = 3,***p<0.001 HG-AGE-MSC, **P<0.01 MCP1-MSC vs. controls and MSC-Latrunculin).
Figure 4
Figure 4. M-Sec-mediated transfer affects mitochondria in recipient diabetes-injured podocytes
(A) The diagram shows the experimental design. Podocytes were exposed to advanced glycosylated end products-bovine serum albumin (AGEs)/vehicle for 72 h, followed by incubation with MSCs/vehicle for further 24 h. MSCs were pre-treated with rotenone (MSCRot) or transfected with either M-Sec shRNA (MSCshMSec) to silence M-Sec or a mock plasmid (MSCMock). (B) Mitochondrial Membrane Potential (MMP). Transition of the fluorescent probe JC-1 from red to green fluorescence was used to detect a decline in MMP. MSCs were labelled with CellTracker Blue. Magnification 200X, scale bar: 100 nm. The graph shows quantification of red to green JC-1 fluorescence intensity in podocytes (n=3). (C) Mitochondrial oxidative stress was assessed using the superoxide probe MitoSox Red. Podocytes were stained with CellTracker Green and nuclei counterstained with DAPI. Mitochondrial oxidative stress was yellow-orange in podocytes (merge of CellTracker Green and Mitosox Red) and red in MSC pre-treated with rotenone. Magnification 200X, scale bar: 100 nm. The graph shows the percentage of red fluorescence per podocyte area (n=3). (D) Mitochondrial bioenergetics was studied in podocytes isolated from mono/co-cultures by FACS-sorting using the Cell Mito Stress Test on a SeahorseXF-24. Oxygen consumption rate (OCR) was measured under basal conditions and following addition (dashed lines) of oligomycin, FCCP (carbonyl cyanide p-trifluoromethoxyphenyl-hydrazon), and Rot/A (rotenone/antimycin A), and results normalised to total protein OD values. The graph shows basal, ATP-linked, and maximal respiration, and reserve capacity (n=3). (E) ND4L and (F) Cox1 mRNA expression was measured by real-time PCR in podocytes isolated from mono/co-cultures by FACS-sorting (housekeeping gene: GAPDH) (n=3). (G) Nephrin mRNA expression was measured by real-time PCR (housekeeping gene: GAPDH) (n=3). Apoptosis was evaluated (H) by immunoblotting for active caspase-3 expression (tubulin internal control) in FACS-sorted podocytes (n=3) and by (I) TUNEL assay. In the representative images, MSCs were labelled with CellTracker Green. Apoptotic podocytes were pink (merge of nuclei counterstained with DAPI and TUNEL red assay). The graph shows the percentage of apoptotic podocytes (n=3). ***P<0.001, **P<0.01, *P<0.05 AGEs vs. vehicle ###P<0.001, ##P<0.01, #P<0.05 AGEs-MSCMock vs. AGEs-MSCRot and AGEs-MSCShMSec
Figure 5
Figure 5. Effect of diabetes on the efficiency of MSCs as mitochondrial donors
(A) The diagram shows the experimental design. MSCs were isolated from the bone marrow of non-diabetic (MSC-ND) and diabetic (MSC-DM) mice and then incubated with podocytes pre-exposed to advanced glycosylated end products-bovine serum albumin (AGEs)/vehicle. In selected experiments, MSC-DM were transfected with an adenovirus to overexpress Miro1 or a mock vector. (B) Isolated MSCs were positive for CD44, CD49f, SCA-1, and negative for CD45 as assessed by flow cytometry. (C) MSC were cultured in Mesencult Adipogenic Differentiation Medium for 7 days. Oil Red O staining revealed the presence of fat droplets in the cytosol, proving MSC differentiation into adipocytes. Magnification X400, scale bar 50 µm. (D) Podocytes labelled with CellTracker Blue were pre-exposed to AGEs/vehicle and then co-cultured with MSC-ND and MSC-DM cells. Cells were stained with Alexa Fluor 488-WGA to reveal TNTs and the percentage of podocytes connected with MSCs via TNTs counted (n=3 ***P<0.001 AGEs-MSC-ND and AGEs-MSC-DM vs. vehicle-MSC-ND). (E) Podocytes labelled with CellTracker Blue were pre-exposed to AGEs/vehicle and then co-cultured with MSC-ND and MSC-DM, carrying RFP-labelled mitochondria. The percentage of blue podocytes containing MSC-derived RFP-mitochondria (dually labelled podocytes) was quantified by flow cytometry (n=3 ***P<0.001 AGEs-MSC-ND vs. AGEs-MSC-DM and vehicle-MSC-ND). (F,G) Miro1 mRNA and protein expression was assessed in MSC-ND and MSC-DM cells by immunoblotting (internal control: tubulin) (n=3, **P<0.01 MSC-DM vs. MSC-ND) and real-time PCR (housekeeping gene: GAPDH) (n=3 **P<0.01 MSC-DM vs. MSC-ND), respectively. (H) Miro1 mRNA levels were measured in MSC-ND exposed to vehicle, AGEs, and MCP1 for 24 h (n=3 ***P<0.01 MCP1 vs. vehicle, **P<0.01 AGEs vs. vehicle) (I) MSC-DM were transfected with an adenovirus to overexpress Miro1 (MSC-DM-Miro) or a mock vector (MSC-DM-Mock) and efficiency of transfection assessed by measuring Miro1 mRNA by real-time PCR (n=3 **P<0.01 DM-Mock vs. ND and DM-Miro1). (J) Podocytes labelled with CellTracker Blue were pre-exposed to AGEs/vehicle and then co-cultured with MSC-ND, MSC-DM-Miro or MSC-DM-Mock, carrying RFP-labelled mitochondria. The percentage of blue podocytes containing MSC-derived RFP-mitochondria (dually labelled podocytes) was quantified by flow cytometry (n=3 ***P<0.01 DM-Mock vs. ND and DM-Miro1).
Figure 6
Figure 6. Mitochondria function, nephrin expression, and apoptosis in AGE-treated podocytes cocultured with diabetic MSCs
MSCs were isolated from the bone marrow of diabetic mice (MSC-DM) and transfected with an adenovirus to overexpress Miro1 (DM-Miro) or a mock vector (DM-Mock). Podocytes were pre-exposed to AGEs/vehicles and then co-cultured with MSC-DM-Miro, MSC-DM-Mock or vehicle. (A) Transition of the fluorescent probe JC-1 from red to green fluorescence was used to detect a decrease in mitochondrial membrane potential (MMP). The graph shows quantification of red to green JC-1 fluorescence intensity (n=3 ***P<0.001 AGEs vs. vehicle, **P<0.001 AGEs-DM-Miro vs. AGEs-DM-Mock). (B) Mitochondrial oxidative stress was assessed using the mitochondrial superoxide indicator MitoSox Red in fluorescence live microscopy. Podocytes were stained with CellTracker green and nuclei counterstained with DAPI. Mitochondrial oxidative stress is shown in yellow-orange (merge CellTracker Green and Mitosox Red). The graph shows the percentage of red fluorescence per podocyte area (n=3 ***P<0.001 AGEs vs. vehicle, **P<0.001 AGEs-DM-Miro vs. AGEs-DM-Mock). (C) Mitochondrial bioenergetics was assessed using Cell Mito Stress Test on a SeahorseXF-24 in podocytes isolated from mono/co-cultures by FACS-sorting. OCR was measured under basal conditions and following addition (dashed lines) of oligomycin, FCCP, and Rot/A, and results normalised to total protein OD values. The graph shows basal, ATP-linked, maximal respiration, and reserve capacity (n=3). (D) Cox1, (E) ND4L mRNA levels were measured by real-time PCR in podocytes isolated from the mono/co-cultures by FACS-sorting. (housekeeping gene: GAPDH) (n=3). (F) Nephrin mRNA levels were measured by real-time PCR in mono/cocultures by real-time PCR (housekeeping gene: GAPDH) (n=3). Apoptosis was evaluated (G,H) by immunoblotting for active caspase-3 expression (tubulin internal control) in FACS-sorted podocytes (n=3) and (I) by TUNEL assay. The graph shows the percentage of apoptotic podocytes (n=3). ***P<0.001, **P<0.01AGEs vs. vehicle ###P<0.001, ##P<0.01, #P<0.05 AGEs-DM-Miro vs. AGEs-DM-Mock
Figure 7
Figure 7. Effect of treatment with exogenous MSCs on diabetes-induced podocyte abnormalities, mesangial expansion, and expression of extracellular matrix components
Mice with diabetic nephropathy (DN) and control animals (ND) were treated with MSCs from WT (MSCWT), M-Sec-knockout mice (MSCKO), or vehicle for 6 weeks. (A) Representative immunofluorescence images of glomerular nephrin and podocin staining. Magnification X400, scale bar 50 µm. (B,C) The graphs show the percent glomerular area of nephrin and podocin positive staining in 20 randomly selected hilar glomerular tuft cross-sections per mouse (n=5 mice per group). (D,E) Nephrin and podocin mRNA levels were measured by real-time PCR in the total renal cortex and the results corrected for WT-1 expression (n=5 mice per group, (F) Periodic acid Schiff (PAS) staining of renal cortex sections. Magnification X400, scale bar 50 µm. (G) Mesangial expansion (mesangial area:total area of glomerulus) was assessed in 15 glomeruli per kidney per animal and reported in the graph (n=5 mice per group). (H) Immunofluorescence staining for glomerular fibronectin. (I) The percent area of glomerular fibronectin-positive staining was assessed on average 30 randomly selected glomeruli per mouse and reported in the graph (n=5 mice per group). (J,K) Fibronectin and collagen IV mRNA levels were measured by real-time PCR in total renal cortex and results corrected for the expression of the housekeeping gene HPRT (n=5 mice per group). ***P<0.001, **P<0.01 ND vs. DN and DN-MSCKO ###P<0.001, ##P<0.01,#P<0.05 DN-MSCWT vs. DN and DN-MSCKO
Figure 8
Figure 8. Effect of treatment with exogenous MSCs on markers of inflammation
Mice with diabetic nephropathy (DN) and control animals (ND) were treated with MSCs from WT (MSCWT), M-Sec-knockout (MSCKO) mice or vehicle for 6 weeks. (A,B) Representative images of MAC2 immunostaining. Magnification X400, scale bars 50 µm. The number of positive cells per glomerular area was counted on average 30 randomly selected glomeruli per mouse and shown in the graph (n=5 mice/group). (C) Monocyte Chemoattractant Protein-1 (MCP-1) and (D) C-C chemokine receptor type 2 (CCR2) mRNA levels were measured in the renal cortex by real-time PCR and results corrected for the expression of the housekeeping gene HPRT (n=5 mice per group). ***P<0.001 ND vs. DN ###P<0.001, ##P<0.01 DN-MSCWT and DN-MSCKO vs. DN.
Figure 9
Figure 9. Exogenous MSCs ameliorate diabetes-induced mitochondrial dysfunction and allow mitochondria transfer to podocytes
Mice with diabetic nephropathy (DN) and control animals (ND) were treated with MSCs from WT (MSCWT), M-Sec knockout (MSCKO) mice, or vehicle for 6 weeks. (A) TFAM, (B) COX1, (C) ND4L mRNA levels were measured in the renal cortex by real-time PCR and results corrected for HPRT expression (n=5 mice per group). (D) Exogenous MSCs carried GFP-tagged mitochondria. Double immunofluorescence for GFP (green) and nephrin (red) was carried out on renal cortex sections. The merged images showed colocalization (yellow) (n = 5 mice per group). Magnification X400, scale bar 50 µm. ***P<0.001, **P<0.01 ND vs. DN and DN-MSCKO ##P<0.01, #P<0.05 DN-MSCWT vs. DN and DN-MSCKO

Similar articles

References

    1. Alicic R.Z., Rooney M.T. and Tuttle K.R. (2017) Diabetic kidney disease: challenges, progress, and possibilities. Clin. J. Am. Soc. Nephrol. 12, 2032–2045 10.2215/CJN.11491116 - DOI - PMC - PubMed
    1. Umanath K. and Lewis J.B. (2018) Update on diabetic nephropathy: core curriculum 2018. Am. J. Kidney Dis. 71, 884–895 10.1053/j.ajkd.2017.10.026 - DOI - PubMed
    1. Jiang A., Song A. and Zhang C. (2022) Modes of podocyte death in diabetic kidney disease: an update. J. Nephrol. 35, 1571–1584 10.1007/s40620-022-01269-1 - DOI - PubMed
    1. Lin J.S. and Susztak K. (2016) Podocytes. The weakest link in diabetic kidney disease? Curr. Diab. Rep. 16, 45 10.1007/s11892-016-0735-5 - DOI - PMC - PubMed
    1. Barutta F., Bellini S. and Gruden G. (2022) Mechanisms of podocyte injury and implications for diabetic nephropathy. Clin. Sci. (Lond.) 136, 493–520 10.1042/CS20210625 - DOI - PMC - PubMed