. 2024 Nov 26;43(11):114972.
doi: 10.1016/j.celrep.2024.114972. Epub 2024 Nov 12.

Cancer-associated fibroblasts maintain critical pancreatic cancer cell lipid homeostasis in the tumor microenvironment

Affiliations

Cancer-associated fibroblasts maintain critical pancreatic cancer cell lipid homeostasis in the tumor microenvironment

Xu Han et al. Cell Rep. .

Abstract

Pancreatic ductal adenocarcinoma (PDAC) is an aggressive malignancy with abundant cancer-associated fibroblasts (CAFs) creating hallmark desmoplasia that limits oxygen and nutrient delivery. This study explores the importance of lipid homeostasis under stress. Exogenous unsaturated lipids, rather than de novo synthesis, sustain PDAC cell viability by relieving endoplasmic reticulum (ER) stress under nutrient scarcity. Furthermore, CAFs are less hypoxic than adjacent malignant cells in vivo, nominating them as a potential source of unsaturated lipids. CAF-conditioned medium promotes PDAC cell survival upon nutrient and oxygen deprivation, an effect reversed by delipidation. Lysophosphatidylcholines (LPCs) are particularly enriched in CAF-conditioned medium and preferentially taken up by PDAC cells, where they are converted to phosphatidylcholine (PC) to sustain membrane integrity. Blocking LPC-to-PC conversion inhibits PDAC cell survival and increases ER stress. These findings show a critical lipid "cross-feeding" mechanism that promotes PDAC cell survival, offering a potential metabolic target for treatment.

Keywords: CP: Cancer; CP: Metabolism; fibroblasts; hypoxia; lipids; pancreatic cancer; tumor microenvironment; unsaturated fatty acids.


Conflict of interest statement

Declaration of interests The authors declare no competing interests.

Figures

Figure 1.
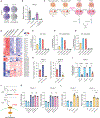
Figure 1.. Pancreatic cancer cells are sensitive to tumor-like stress
(A) Schematic of unsaturated fatty acid resources and how SO stress reduces endogenous and exogenous fatty acid supply. (B–D) Annexin-V/propidium iodide (PI) flow cytometry in control or SO-cultured PDAC cell lines (B) and treated with Z-VAD (C) or ferrostatin (D). (E) Schematic of the SO stress-induced IRE1α/XBP1 pathway. (F) RT-qPCR analysis of XBP1s/XBP1t ratios in PANC-1, Su.86.86, and Capan-2 cells under SO stress. (G and H) XBP1s/XBP1t expression at 24 h (G) and spliced XBP1 protein levels at 72 h (H) in shScramble and shXBP1#1 PDAC cells. (I) Representative cell viability analysis of shScramble- and shXBP1#1-expressing PDAC cell lines under SO stress. (J) Lipid saturation index (intracellular free stearic acid/oleic acid ratios) of PANC-1 cells under 21% O2 or 0.5% O2, serum-free culture. (K) Cell viability of PDAC cell lines with or without oleic acid (60 μM) under SO stress. (L) RT-qPCR analysis of XBP1s/XBP1t ratios in PDAC cell lines under SO stress with or without oleic acid (60 μM) treatment. Baseline, replete medium under 21% O2. (M) Oil red O staining of LDs in PANC-1 cells at 72 h. Scale bars, 100 μm. (N) Schematic of lipid homeostasis in cell viability regulation. Three biological replicates are represented as mean ± SEM. Displayed p values were obtained using paired two-tailed Student’s t test (B–D and K), unpaired two-tailed Student’s t test with Welch’s correction (G, I, and J), and one-way ANOVA with Geisser-Greenhouse correction for multiple comparisons (F and L). *p < 0.05, **p < 0.01, ***p < 0.001. ns, not significant. See also Figure S1.
Figure 2.
Figure 2.. Pancreatic cancer cells are sensitive to lipotoxic stress
(A) Schematic of fatty acid desaturation blockade under lipotoxic stress. (B–E) Annexin-V/PI flow cytometry performed on human and murine PDAC cell lines under lipotoxic stress (200 nM SCD inhibitor) (B) and treated with Z-VAD (C), ferrostatin (D), or oleic acid (E). (F) RT-qPCR analysis of XBP1s/XBP1t ratios in PDAC cell lines under lipotoxic stress or with oleic acid. All experiments were performed with three biological replicates and are represented as mean ± SEM. The p values were calculated using paired two-tailed Student’s t test (B–E) and one-way ANOVA with Geisser-Greenhouse correction for multiple comparisons (F). *p < 0.05, **p < 0.01. ns, not signifiant.
Figure 3.
Figure 3.. Pancreatic cancer cells and stromal cells have distinct hypoxic signatures in vivo
(A) Representative immunohistochemistry images of pimonidazole, HIF1α, α-SMA, and PDPN in KPC murine and human PDAC samples. Black boxes: enlarged images from red boxes. Scale bars, 100 μm. (B and C) Representative immunofluorescence staining of KPCY sections with the indicated antibodies. Scale bars, 100 μm. (D) Hypoxia signature in scRNA-seq of murine PDAC samples. (E) Quantification of the hypoxia signature across three CAF subtypes. (F) UMAP projection of Xenium spatial transcriptomics (8 human PDAC tumors). (G) Representative spatial cell type plot of one tumor of spatial transcriptomics. (H) Distribution plot for CAF and malignant cell populations distance (log) to nearest endothelial cell. See also Figure S2.
Figure 4.
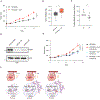
Figure 4.. CAFs promote pancreatic cancer cell survival and progression in vivo and in organoid models
(A) Schematic of the crosstalk between PDAC cells and CAFs under SO stress. (B and C) Crystal violet staining (B) and quantification (C) of PANC-1 cells. Conditioned media (CM) from CAFs cultured in 0.5% BSA, DMEM for 48 h. N, CAFs in 21% O2; H, CAFs in 0.5% O2. Control medium: 53 concentrated 0.5% BSA, DMEM. (D) Annexin-V/PI flow cytometry of PANC-1 cells treated under the indicated conditions. (E) RT-qPCR analysis of XBP1s/XBP1t ratios in PANC-1 cells cultured under SO stress under the indicated conditions. (F) Crystal violet staining of KPC4662 cells under the indicated conditions. (G) Tumor volume of KPC4662 and KPC4662-CAF co-injected xenografts. Each group included six tumors from three mice. (H) Endpoint tumor weight of subcutaneous models. (I) Representative bright-field images of primary PDAC organoids cultured in Matrigel with CAF CM. (J and K) Quantification of cell number (J) and organoid size (K). Scale bars, 100 μm. Data are represented as mean ± SD (C, D, and J) with one-way ANOVA for multiple comparisons and mean ± SEM with one-way ANOVA (E). *p < 0.05, **p < 0.01, ***p < 0.001, ****p < 0.0001. ns, not significant. See also Figures S3 and S4.
Figure 5.
Figure 5.. LPC is the key metabolite in CAF-PDAC crosstalk supporting lipid homeostasis
(A and B) Crystal violet (A) and quantification (B) of PANC-1 cells cultured with human CAF CM or delipidated CM under SO conditions. (C) Schematic of LC-MS analysis with CAF CM collected before (pre-media) and after (post-media) PANC-1 cell culture. (D) Heatmap of the relative amount of LPCs and phospholipids by LC-MS. (E–G) Quantification of total saturated LPCs (E), unsaturated LPCs (F), and LPCs (G). (H) Viability of PDAC cell lines treated with the indicated LPCs under SO stress. (I) Gene expression of XBP1s/XBP1t ratios, CHOP, and BiP in PANC-1 cells treated with LPC (18:1) under SO. (J) Schematic of LPC conversion to LPA, activating LPAR to promote cell proliferation. (K and L) Quantification of live PANC-1 cells treated with HA130 or KI16425 under SO for 72 h with 53 CAF CM (K) or LPC (18:1) (L). Three biological replicates are represented as mean ± SEM. The p values were calculated using one-way ANOVA with Geisser-Greenhouse correction for multiple comparisons (H, K, and L) and paired two-tailed Student’s t test (I). *p < 0.05, **p < 0.01. ns, not significant. See also Figure S5.
Figure 6.
Figure 6.. Blockade of LPC utilization disrupts CAF-PDAC crosstalk
(A) Schematic of the LPC tracing assay by LC-MS. (B) Intracellular LPC (17:1) or LPC (17:0) enrichment in PANC-1 cells. (C and D) Enrichment of TGs (C) and PCs (D) with one acyl chain of (17:0) or (17:1). (E) Schematic of TSI-01 blockade of LPC-to-PC conversion. (F) PANC-1 cell viability under SO stress with LPC (18:1) and TSI-01 at 72 h. (G) RT-qPCR of XBP1s/XBP1t ratio and CHOP in PANC-1 cells treated with LPC (18:1) and TSI-01 under SO stress. (H) Representative flow cytometry of shScramble or shXBP1 PANC-1 cells treated with LPC (18:1) and TSI-01 under SO for 72 h. (I) Tumor weight (left) and growth (right) of KPC4662 or KPC4662 + CAF tumors in C57BL/6 mice treated with vehicle or 10 or 20 mg/kg TSI-01. Each group had at least eight tumors. Three biological replicates are represented as mean ± SEM. The p values were calculated using one-way ANOVA with Geisser-Greenhouse correction for multiple comparisons. *p < 0.05, **p < 0.01, ***p < 0.001, ****p < 0.0001. ns, not significant. See also Figure S6.
Figure 7.
Figure 7.. A CR diet combined with fatty acid synthesis inhibition disrupts CAF-PDAC crosstalk in vivo
(A and B) Tumor volume (A) and endpoint tumor weight (B) of KPC4662 and KPC4662 co-injected with CAF syngeneic tumors in C57BL/6 mice on a CR diet. (C) Fasting blood glucose levels of control or CR diet-treated mice. (D) Expression of FASN protein in shScramble or shFasn CAFs. (E) Tumor growth of subcutaneous KPC4662 PDAC allografts co-injected with murine shScramble or shFasn CAFs in mice fed a CR diet. (F) Schematic of CAF-PDAC crosstalk via LPCs to relieve membrane stress and cancer survival, with TSI-01 disrupting LPC metabolism under nutrient stress. Tumor growth data (mean ± SEM, 10 tumors from 5 mice) were analyzed by two-way ANOVA (A and E). Other data (mean ± SD) were analyzed by two-tailed Student’s t test (B and C). *p < 0.05, **p < 0.01, ***p < 0.001. ns, not significant.

References

    1. Provenzano PP, Cuevas C, Chang AE, Goel VK, Von Hoff DD, and Hingorani SR (2012). Enzymatic Targeting of the Stroma Ablates Physical Barriers to Treatment of Pancreatic Ductal Adenocarcinoma. Cancer Cell 21, 418–429. 10.1016/j.ccr.2012.01.007. - DOI - PMC - PubMed
    1. Jacobetz MA, Chan DS, Neesse A, Bapiro TE, Cook N, Frese KK, Feig C, Nakagawa T, Caldwell ME, Zecchini HI, et al. (2013). Hyaluronan impairs vascular function and drug delivery in a mouse model of pancreatic cancer. Gut 62, 112–120. 10.1136/gutjnl-2012-302529. - DOI - PMC - PubMed
    1. Lee KE, Spata M, Bayne LJ, Buza EL, Durham AC, Allman D, Vonderheide RH, and Simon MC (2016). Hif1α Deletion Reveals Pro-Neoplastic Function of B Cells in Pancreatic Neoplasia. Cancer Discov. 6, 256–269. 10.1158/2159-8290.cd-15-0822. - DOI - PMC - PubMed
    1. Koong AC, Mehta VK, Le QT, Fisher GA, Terris DJ, Brown JM, Bastidas AJ, and Vierra M (2000). Pancreatic tumors show high levels of hypoxia. Int. J. Radiat. Oncol. Biol. Phys 48, 919–922. 10.1016/s0360-3016(00)00803-8. - DOI - PubMed
    1. Geyer M, Schreyer D, Gaul L-M, Pfeffer S, Pilarsky C, and Queiroz K (2023). A microfluidic-based PDAC organoid system reveals the impact of hypoxia in response to treatment. Cell Death Discov. 9, 20. 10.1038/s41420-023-01334-z. - DOI - PMC - PubMed

Publication types

MeSH terms

Substances

Associated data