. 2025 Feb;23(2):377-394.
doi: 10.1111/pbi.14503. Epub 2024 Nov 13.

Creeping Stem 1 regulates directional auxin transport for lodging resistance in soybean

Affiliations

Creeping Stem 1 regulates directional auxin transport for lodging resistance in soybean

Zhiyong Xu et al. Plant Biotechnol J. 2025 Feb.

Abstract

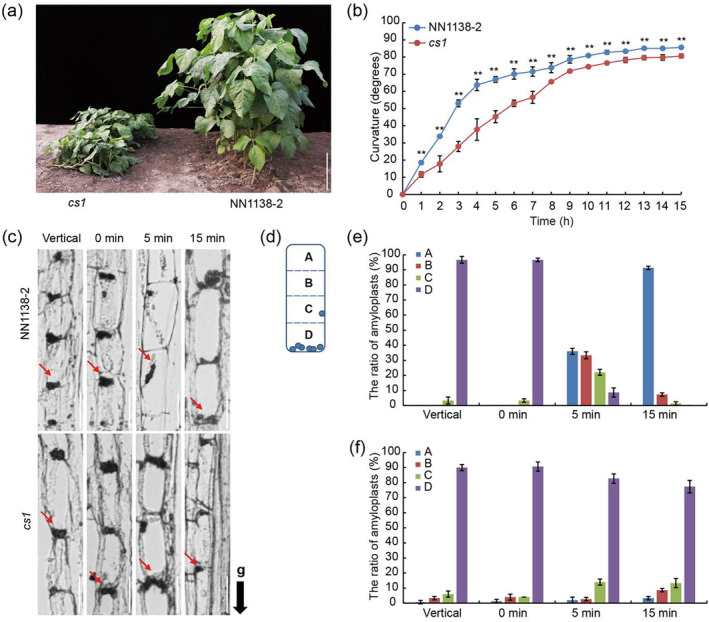
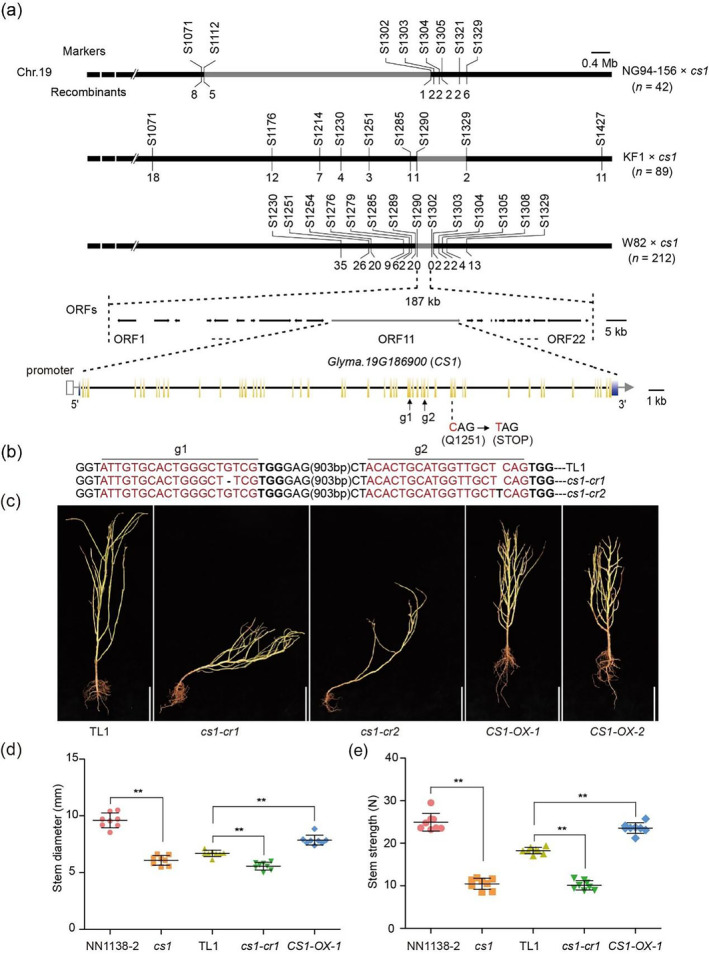
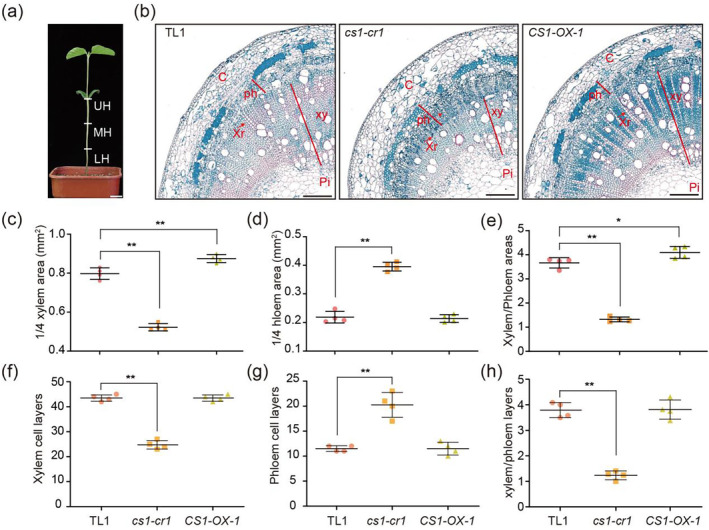
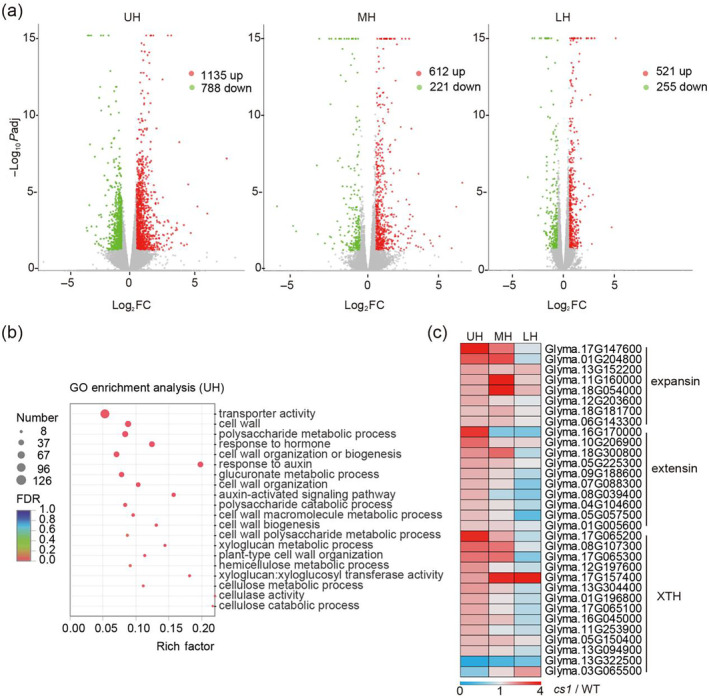
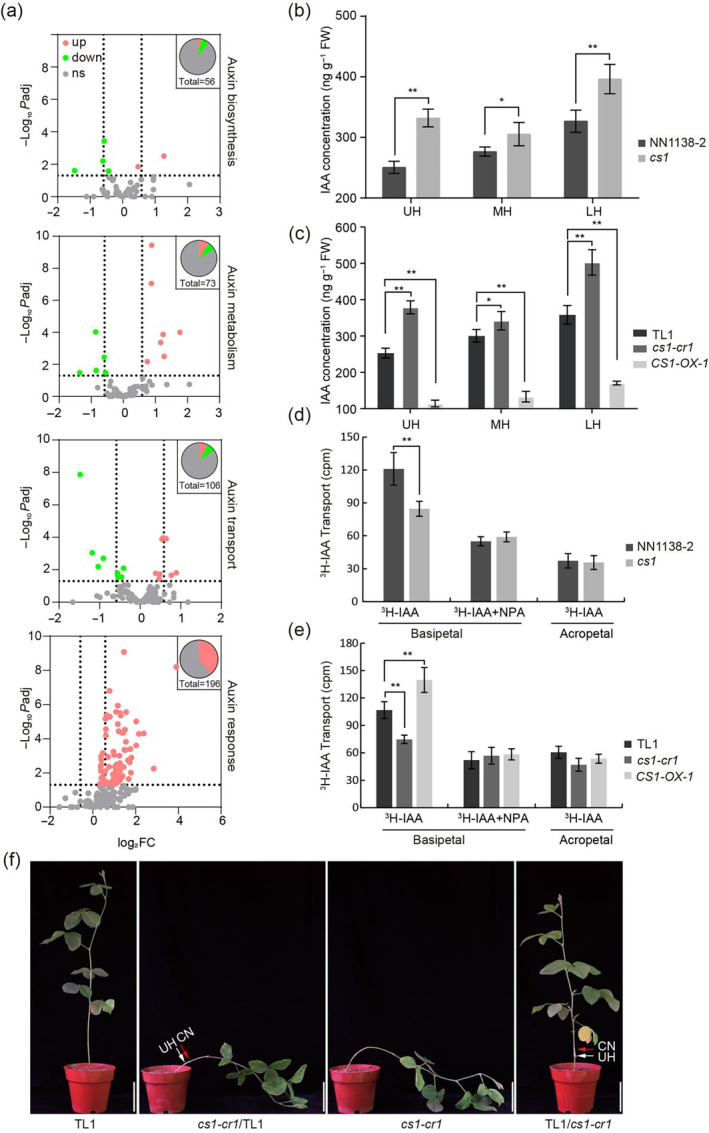
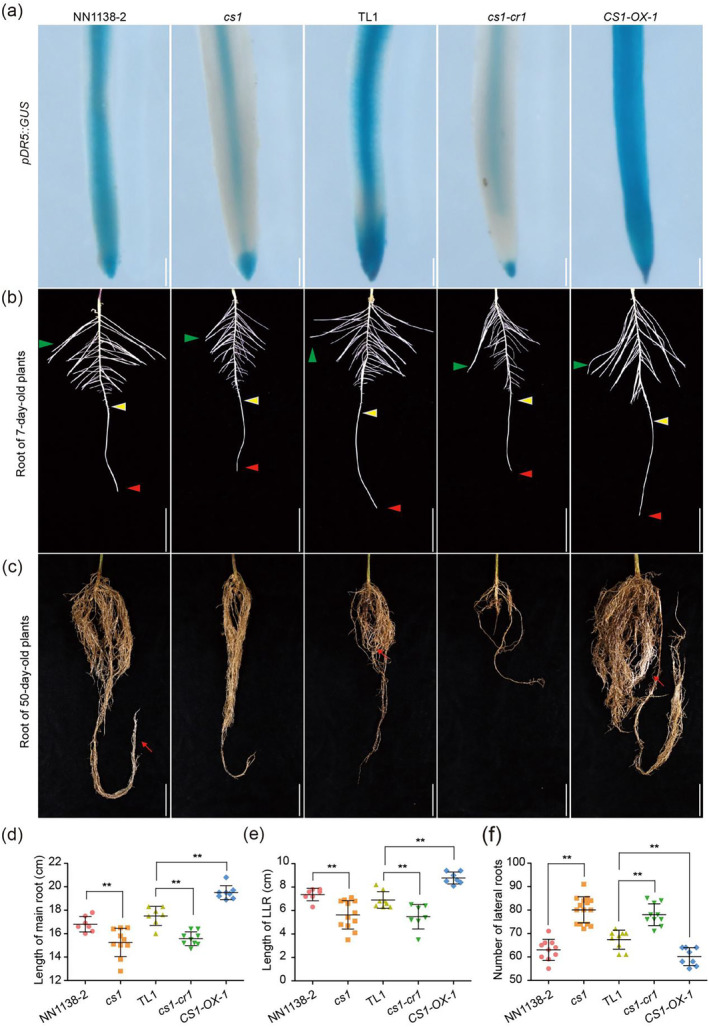
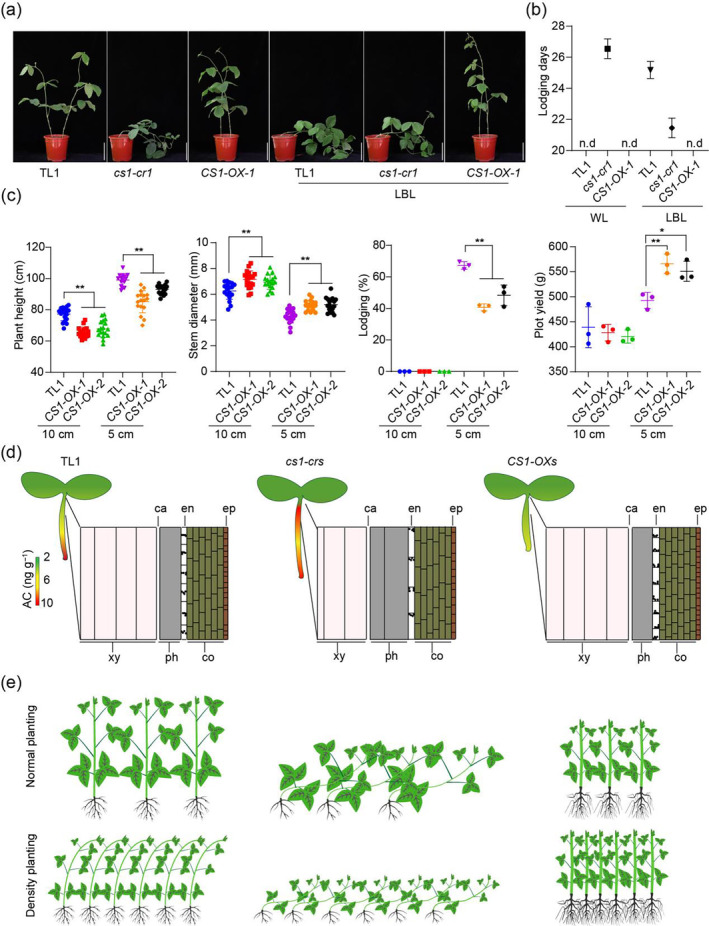
Soybean, a staple crop on a global scale, frequently encounters challenges due to lodging under high planting densities, which results in significant yield losses. Despite extensive research, the fundamental genetic mechanisms governing lodging resistance in soybeans remain elusive. In this study, we identify and characterize the Creeping Stem 1 (CS1) gene, which plays a crucial role in conferring lodging resistance in soybeans. The CS1 gene encodes a HEAT-repeat protein that modulates hypocotyl gravitropism by regulating amyloplast sedimentation. Functional analysis reveals that the loss of CS1 activity disrupts polar auxin transport, vascular bundle development and the biosynthesis of cellulose and lignin, ultimately leading to premature lodging and aberrant root development. Conversely, increasing CS1 expression significantly enhances lodging resistance and improves yield under conditions of high planting density. Our findings shed light on the genetic mechanisms that underlie lodging resistance in soybeans and highlight the potential of CS1 as a valuable target for genetic engineering to improve crop lodging resistance and yield.

Keywords: amyloplast sedimentation; gravitropism; lodging resistance; polar auxin transport; soybean.


Figures

Figure 1
Figure 1
Identification of the cs1 mutant. (a) 7‐week‐old plants of the cs1 mutant and the wild‐type accession NN1138‐2 at vegetative stage in the field. Scale bars = 20 cm. (b) Gravitropic response of hypocotyl in dark. The indicated lines were grown under LD conditions for 7 days. Values are means ± SD (n = 3). The significant difference between the wild type and cs1 mutant at each time point was determined by a two‐sided t‐test (**P < 0.01). (c) Longitudinal section images show the distribution of amyloplasts in endodermal cells. The 7‐day‐old vertical growing plants were inverted for 0–15 min. The fragments of hypocotyls (1–2 cm below the cotyledon node) were collected and fixed with the gravity direction maintained at the indicated time point. The red arrows indicate the locations of the amyloplasts, and the black arrow indicates the direction of gravity (g). Scale bars = 5 μm. (d) Schematic diagram of an endodermal cell, partitioned into four blocks (A, B, C and D from top to bottom) for quantitative analysis, blue circles represent amyloplasts. (e, f) The ratio of amyloplasts in each block in NN1138‐2 (e) and cs1 (f), Data are means ± SD (n = 50).
Figure 2
Figure 2
CS1 encodes a MAESTRO‐RELATED HEAT DOMAIN‐CONTAINING protein. (a) Fine mapping of CS1 candidate gene using three populations: NG94‐156 × cs1, KF1 × cs1 and W82 × cs1. The CS1 locus was narrowed down to a 187‐kb region containing 22 annotated ORFs (open reading frame). A nonsense mutation (C–T) was identified in the 39th exon of Glyma.19G186900 in the cs1 mutant, leading to a premature protein at Q1252. The Glyma.19G186900 gene structure is schematically shown; exons and introns are indicated by yellow bars and black bars respectively. The blue bars indicated the 5′‐ and 3′‐untranslated region. (b) Two sgRNAs (g1 and g2, black arrows) were designed to target the 32th and 36th exons of Glyma.19G186900 respectively. The mutant sequences of two representative homozygous mutants (cs1‐cr1 and cs1‐cr2) at T2 generation are shown. The target sites of sgRNA are highlighted in red letters with the protospacer‐adjacent motif (PAM) in bold. The black base and dash line within the target sites denote nucleotide insertion and deletion respectively. (c) Plant architectures of the wild type (TL1), CS1 knockout mutants (cs1‐cr1, cs1‐cr2) and CS1 overexpression lines (CS1‐OX‐1 and CS1‐OX‐2) at mature stage in the field. Scale bar = 25 cm. (d, e) Comparison of hypocotyl diameter (d) and stem length (e) of indicated lines at 46 days after sowing. Data are means ± SD (n = 8). The significant difference between the indicated line and wild type was determined by two‐sided t‐test (**P < 0.01).
Figure 3
Figure 3
The CS1 gene regulates xylem and phloem development in hypocotyl. (a) Pattern of hypocotyl Segmentation. (b) Quadrant cross‐sectional images show the cell layer structures in the upper region of hypocotyls. The plants of indicated lines were grown under LD conditions for 7 days. C, cortex; ph, phloem; pi, pith; xr, xylem rays; xy, xylem. The red arrows represent xylem rays. Scale bar = 250 μm. (c–h) Scatter plots of xylem areas (c), phloem areas (d), xylem areas/phloem areas (e), xylem cell lays (f), phloem cell lays (g) and xylem cell lays/phloem cell lays (h) of indicated lines as in (b). Data are means ± SD (n = 4). The significant difference between the indicated line and wild type was determined by two‐sided t‐test (*P < 0.05; **P < 0.01).
Figure 4
Figure 4
The CS1 gene affects cell wall‐related genes and auxin transport‐related genes changes in the upper hypocotyl. (a) Volcano plot of gene expression differences between the NIL lines in the indicated segments of hypocotyls. The abscissa is the multiple of the difference of gene / transcript expression between the two samples, and the ordinate is the statistical test value of the difference of gene expression, namely P value. Each dot in the plot represents a specific gene, the red dot represents the significantly upregulated gene, the blue dot represents the significantly downregulated gene and the grey dot represents the nonsignificant differential gene. (b) GO term related to cell wall and auxin in UH. The GO terms related to cell wall and auxin in UH were plotted by GO IDs. The vertical axis represents the GO term, horizontal axis represents the Rich factor [the ratio of the number of genes/transcripts enriched in the GO term (Sample number) to the number of annotated genes/transcripts (Background number)]. The larger the Rich factor, the greater the degree of enrichment. The size of the dot indicates the number of genes / transcripts in the GO Term, and the colour of the dot corresponds to different Padjust (P value‐corrected) ranges. (c) Heat map of expansin, extensin and XTH gene families (involved in cell wall organization and modification) in UH, MH and LH. Plotted with the TPM cs1 /TPMWT of the corresponding part, red represents upregulation >1, light blue represents downregulation <1 and grey represents no change = 1.
Figure 5
Figure 5
The slow PAT in cs1 results in an increase in auxin concentration and gradient disorder. (a) Volcanic map of auxin biosynthesis, metabolism, transport and response‐related genes in UH. The abscissa represents the fold change in gene expression difference between the two samples, while the ordinate represents the statistical test value (P‐value) of the difference in gene expression change. Each point in the figure represents a specific gene, where red dots indicate significantly upregulated genes, green dots indicate significantly downregulated genes and grey dots represent nonsignificantly different genes. The two dashed lines on the abscissa represent 1.5 times up and downregulation of genes, respectively, while the dashed line on the ordinate represents P = 0.05. (b, c) Auxin concentration in each segment of hypocotyls of indicated lines. FW means fresh weight. Values are means ± SD (n ≥ 5). (d, e) Comparison of PAT differences in hypocotyls among indicated lines. Values are means ± SD (n = 5). Comparison of differences in PAT among TL1, cs1‐cr1 and CS1‐OX‐1. Values are means ± SD (n = 5). b‐e, The asterisks indicate statistically significant differences from the wild type by two‐sided t‐test (*P < 0.05; **P < 0.01). (f) Grafting leads to cs1‐cr1 not lodging, but TL1 lodging. The white arrow indicates the grafting position and the red arrow indicates the cotyledon node. CN means cotyledon node. Representative images of at least three independent grafting experiments of the indicated combination. cs1‐cr1/TL1: cs1‐cr1 is scion, TL1 is rootstock; TL1/ cs1‐cr1:TL1 is scion, cs1‐cr1 is rootstock. Scale bar = 10 cm.
Figure 6
Figure 6
Dysfunction of CS1 confers abnormal auxin distribution and root morphology. (a) Histochemical staining of pDR5::GUS transgenic hairy roots in the indicated backgrounds. Three independent experiments yielded similar results. Scale bar = 50 μm. (b) Root images of 7‐day‐old seedlings grown under LD conditions. The red triangle represents the tip of the main root, the green triangle represents the longest lateral root and the yellow triangle represents the newest lateral root. Scale bar = 4 cm. (c) Representative root images of indicated genotypes grown under LD conditions for 50 days. Scale bar = 3 cm. (d–f) The main root length, the longest lateral root length (data from b) and the number of lateral roots (data from b). Values are means ± SD (n = 10). The asterisks indicate statistically significant differences from the wild type by two‐sided t‐test (**P < 0.01).
Figure 7
Figure 7
Density planting exacerbated TL1 lodging, but had little effect on CS1‐OXs. (a) Lodging phenotype under white light (WL) and low blue light (LBL). Scale bar = 9 cm. (b) Plant lodging days in (a). Values are means ± SD (n = 4). (c) Comparison of the plant height, stem diameter, lodging rate and plot yield of TL1 and CS1‐OXs under normal planting and density planting. Normal planting means 10‐cm space. Density planting means 5‐cm space. Plants at maturity stage R8 whose main stem leaned more than 45° were recorded as having lodged. Data are means ± SD of three biological repeats. The significant difference between the indicated line and wild type was determined by two‐sided t‐test (*P < 0.05, **P < 0.01). (d) Auxin concentration gradient and organization structure pattern diagram in TL1, cs1‐cr1 and CS1‐OX‐1. The black circles in en represent amyloplasts, and the position represents the distribution of amyloplasts after plants were inverted 5 min. ca, the cambium; co, cortex; en, endodermis; ep, epidermis; ph, phloem; Xy, xylem. AC means auxin concentration. (e) The morphology of TL1, cs1‐cr1 and CS1‐OX‐1 at different planting densities.

Similar articles

Cited by

References

    1. Antwi‐Boasiako, A. (2017) Screening of soybean (Glycine max (L.) Merrill) genotypes for resistance to lodging and pod shattering. Int. J. Agron. Agric. Res. 10, 1–8.
    1. Baker, C.J. , Sterling, M. and Berry, P. (2014) A generalised model of crop lodging. J. Theor. Biol. 363, 1–12. - PubMed
    1. Baldwin, K.L. , Strohm, A.K. and Masson, P.H. (2013) Gravity sensing and signal transduction in vascular plant primary roots. Am. J. Bot. 100, 126–142. - PubMed
    1. Band, L.R. , Wells, D.M. , Larrieu, A. , Sun, J.Y. , Middleton, A.M. , French, A.P. , Brunoud, G. et al. (2012) Root gravitropism is regulated by a transient lateral auxin gradient controlled by a tipping‐point mechanism. Proc. Natl. Acad. Sci. USA, 109, 4668–4673. - PMC - PubMed
    1. Chen, H. , Yang, Z. , Chen, L. , Zhang, C. , Yuan, S. , Zhang, X. , Qiu, D. et al. (2017) Combining QTL and candidate gene analysis with phenotypic model to unravel the relationship between lodging and related traits in soybean. Mol. Breed. 37, 1–14. - PubMed

MeSH terms

LinkOut - more resources