. 2024 Nov 15;10(46):eadp9371.
doi: 10.1126/sciadv.adp9371. Epub 2024 Nov 13.

TET2 regulates early and late transitions in exhausted CD8+ T cell differentiation and limits CAR T cell function

Affiliations

TET2 regulates early and late transitions in exhausted CD8+ T cell differentiation and limits CAR T cell function

Alexander J Dimitri et al. Sci Adv. .

Abstract

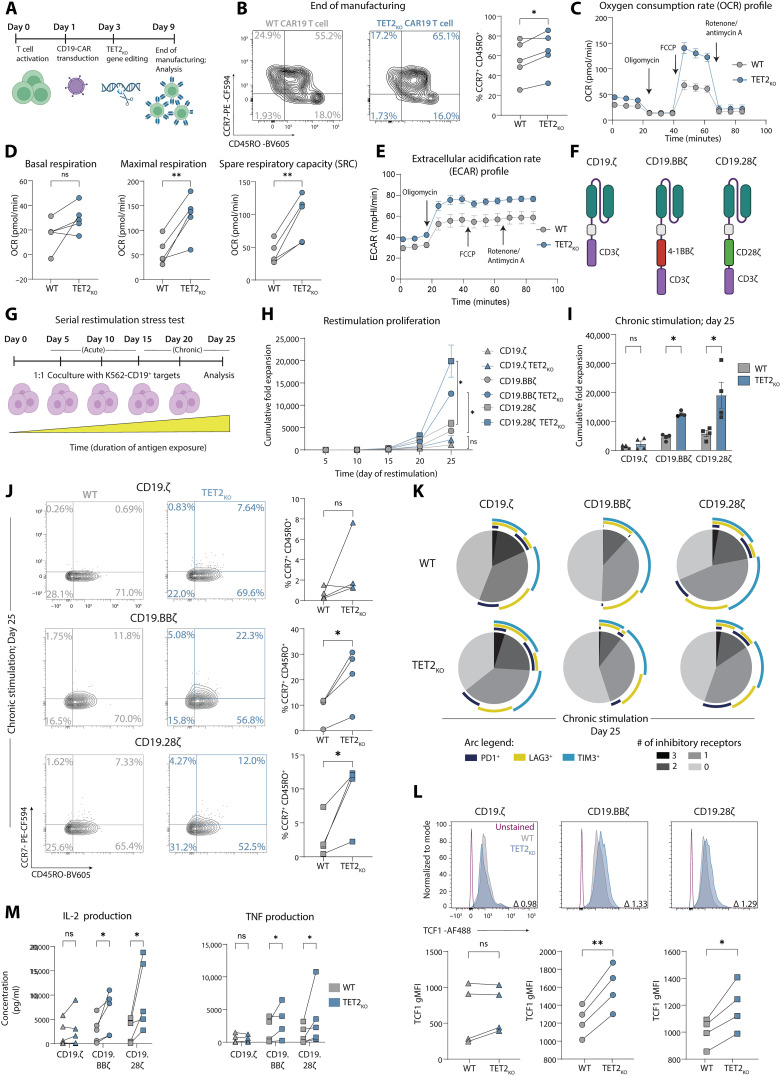
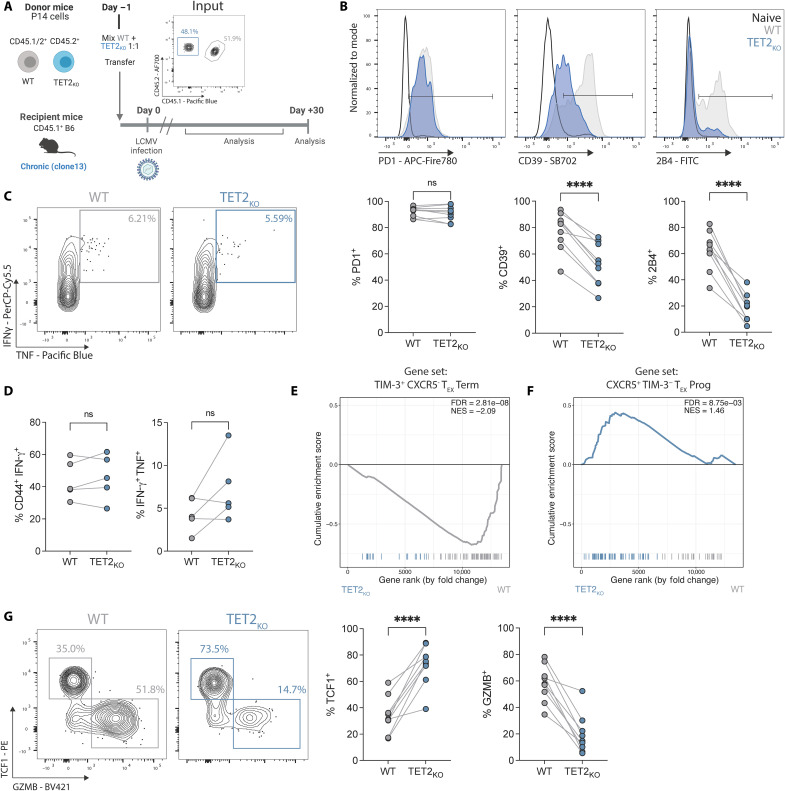
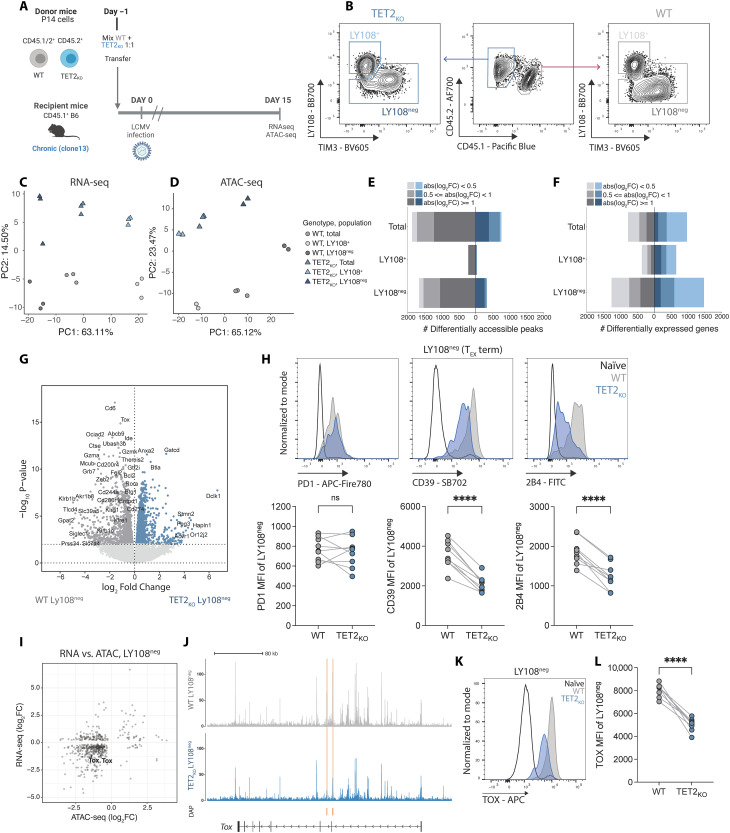
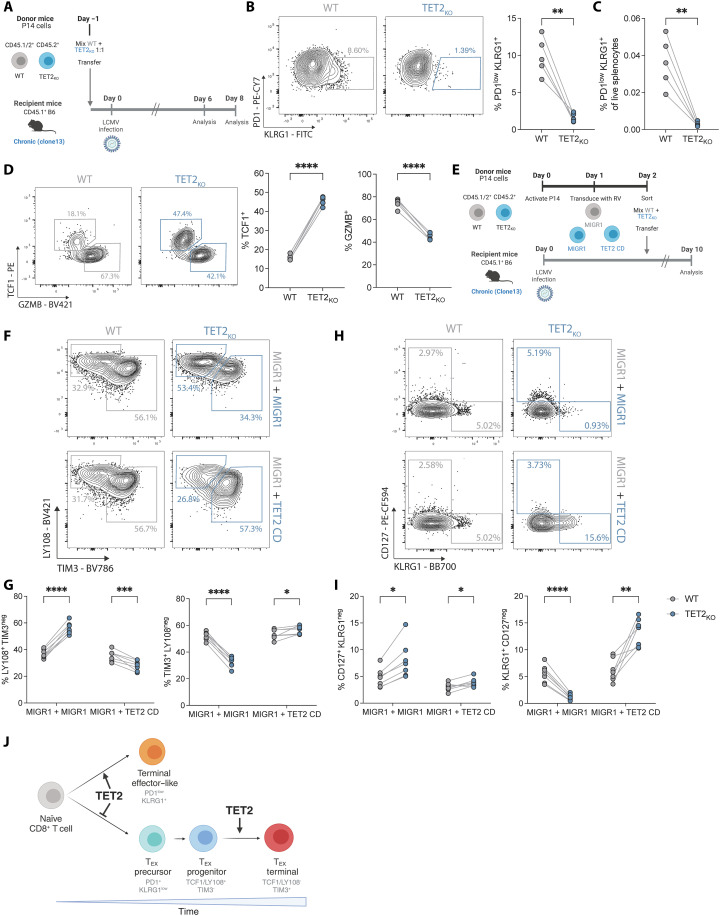
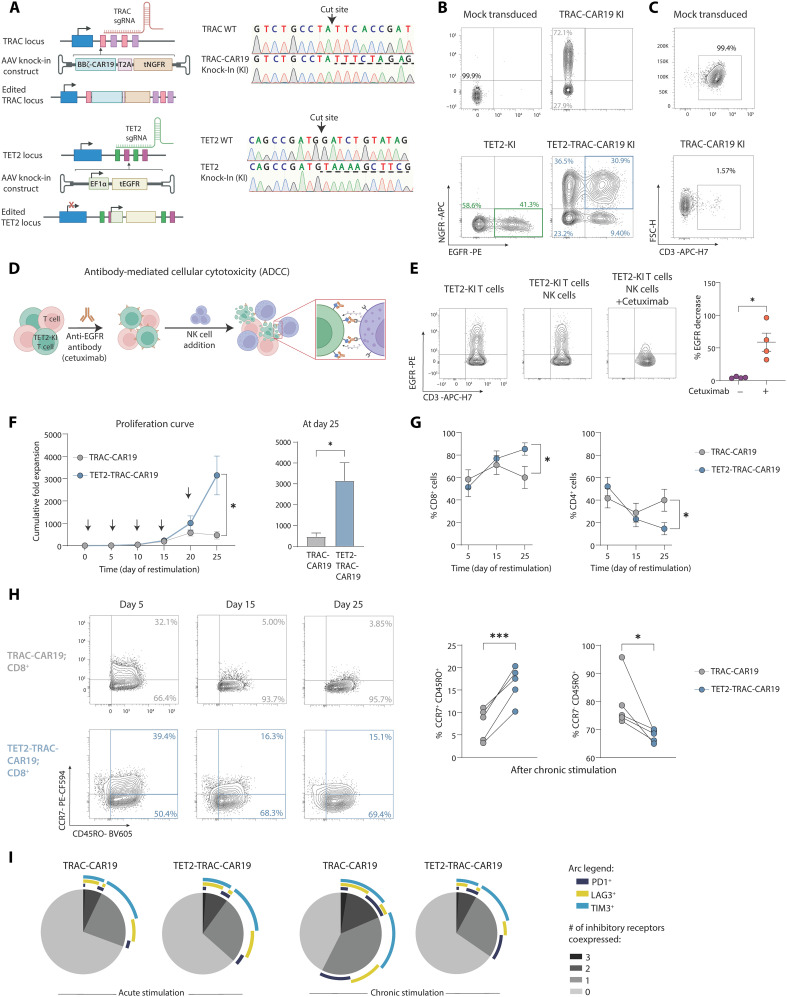
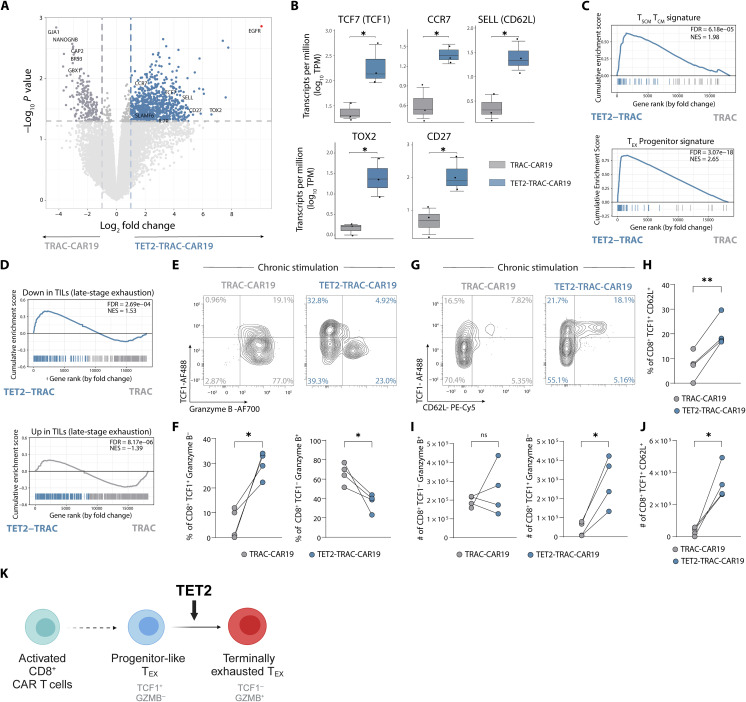
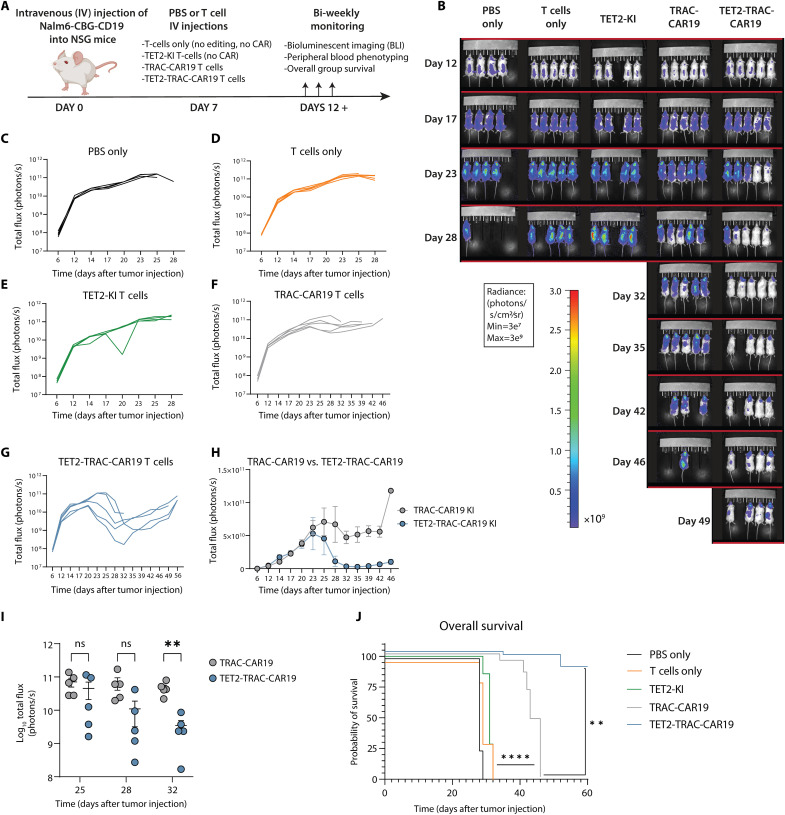
CD8+ T cell exhaustion hampers control of cancer and chronic infections and limits chimeric antigen receptor (CAR) T cell efficacy. Targeting TET2 in CAR T cells provides therapeutic benefit; however, TET2's role in exhausted T cell (TEX) development is unclear. In chronic lymphocytic choriomeningitis virus (LCMV) infection, TET2 drove conversion from stem cell-like TEX progenitors toward terminally differentiated and effector (TEFF)-like TEX. TET2 also enforced a terminally differentiated state in the early bifurcation between TEFF and TEX, indicating broad roles for TET2 in acquisition of effector biology. To exploit the therapeutic potential of TET2, we developed clinically actionable TET2-targeted CAR T cells by disrupting TET2 via knock-in of a safety switch alongside CAR knock-in at the TRAC locus. TET2-targeted CAR T cells exhibited restrained terminal exhaustion in vitro and enhanced antitumor responses in vivo. Thus, TET2 regulates fate transitions in TEX differentiation and can be targeted with a safety mechanism in CAR T cells for improved tumor control.


Figures

Fig. 1.
Fig. 1.. TET2-deleted CAR T cells adopt a central memory–like state following manufacturing and exhibit increased expansion and reduced IR expression under chronic stimulation across multiple CAR constructs.
(A) CAR T cell manufacturing and TET2 gene editing schematic. (B) Example plots and data after CAR T cell expansion (day 9), highlighting CCR7+ CD45RO+ central memory subset, n = 5. (C and D) Longitudinal oxygen consumption rate (OCR) (C), basal respiration, maximal respiration, and SRC (D) of TET2-disrupted cells at end of expansion (day 9) after oligomycin, carbonyl cyanide p-trifluoromethoxyphenylhydrazone (FCCP) and antimycin A/rotenone administration as indicated in (C), n = 5, run in triplicate. (E) Extracellular acidification rate (ECAR) of the same TET2-disrupted cells from (C) and (D). (F and G) Schematic of CD19.CD3ζ, CD19.BBζ, and CD19.CD28ζ CAR constructs ± TET2KO (F) placed in a serial restimulation stress test (G). (H and I) Cumulative fold expansion of serially restimulated CAR T cells ± TET2KO throughout (H) and at day 25 (I), n = 4. (J) Example plots and data of serially restimulated CAR T cells ± TET2KO showing distribution of CCR7+ CD45RO+ central memory–associated markers in CD8+ CAR T cell populations after five stimulations, n = 4. (K) SPICE plots showing distribution of IR coexpression in serially restimulated CD8+ CAR T cells ± TET2KO after five stimulations (chronic, day 25) with K562-CD19+ cells as depicted in (G), n = 4. (L) Example histograms (top) and data (bottom) of TCF1 gMFI in serially restimulated CD8+ CAR T cells ± TET2KO after five stimulations, with indicated fold change, n = 4. (M) IL-2 and TNF production from supernatant collected 24 hours after fifth stimulation, n = 5. Data shown as means ± SEM [(C), (E), and (H)] or individual values [(B), (D), (I), (J), (L), and (M)] from independent donors. ns P > 0.05; *P < 0.05; **P < 0.01 by paired t test. Schematics [(A), (F), and (G)] created with BioRender.com.
Fig. 2.
Fig. 2.. TET2 mediates the transition out of the progenitor TEX subset toward terminal exhaustion.
(A) Cotransfer experimental schematic. Inset plot shows initial P14 cotransfer. (B) Example plots and data for IR expression on TET2KO P14 cells compared to WT P14 cells. (C and D) Example plots (C) and data (D) comparing IFN-γ and TNF expression following peptide restimulation for WT and TET2KO P14 cells. (E and F) GSEA of terminal TEX (E) and TEX progenitor (F) signatures between WT and TET2KO P14 cells at day 15 p.i. with LCMV clone 13 (Gene sets from GSE84105). (G) Example plots and data comparing TCF1+ TEX progenitor and GZMB+ terminally differentiated TEX frequencies within WT and TET2KO P14 cells. (B and G) n = 9, spleen at day 30 p.i. with LCMV clone 13. Data for individual mice shown; representative of >4 independent experiments. (D) n = 5, spleen at day 37 p.i. with LCMV clone 13. Data for individual mice shown; representative of three independent experiments. [(B), (D), and (G)] ns P > 0.05; *P < 0.05; **P < 0.01; ***P < 0.001; ****P < 0.0001 by paired t test. Schematic (A) created with BioRender.com.
Fig. 3.
Fig. 3.. Loss of TET2 limits terminal differentiation of exhausted CD8 T cells.
(A) Experiment schematic for RNA-seq and ATAC-seq. WT and TET2KO P14 cells were analyzed at day 15 p.i. with LCMV clone 13. (B) Sorting strategy for TEX subsets for RNA and ATAC-seq. (C and D) PCA of RNA-seq (C) and ATAC-seq (D) data for WT and TET2KO TEX subsets. (E and F) Number of DACRs (E) or DEGs (F) for each pairwise comparison between WT and TET2KO TEX subsets {FDR < 0.05, with variable absolute log2 fold changes [abs(log2FC)] indicated}. (G) Volcano plot highlighting DEG in WT compared to TET2KO LY108neg TEX. (H) Example plots and data comparing expression of PD1, CD39, and 2B4 on TET2KO LY108neg TEX to WT LY108neg TEX. (I) Correlation plot of differential gene expression and peak accessibility in TET2KO LY108neg TEX compared to WT LY108neg TEX with TOX labelled. (J) Example tracks showing accessibility at the Tox locus in LY108neg TEX. Differentially Accessible Peaks (DAPs) are indicated in orange. (K and L) Example plots (K) and data (L) comparing TOX expression in TET2KO LY108neg TEX to WT LY108neg TEX. [(H) and (L)] n = 9, spleen at day 30 p.i. with LCMV clone 13. Data for individual mice shown; representative of three independent experiments. ns P > 0.05; ****P < 0.0001 by paired t test. Schematic (A) created with BioRender.com.
Fig. 4.
Fig. 4.. TET2 regulates early bifurcation of TEX from TEFF-like cells.
(A) Experiment schematic for analysis of TET2KO P14 cells early (days 6 to 8) of LCMV clone 13 infection. (B) Example plots and data comparing frequency of early TEFF-like cells (KLRG1+ PD1low) within WT and TET2KO P14 cells at day 8 p.i. (C) Frequencies of WT and TET2KO KLRG1+ PD1low TEFF-like cells from total live splenocytes at day 8 p.i. (D) Example plots and data comparing expression of TCF1 and GZMB for WT and TET2KO P14 cells. (E) Experiment schematic for rescue of TET2 function in TET2KO P14 cells. (F and G) Example plots (F) and data (G) comparing frequencies of LY108+ TEX and TIM3+ TEX for WT and TET2KO P14 cells with or without overexpression of the TET2 catalytic domain (TET2 CD versus MIGR1). (H and I) Example plots (H) and data (I) comparing frequencies of CD127+ TMEM-like and KLRG1+ TEFF-like cells for WT and TET2KO P14 cells with or without overexpression of the TET2 catalytic domain (TET2 CD). (J) Model for TET2 role at major bifurcation events in chronic infection. [(B) to (D)] n = 5, spleen at day 8 p.i. with LCMV clone 13. Data for individual mice shown, representative of two independent experiments. *P < 0.05; **P < 0.01; ***P < 0.001; ****P < 0.0001 by paired t test. [(G) and (I)] n = 7, spleen at day 10 p.i. with LCMV clone 13. Data for individual mice shown, representative of two independent experiments. ns P > 0.05; *P < 0.05; **P < 0.01; ***P < 0.001; ****P < 0.0001 by multiple paired t test with Holm-Šídák posttest correction. Schematics [(A), (E), and (J)] created with BioRender.com.
Fig. 5.
Fig. 5.. Dual KI TET2-TRAC-CAR19 T cells have enhanced proliferation and maintain memory-associated marker expression.
(A) Left: Schematic of TRAC (top) and TET2 (bottom) loci alongside rAAV6 KI vectors. Right: Sanger sequencing electropherogram confirming integration of TRAC and TET2 KI constructs, underlined with dashed line. (B) Example plots of TET2 and TRAC-CAR19 single KI or dual TET2-TRAC-CAR19 KI T cells. (C) Example plots of CD3 loss detected by flow in TRAC-CAR19-KI T cells. (D and E) Schematic of in vitro ADCC assay (D) to deplete CRISPR-edited TET2-KI T cells. Example plots and data (E) of EGFR expression on TET2-KI T cells alone or in an NK cell coculture ± cetuximab incubation, gated on CD56 populations, n = 4. (F) Cumulative fold expansion of TRAC-CAR19 and TET2-TRAC-CAR19 T cells during restimulation and at day 25, arrows represent addition of irradiated K562-CD19+ target cells, n = 5. (G) Proportions of CD4+ versus CD8+ T cells in TRAC-CAR19 and TET2-TRAC-CAR19 T cells after stimulation, n = 7. (H) Example plots showing distribution of central (CCR7+ CD45RO+) and effector (CCR7 CD45RO+) memory-associated markers in CD8+ CAR T cell populations after restimulation, with summary after five stimulations, n = 5. (I) SPICE plot showing distribution of IR coexpression in CD8+ TRAC-CAR19 and TET2-TRAC-CAR19 T cells after 1 (acute) and 5 (chronic) stimulations, n = 6. (J) Data shown as means ± SEM [(F) and (G)] or individual values [(E) and (H)] from independent donors. ns P > 0.05; *P < 0.05; **P < 0.01; ***P < 0.001 by paired t test. Schematics [(A and (D)] created with BioRender.com.
Fig. 6.
Fig. 6.. TET2 disruption limits terminal differentiation of TRAC-CAR19 T cells.
(A) Volcano plot showing differentially regulated genes in CD8+ TET2-TRAC-CAR19 and TRAC-CAR19 T cells after four stimulations; select markers highlighted. EGFR highlighted in red as TET2-KI construct positive control. Graph axes represent log2 fold change and -log10 P value, n = 3. (B) Box plots of individual gene log10 Transcripts per Million (TPM) for TET2-TRAC-CAR19 and TRAC-CAR19 T cells from (A), n = 3. (C and D) GSEA for signatures of stem-cell central memory and central memory T cells (TSCM and TCM) and TEX progenitors (gene sets from GSE147398) (C) and from human tumor infiltrating lymphocytes (TILs) [from (69)]. (D) Normalized enrichment score (NES) and FDR indicated in panel. (E and F) Example plots (E) and data (F) of CD8+ CAR T cell TCF1/Granzyme B subpopulation frequencies after four stimulations, n = 4. (G and H) Example plots (G) and data (H) of CD8+ CAR T cell TCF1/CD62L subpopulation frequencies after four stimulations, n = 4. (I and J) Number of CD8+ TCF1 Granzyme B+, CD8+ TCF1+ Granzyme B (I) and CD8+ TCF1+ CD62L+ (J) CAR T cells from (F) and (H), n = 4. (K) Model for TET2 role during CAR T cell chronic stimulation. Data shown as means ± SEM (B) or individual values [(F) and (H) to (J)] from independent donors. ns P > 0.05; *P < 0.05; **P < 0.01; ***P < 0.001 by paired t test. Schematic (K) created with BioRender.com.
Fig. 7.
Fig. 7.. TET2 KI enhances the antitumor activity of TRAC-CAR19 T cells in vivo.
(A) Overview of in vivo experimental design, n = 4 to 5 mice per experimental group; one experiment. (B) Longitudinal tumor burden of all experimental groups by bioluminescent imaging (BLI). (C to G) Tumor outgrowth for PBS only (C), T cell (D), TET2-KI T cell (E), TRAC-CAR19 T cell (F), and TET2-TRAC-CAR19 T cell (G) groups, with individual mice shown. (H) Longitudinal comparison of TRAC-CAR19 and TET2-TRAC-CAR19 T cell group tumor burden. (I) BLI comparison at days during and immediately after peak CAR T cell response in TRAC-CAR19 and TET2-TRAC-CAR19 groups, line at mean with SEM; ns P > 0.05; *P < 0.05; **P < 0.01 by multiple paired t tests with Holm-Šídák correction. (J) Overall group survival, **P < 0.01; ****P < 0.0001 by Mantel-Cox log-rank test. Data shown as means ± SEM (H) or individual values [(C) to (G) and I)] from each mouse. Schematic (A) created with BioRender.com.

References

    1. Blank C. U., Haining W. N., Held W., Hogan P. G., Kallies A., Lugli E., Lynn R. C., Philip M., Rao A., Restifo N. P., Schietinger A., Schumacher T. N., Schwartzberg P. L., Sharpe A. H., Speiser D. E., Wherry E. J., Youngblood B. A., Zehn D., Defining ‘T cell exhaustion’. Nat. Rev. Immunol. 19, 665–674 (2019). - PMC - PubMed
    1. Albelda S. M., CAR T cell therapy for patients with solid tumours: Key lessons to learn and unlearn. Nat. Rev. Clin. Oncol. 21, 47–66 (2024). - PubMed
    1. Lynn R. C., Weber E. W., Sotillo E., Gennert D., Xu P., Good Z., Anbunathan H., Lattin J., Jones R., Tieu V., Nagaraja S., Granja J., de Bourcy C. F. A., Majzner R., Satpathy A. T., Quake S. R., Monje M., Chang H. Y., Mackall C. L., c-Jun overexpression in CAR T cells induces exhaustion resistance. Nature 576, 293–300 (2019). - PMC - PubMed
    1. Long A. H., Haso W. M., Shern J. F., Wanhainen K. M., Murgai M., Ingaramo M., Smith J. P., Walker A. J., Kohler M. E., Venkateshwara V. R., Kaplan R. N., Patterson G. H., Fry T. J., Orentas R. J., Mackall C. L., 4-1BB costimulation ameliorates T cell exhaustion induced by tonic signaling of chimeric antigen receptors. Nat. Med. 21, 581–590 (2015). - PMC - PubMed
    1. Chen J., López-Moyado I. F., Seo H., Lio C.-W. J., Hempleman L. J., Sekiya T., Yoshimura A., Scott-Browne J. P., Rao A., NR4A transcription factors limit CAR T cell function in solid tumours. Nature 567, 530–534 (2019). - PMC - PubMed

MeSH terms