Compact highly sensitive photothermal RT-LAMP chip for simultaneous multidisease detection
- PMID: 39536102
- PMCID: PMC11559619
- DOI: 10.1126/sciadv.adq2899
Compact highly sensitive photothermal RT-LAMP chip for simultaneous multidisease detection
Abstract
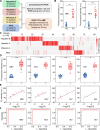
Developing instant detection systems with disease diagnostic capabilities holds immense importance for remote or resource-limited areas. However, the task of creating these systems-which are simultaneously easy to operate, rapid in detection, and cost-effective-remains a challenge. In this study, we present a compact highly sensitive photothermal reverse transcriptase-loop-mediated isothermal amplification (RT-LAMP) chip (SPRC) designed for the detection of multiple diseases. The nucleic acid (NA) amplification on the chip is achieved through LAMP driven by either LED illumination or simple sunlight focusing. SPRC performs sample addition and amplification within a limited volume and autonomous enrichment of NA during the sample addition process, achieving a limit of detection (LOD) as low as 0.2 copies per microliter. Through 120 clinical samples, we achieved an accuracy of 95%, with a specificity exceeding 97.5%. Overall, SPRC has achieved promising progress in the application of point-of-care testing (POCT) by using light energy to simultaneously detect multiple diseases.
Figures


Similar articles
-
Development of a photothermal bead-based nucleic acid amplification test (pbbNAAT) technique for a high-performance loop-mediated isothermal amplification (LAMP)-based point-of-care test (POCT).Biosens Bioelectron. 2022 Nov 1;215:114574. doi: 10.1016/j.bios.2022.114574. Epub 2022 Jul 22. Biosens Bioelectron. 2022. PMID: 35926394
-
Detection of Zika Virus Using Reverse Transcription-Loop-Mediated Isothermal Amplification (RT-LAMP).Methods Mol Biol. 2020;2142:137-146. doi: 10.1007/978-1-0716-0581-3_12. Methods Mol Biol. 2020. PMID: 32367365
-
Multisite Clinical Validation of Isothermal Amplification-Based SARS-CoV-2 Detection Assays Using Different Sampling Strategies.Microbiol Spectr. 2021 Oct 31;9(2):e0084621. doi: 10.1128/Spectrum.00846-21. Epub 2021 Oct 20. Microbiol Spectr. 2021. PMID: 34668736 Free PMC article.
-
Development and Clinical Application of a Rapid and Sensitive Loop-Mediated Isothermal Amplification Test for SARS-CoV-2 Infection.mSphere. 2020 Aug 26;5(4):e00808-20. doi: 10.1128/mSphere.00808-20. mSphere. 2020. PMID: 32848011 Free PMC article.
-
Principles and Applications of Loop-Mediated Isothermal Amplification to Point-of-Care Tests.Biosensors (Basel). 2022 Oct 10;12(10):857. doi: 10.3390/bios12100857. Biosensors (Basel). 2022. PMID: 36290994 Free PMC article. Review.
Cited by
-
Integrated horizontal convective PCR system for clinical diagnostics.Sci Adv. 2025 Aug 8;11(32):eadx8434. doi: 10.1126/sciadv.adx8434. Epub 2025 Aug 6. Sci Adv. 2025. PMID: 40768581 Free PMC article.
References
-
- Zhang F., Karamagi H., Nsenga N., Nanyunja M., Karinja M., Amanfo S., Chase-Topping M., Calder-Gerver G., McGibbon M., Huber A., Wagner-Gamble T., Guo C.-G., Haynes S., Morrison A., Ferguson M., Awandare G. A., Mutapi F., Yoti Z., Cabore J., Moeti M. R., Woolhouse M. E. J., Predictors of COVID-19 epidemics in countries of the World Health Organization African Region. Nat. Med. 27, 2041–2047 (2021). - PMC - PubMed
-
- Faust L., Zimmer A. J., Kohli M., Saha S., Boffa J., Bayot M. L., Nsofor I., Campos L., Mashamba-Thompson T., Herrera R., Emeka E., Shrestha S., Ugarte-Gil C., Katamba A., Pambudi I., Bichara D., Calderon R. I., Ahmadzada N., Safdar M. A., Nikam C., dos Santos Lázari C., Hussain H., Win M. M., Than K. Z., Ahumibe A., Waning B., Pai M., SARS-CoV-2 testing in low- and middle-income countries: Availability and affordability in the private health sector. Microbes Infect. 22, 511–514 (2020). - PMC - PubMed
-
- W. H. Organization, (WHO), “Laboratory and point-of-care diagnostic testing for sexually transmitted infections, including HIV” (Publication 978-92-4-007708-9, WHO, 2023; https://iris.who.int/bitstream/handle/10665/374252/9789240077089-eng.pdf).
-
- Najjar D., Rainbow J., Sharma Timilsina S., Jolly P., de Puig H., Yafia M., Durr N., Sallum H., Alter G., Li J. Z., Yu X. G., Walt D. R., Paradiso J. A., Estrela P., Collins J. J., Ingber D. E., A lab-on-a-chip for the concurrent electrochemical detection of SARS-CoV-2 RNA and anti-SARS-CoV-2 antibodies in saliva and plasma. Nat. Biomed. Eng. 6, 968–978 (2022). - PMC - PubMed
MeSH terms
Supplementary concepts
LinkOut - more resources
Full Text Sources
Other Literature Sources

