. 2024 Nov 15;10(46):eadp6567.
doi: 10.1126/sciadv.adp6567. Epub 2024 Nov 13.

USP1 deubiquitinates PARP1 to regulate its trapping and PARylation activity

Affiliations

USP1 deubiquitinates PARP1 to regulate its trapping and PARylation activity

Anna Nespolo et al. Sci Adv. .

Abstract

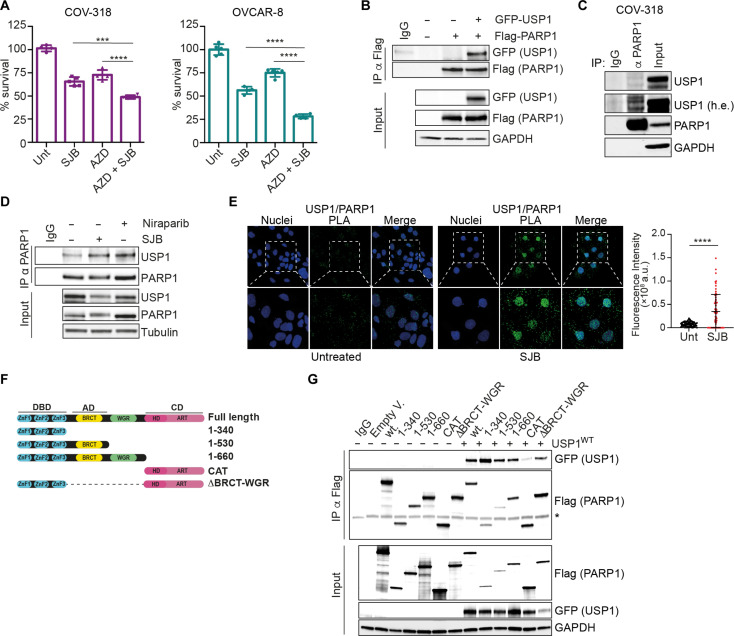
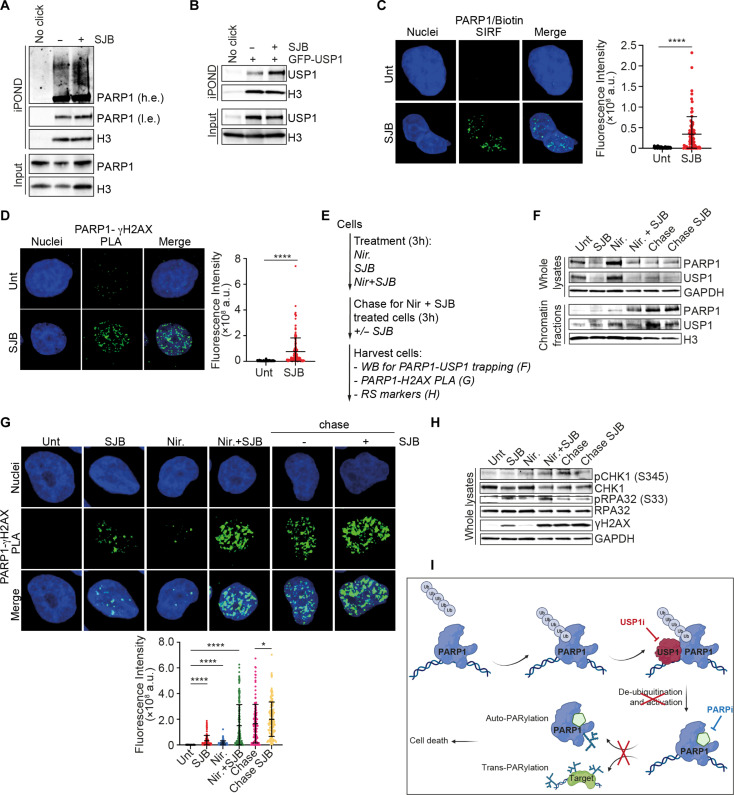
PARP inhibitors (PARPi) represent a game-changing treatment for patients with ovarian cancer with tumors deficient for the homologous recombination (HR) pathway treated with platinum (Pt)-based therapy. PARPi exert their cytotoxic effect by both trapping PARP1 on the damaged DNA and by restraining its enzymatic activity (PARylation). How PARP1 is recruited and trapped at the DNA damage sites and how resistance to PARPi could be overcome are still matters of investigation. Here, we described PARP1 as a substrate of the deubiquitinase USP1. At molecular level, USP1 binds PARP1 to remove its K63-linked polyubiquitination and controls PARP1 chromatin trapping and PARylation activity, regulating sensitivity to PARPi. In both Pt/PARPi-sensitive and -resistant cells, USP1/PARP1 combined blockade enhances replicative stress, DNA damage, and cell death. Our work dissected the biological interaction between USP1 and PARP1 and recommended this axis as a promising and powerful therapeutic choice for not only sensitive but also chemoresistant patients with ovarian cancer irrespective of their HR status.


Figures

Fig. 1.
Fig. 1.. USP1 inhibition increases RS.
(A) Table reporting EOC cell lines used. p53 and BRCA1/2 mutational status are indicated according to literature data and HR status according to experimental analysis using AmoyDx HRD focus panel. (B and C) USP1 inhibitor SJB (500 nM) increases DNA strand breaks as demonstrated by alkaline comet assay (B) and Western blot (WB) of H2AX phosphorylation (γH2AX) (C). In (B) data are presented as the mean ± SD of the percentage of DNA content in the tails (>50 cells and >30 cells counted/condition for COV-318 and OVCAR-8, respectively; n = 3). Representative images of the comets were reported. (D) Graphs reporting the percentage of micronuclei (MN) in EOC cells treated or not with SJB (500 nM) for 3 hours. Data are presented as mean ± SD (>500 cells and >300 cells counted/condition for COV-318 and OVCAR-8 respectively; n = 3). (E) Graphs reporting fork symmetry in COV-318 and OVCAR-8 cells treated with SJB 500 nM for 3 hours according to the label scheme reported over the graphs. Data are presented as the mean ± SD of CldU/IdU ratio of DNA fibers. Representative images of the fibers were reported under the graphs (>50 fibers counted/condition, n = 3). (F) WB analysis of replicative stress (RS) markers in COV-318 cells treated with SJB (300 nM) and ATRi (5 μM) (AZD-6378) for the indicated time points. (G) OVCAR-8 cells were treated or not with SJB 500 nM for 3 hours and 53BP1 nuclear bodies (NBs) were detected by immunofluorescence (IF). The graph reports the percentage of cells positive for 53BP1 (NBs) (two biological replicates performed in duplicate). (H) Graph reporting fork symmetry in the indicated OVCAR-8 cells according to the label scheme reported above. Data are presented as the mean ± SD of CldU/IdU ratio of DNA fibers. Representative images of the fibers were reported (>40 fibers counted/condition, n = 3). Two-tailed, unpaired Student’s t test (*P < 0.05, **P < 0.01, and ****P < 0.0001).
Fig. 2.
Fig. 2.. USP1 inhibition potentiates the efficacy of PARPi in both HRD and HRP EOC cells.
(A) Nonlinear regression analysis of cell viability assays in COV-318 and OVCAR-8 cells treated for 16 hours with increasing doses of PARPi, niraparib (Nir.), in combination, or not with SJB (COV-318 200 nM; OVCAR-8 100 nM). (B) Two-dimensional synergy maps highlighting synergistic and antagonistic dose regions in red and green colors, respectively, as indicated on the right. The darker red boxes represent the most synergic area. Highest single agent (HSA) scores are reported (HSA score > 10 = synergism; HSA score < −10 = antagonism). (C) Nonlinear regression analysis of cell viability assays in COV-318 and OVCAR-8 USP1WT and USP1KO cells treated for 72 hours with increasing doses of niraparib. (D) Nonlinear regression analysis of cell viability assays in OVCAR-8 Pt-sensitive and Pt-res cells treated for 72 hours with increasing doses of niraparib. (E) Nonlinear regression analysis of cell viability assays in OVCAR-8 Pt-res cells treated for 72 hours with increasing doses of niraparib, in combination, or not with SJB (200 nM). In (A) and (C) to (E), data are expressed as percentage of viable cells with respect to the untreated cells and represent the mean (±SD) of three biological replicates. Fisher’s exact test was used to calculate the global P value reported in the graphs. The tables below the graphs show the IC50 and the confidence interval (CI) of each condition.
Fig. 3.
Fig. 3.. PARP1 is a target of USP1.
(A) Graphs representing cell viability of COV-318 and OVCAR-8 cells after 16 hours of treatment with the specific PARP1 inhibitor AZD-9574, SJB, or the combination (COV-318: SJB 200 nM and AZD 500 μM; OVCAR-8: SJB 100 nM and AZD 250 μM). Data are expressed as percentage of viable cells with respect to the untreated conditions and represented the mean (±SD). (B and C) Coimmunoprecipitation (co-IP) analysis of exogenous in 293T17 (B) or endogenous in COV-318 cells (C) interaction between USP1 and PARP1 proteins. (D) Co-IP analysis of endogenous USP1 and PARP1 interaction in OVCAR-8 cells treated or not with SJB (500 nM) or niraparib (1μM) for 3 hours. (E) Representative confocal microscopy images of endogenous PARP1/USP1 proximity ligation assay (PLA) in OVCAR-8 cells treated or not with SJB (500 nM) for 3 hours. White dashed boxes highlight the areas magnified in the panels below. The graph on the right report the fluorescence intensity/cells for each condition (>60 cells analyzed per condition, n = 3). (F) Schematic representation of PARP1-truncated mutants used in this work. (G) Co-IP analysis performed in whole lysates of 293T17 cells transfected with FLAG-tagged plasmids for PARP1 described in (F) together with plasmid encoding GFP-tagged USP1 (* = aspecific band). In (B), (C), (D), and (G), input indicates the expression of PARP1 and USP1 in cell lysates. Immunoglobulin G (IgG) represents the control IP using an unrelated antibody. Glyceraldehyde-3-phosphate dehydrogenase (GAPDH) or tubulin was used as loading controls. In (A) and (E), two-tailed, unpaired Student’s t test was used (***P < 0.001 and ****P < 0.0001).
Fig. 4.
Fig. 4.. USP1 regulates PARP1 K63-linked ubiquitination.
(A) His-Ubiquitin pull down assay of Flag-PARP1 in 293T17 cells co-transfected with His-tagged ubiquitin, PARP1, USP1WT, or USP1C90S. (B) Endogenous PARP1 ubiquitination analysis in OVCAR-8 USP1WT or KO cells transfected with His-tagged ubiquitin. Whole-cell lysates were subjected to IP with antibody against PARP1 and immunoblotted for specific K63-linked ubiquitin chains. (C) Co-IP analysis on 293T17 cells lysates transfected with His-tagged ubiquitin and treated with the inhibitors as indicated for 3 hours (SJB 800 nM and Nir./ML-792/MLN-7243 1 μM). α-PARP1 antibody was used for the immunoprecipitation. (D) Nonlinear regression analysis of cell viability assay in OVCAR-8 cells transfected with Flag-tagged PARP1 full-length (FL) or ΔBRCT/WGR deletion mutant and treated with increasing doses of niraparib together or not with SJB (50 nM). Overexpression was checked by WB analysis. Data and statistical analysis were calculated and expressed as described in Fig. 2. The table below the graph shows the IC50 and the CI of each condition. In (A) to (C), input indicates the expression of PARP1, USP1, and ubiquitin in cell lysates. IgG represents the control IP using an unrelated antibody. GAPDH or tubulin was used as loading controls.
Fig. 5.
Fig. 5.. USP1 inhibition impairs PARylation and induces PARP1 trapping.
(A and B) WB analysis of PAR content in EOC cells treated with SJB (500 nM for OVCAR-8 and 300 nM for COV-318) for 3 hours (A) or in COV-318 as indicated (B). (C) PARP1 activity analyzed by ELISA in COV-318 cells treated with SJB (300 nM) or niraparib (Nir) (1 μM) for 16 hours. Results are expressed as mUnits PARP/ng protein (mean ± SD of three biological determinations). (D) WB analysis of PAR content in whole lysates of OVCAR-8 USP1WT or USP1KO cells treated or not with niraparib as indicated for 24 hours. (E) Co-IP analysis of endogenous PARP1 auto-PARylation in OVCAR-8 cells treated with SJB (500 nM) or niraparib (1 μM) for 3 hours. (F) WB analysis of USP1 and PARP1 trapping in whole lysates and chromatin fractions of COV-318 cells treated with SJB (300 nM) as indicated. (G) Representative images showing GFP-PARP1 accumulation at laser-induced DNA damage (dashed boxes) at the indicated time points in OVCAR-8 cells treated or not with SJB (500 nM, 3 hours). (H and I) Graphs representing the percentage of recovery of the damaged area over time (H) and at last recorded frame (4 min) (I) (>40 cells were considered/condition). Two-tailed unpaired t test with Welch’s correction was used (***P < 0.001). (J and L) Co-IP analysis of endogenous USP1 and PARP1 interaction (J) and PARP1 polyubiquitination (L) on chromatin of OVCAR-8 cells treated with SJB (500 nM) for 3 hours. (* = aspecific band). (K) Representative confocal microscopy images of endogenous PARP1 and ubiquitin (Ubi) PLA in OVCAR-8 cells overexpressing His-ubiquitin and treated or not with SJB (500 nM, 3 hours). White dashed boxes highlight the magnified areas. The graphs on the right report the fluorescence intensity/cells for each condition (>100 cells analyzed, n = 3). (M) WB analysis of PARP1 expression on whole lysates and chromatin fractions of OVCAR-8 overexpressing Flag-PARP1 FL or ΔBRCT/WGR mutant and treated as in (J). In (C) and (K), two-tailed, unpaired Student’s t test was used (*P < 0.05 and ****P < 0.0001)
Fig. 6.
Fig. 6.. USP1-PARP1 interaction is localized on replication fork.
(A and B) iPOND analyses of endogenous PARP1 (A) and exogenous USP1 (B) at replication forks in OVCAR-8 cells transfected (B) or not (A) with GFP-tagged USP1 and treated with SJB (500 nM) for 3 hours. Inputs represent 2% of the total cellular protein content. (C) Representative confocal microscopy images of SIRF analysis in OVCAR-8 cells treated with SJB (500 nM) for 3 hours. Green dots represent PARP1/biotin PLA foci. (D) Representative confocal microscopy images of PLA analysis between USP1-γH2AX in COV-318 cells treated or not with SJB (300 nM) for 3 hours. (E to H) WB analysis of USP1 and PARP1 (F) or RS markers (H) expression or images from PARP1/γH2AX PLA (G) (>150 cells counted in each condition, n = 3) in OVCAR-8 cells used for a trapping–chase experiment according to the experiments scheme reported in (E) (500 nM SJB, 1 μM Nir). In (C), (D), and (G), the graphs report the fluorescence intensity/cells for each condition expressed with mean ± SD of quantifications of green dots for each cell. Two-tailed, unpaired Student’s t test was used (*P < 0.05 and ****P < 0.0001). (I) Schematic representation of the proposed USP1-mediated processing of PARP1 deubiquitination. Created with BioRender.com. In (A) and (B), Input indicates the expression of PARP1 and USP1 in cell lysates. IgG represents the control IP using an unrelated antibody. GAPDH was used as loading control for whole lysates, Histone H3 for chromatin fractions.
Fig. 7.
Fig. 7.. USP1/PARP1 inhibitors combination is effective also in in vivo models.
(A) Cell viability of HGSOC patient–derived primary cells treated for 72 hours with increasing doses of niraparib in combination or not with SJB (OV-213 = 300 nM; OV-194, OV-196, OV-202, OV-206, and OV-225 = 200 nM). (B) Nonlinear regression analysis of cell viability assays in ID8 p53−/−PTEN−/− cells treated as in (A) (SJB = 300 nM). In (A) and (B), data are expressed as percentage of viable cells with respect to the untreated cells and represent the mean (±SD) of three biological replicates. (C to E) Graph (D) and radar plot (E) reporting the number of tumor cells present in ascites and the distribution of abdominal metastasis in C57Bl/6 mice treated according to the scheme depicted in (C) (n = 4 mice for conditions). (F to H) Graph (G) and radar plot (H) showing the number and the distribution in abdominal organs of tumor masses in NSG mice injected with PDX#OV218.3 and treated as described in (F) (n = 5 mice for conditions). In (H), metastasis with >100 tumor cells were considered. In (E) and (H), colored lines indicate the number [0 to 4 in (E); 0 to 5 in (H)] of mice affected for each district. (I) Typical images of hematoxylin and eosin (H&E) staining of liver metastasis in mice described in (F) to (H). 5× and 10× (dashed boxes indicate magnified areas) images of the same field are shown. (J and K) WB analysis of RS markers on tumor cells collected from ascites (J) and IF of γH2AX on tumor masses in abdominal cavity (K) collected from mice in (F) to (H). On the right, γH2AX foci positive cells (>5 foci/cell) were counted: Data are presented as the mean ± SD of the percentage of positive cells for each field (>280 cells/field counted in each condition). Representative images were reported in (K). Two-tailed, unpaired Student’s t test was used (*P < 0.05, **P < 0.01, ***P < 0.001, and ****P < 0.0001).

References

    1. Evans T., Matulonis U., PARP inhibitors in ovarian cancer: Evidence, experience and clinical potential. Ther. Adv. Med. Oncol. 9, 253–267 (2017). - PMC - PubMed
    1. Lord C. J., Ashworth A., PARP inhibitors: Synthetic lethality in the clinic. Science 355, 1152–1158 (2017). - PMC - PubMed
    1. Matulonis U. A., Sood A. K., Fallowfield L., Howitt B. E., Sehouli J., Karlan B. Y., Ovarian cancer. Nat. Rev. Dis. Primers. 2, 16061 (2016). - PMC - PubMed
    1. Bowtell D. D., Böhm S., Ahmed A. A., Aspuria P.-J., Bast R. C. Jr., Beral V., Berek J. S., Birrer M. J., Blagden S., Bookman M. A., Brenton J. D., Chiappinelli K. B., Martins F. C., Coukos G., Drapkin R., Edmondson R., Fotopoulou C., Gabra H., Galon J., Gourley C., Heong V., Huntsman D. G., Iwanicki M., Karlan B. Y., Kaye A., Lengyel E., Levine D. A., Lu K. H., McNeish I. A., Menon U., Narod S. A., Nelson B. H., Nephew K. P., Pharoah P., Powell D. J., Ramos P., Romero I. L., Scott C. L., Sood A. K., Stronach E. A., Balkwill F. R., Rethinking ovarian cancer II: Reducing mortality from high-grade serous ovarian cancer. Nat. Rev. Cancer 15, 668–679 (2015). - PMC - PubMed
    1. Konstantinopoulos P. A., Ceccaldi R., Shapiro G. I., D’Andrea A. D., Homologous recombination deficiency: Exploiting the fundamental vulnerability of ovarian cancer. Cancer Discov. 5, 1137–1154 (2015). - PMC - PubMed

MeSH terms

Substances