. 2024 Nov 15;10(46):eadq9183.
doi: 10.1126/sciadv.adq9183. Epub 2024 Nov 13.

Experience-dependent, sexually dimorphic synaptic connectivity defined by sex-specific cadherin expression

Affiliations

Experience-dependent, sexually dimorphic synaptic connectivity defined by sex-specific cadherin expression

Chien-Po Liao et al. Sci Adv. .

Abstract

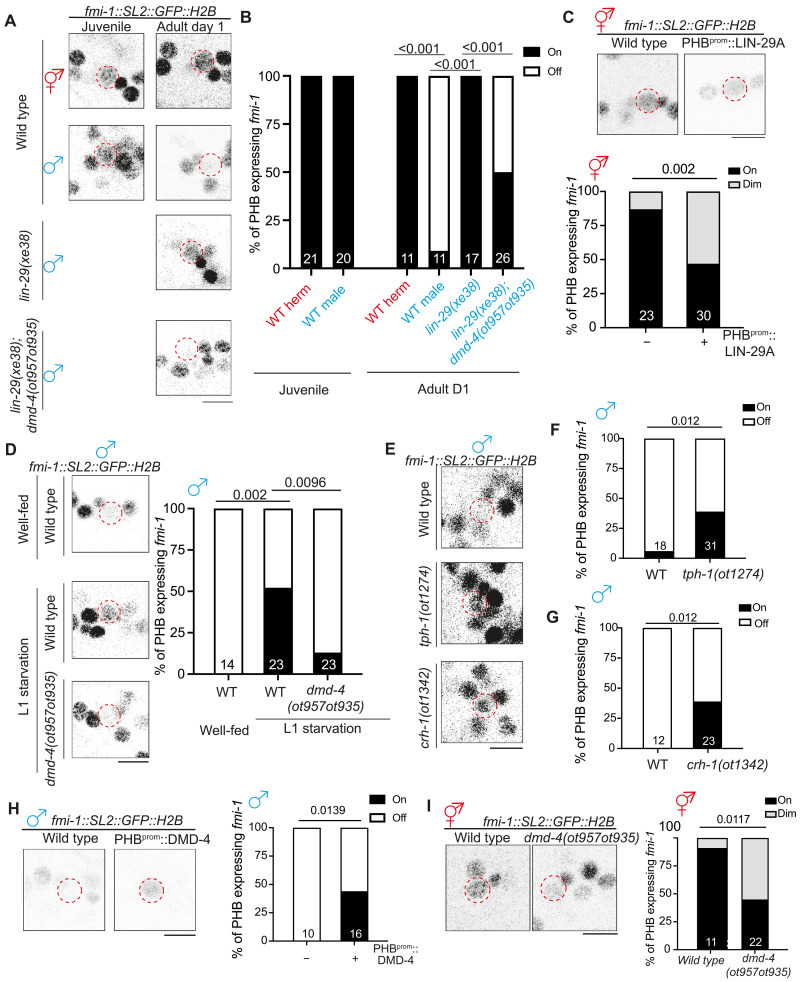
Early-life experience influences subsequent maturation and function of the adult brain, sometimes even in a sex-specific manner, but underlying molecular mechanisms are poorly understood. We describe here how juvenile experience defines sexually dimorphic synaptic connectivity in the adult Caenorhabditis elegans nervous system. Starvation of juvenile males disrupts serotonin-dependent activation of the CREB transcription factor in a nociceptive sensory neuron, PHB. CREB acts through a cascade of transcription factors to control expression of an atypical cadherin protein, FMI-1/Flamingo/CELSR. During postembryonic development, FMI-1 promotes and maintains synaptic connectivity of PHB to a command interneuron, AVA, in both sexes, but a serotonin-dependent transcriptional regulatory cassette antagonizes FMI-1 expression in males, thereby establishing sexually dimorphic connectivity between PHB and AVA. A critical regulatory node is the CREB-target LIN-29, a Zn finger transcription factor that integrates four layers of information: sexual specificity, past experience, time and cell-type specificity. Our findings provide the mechanistic details of how an early juvenile experience defines sexually dimorphic synaptic connectivity.


Figures

Fig. 1.
Fig. 1.. Juvenile serotonin signaling patterns sexually dimorphic synaptic connectivity.
(A and B) Representative images (A) and quantification (B) of PHB>AVA synaptic GRASP(otIs839) in L3 and day 1 well-fed and L1-starved animals in both sexes. (C) Schematic illustration (top) and representative images (bottom) of AVA-juxtaposed GFP::CLA-1 in PHB (otIs883;otEx8040) in L3 and day 1 well-fed and L1-starved animals in both sexes. (D) Quantification of AVA-juxtaposed GFP::CLA-1 in PHB in L3 and day 1 well-fed and L1-starved animals in both sexes. Note for (C) and (D) that the number of AVA-juxtaposed CLA-1 puncta remained sexually dimorphic in the L1-starved adult male, which is consistent with electron micrographic data that show that PHB generates many sex-specific synapses, in addition to AVA (9). (E) Schematic diagram (top) and representative images (bottom) of PHB-juxtaposed AVR-14::TagRFP in in L3 and day 1 well-fed and L1-starved animals in both sexes. (F) Quantification of AVR-14::TagRFP in AVA [otIs902; him-8(e1489)] in L3 and day 1 well-fed and L1-starved animals in both sexes. (G) Schematic diagram (top) and representative images (bottom) of PHB>AVA neurite CD4-GRASP(otEx8152) in L3 and day 1 well-fed and L1-starved animals in both sexes. We measure the GFP-positive length to indicate the PHB/AVA contact site. (H) Quantification of CD4-GRASP(otEx8152) in L3 and day 1 well-fed and L1-starved animals in both sexes. Statistics: [(B), (D), (F), and (H)] Two-way analysis of variance (ANOVA) followed by Bonferroni multiple comparisons test. P value and n numbers are indicated on the graph. + indicates the mean value. Scale bars, 10 μm. A.U., arbitrary units.
Fig. 2.
Fig. 2.. Juvenile starvation controls sexually dimorphic PHB>AVA synaptic contacts via CRH-1/CREB.
(A) Quantification of PHB>AVA synaptic GRASP(otIs839) in well-fed wild-type animals and L1-starved wild-type and animals expressing PHB::GOA-1gof(otEx7925 and otEx8158). (B) Quantification of PHB>AVA synaptic GRASP(otIs839) in wild type and tph-1(ot1274) in both sexes. (C) Quantification of PHB>AVA synaptic GRASP(otIs839) in wild-type and tph-1(ot1274) males expressing PHB::GOA-1gof(otEx7925 and otEx8158). (D) Quantification of PHB>AVA synaptic GRASP(otIs839) in wild-type and crh-1(tz2) and crh-1(ot1342) animals of both sexes. (E) Quantification of PHB>AVA synaptic GRASP(otIs839) in wild-type and crh-1(tz2) males expressing PHB::GOA-1gof(otEx7925 and otEx8158). (F and G) Quantification of PHB>AVA synaptic GRASP(otIs839) in crh-1(tz2) (F) and tph-1(ot1274) (G) males with overexpressing CRH-1 missense allele transgenes (otEx8045 for CRH-1WT, otEx8046 for CRH-1S48E, and otEx8082 for CRH-1S48A) in the PHB neurons. WT, wild type. (H) Schematic diagram indicates juvenile food experience acts through serotonin–G protein–coupled receptor–GOA-1 to activate CRH-1 to secure LIN-29A expression upon sexual maturation to establish PHB>AVA sexually dimorphic connectivity. Statistics: [(A), (C), and (E) to (G)] One-way ANOVA and [(B), (D), and (I)] two-way ANOVA followed by Bonferroni multiple comparisons test. P value and n numbers are indicated on the graph. Scale bars, 10 μm. + indicates the mean value.
Fig. 3.
Fig. 3.. Male-specific LIN-29A expression in PHB is controlled by juvenile serotonin experience via CRH-1/CREB.
(A) lin-29(xe63[gfp::lin-29a]) expression of well-fed and L1-starved day 1 males in the AVA and PHB neurons. lin-29(xe63[gfp::lin-29a]) expression is not affected in the AVA but is dim or lost in the PHB neurons when males undergo L1 starvation. (B) Quantification of the percentage of neurons expressing lin-29(xe63[gfp::lin-29a]) in AVA or PHB under well-fed or L1 starvation conditions. (C) Representative images (top) and quantification (bottom) of PHB neurons expressing lin-29(xe63[gfp::lin-29a]) in wild type and tph-1(ot1274). (D) Representative images (top) and quantification (bottom) of PHB neurons expressing lin-29(xe63[gfp::lin-29a]) in males that undergo L1 starvation with transgene overexpressing GOA-1gof (otEx8037) in the PHB neurons. (E) Representative images (top) and quantification (bottom) of PHB neurons expressing lin-29(xe63[gfp::lin-29a]) in wild type, crh-1(tz2), and crh-1(ot1342). (F) Quantification of PHB neurons expressing lin-29(xe63[gfp::lin-29a]) in animals with or without PHB::GOA-1gof transgene (otEx8037) overexpression in wild-type, tph-1(ot1274), crh-1(tz2), and tph-1(1274); crh-1(tz2) background. (G) Quantification of PHB neurons expressing lin-29(xe63[gfp::lin-29a]) in crh-1(tz2) mutants with overexpressing CRH-1 missense allele transgenes (otEx8053 for CRH-1WT, otEx8157 for CRH-1S48E, and otEx8113 for CRH-1S48A) in the PHB neurons. (H) Quantification of PHB neurons expressing lin-29(xe63[gfp::lin-29a]) in tph-1(ot1274) mutants, overexpressing distinct types of crh-1 transgenes (otEx8053 for CRH-1WT, otEx8157 for CRH-1S48E, and otEx8113 for CRH-1S48A) in the PHB neurons. (I) Top: Schematic illustration of “CREB responsive element” (CRE) sites in the lin-29a locus. The lin-29(ot1396) allele is designed to delete the potential CRE sites at the intron 3 of the lin-29a locus. Bottom: Representative images (left) and quantification of (right) PHB neurons expressing GFP::LIN-29A in wild-type and lin-29(ot1396). Statistics: Chi-square tests followed by Bonferroni multiple comparisons test. P value and n numbers are indicated on the graph. The red dashed circle indicates PHB. Scale bars, 5 μm.
Fig. 4.
Fig. 4.. Early larval lin-29a transcription is regulated by serotonin>CREB signaling.
(A) Representative images (top) and quantification (bottom) of PHB neurons expressing lin-29(xe63[gfp::lin-29a]) in wild-type and ceh-14(ot900) males. (B) Representative images (top) and quantification (bottom) of PHB expressing lin-29(xe63[gfp::lin-29a]) with transgene masculinizing PHB (PHB::FEM-3)(otEX7916) in hermaphrodites. (C) Representative images (top) and quantification (bottom) of PHB expressing lin-29(xe63[gfp::lin-29a]) in hermaphrodites with transgene overexpressing GOA-1gof (otEx8037) in the PHB. (D) Representative images (top) and quantification (bottom) of PHB expressing lin-29(xe63[gfp::lin-29a]) in L3 wild-type and lin-41(ma104) males. (E) Schematic illustration of lin-29(ot1482[lin-29::SL2::GFP::H2B]) and lin-29(ot1500). The lin-29(ot1500) allele is designed to delete the trunk of DNA elements, including the potential CRE site at the intron 3 of the lin-29a locus in lin-29(ot1482). (F and G) Longitudinal analysis of lin-29(ot1482[lin-29::SL2::GFP::H2B]) expression in PHB neuron. Representative images (F) and quantification (G) of expression of PHB neuron expressing lin-29(ot1482[lin-29::SL2::GFP::H2B]) in different time points after food exposure. (H) Representative images (left) and quantification (right) of PHB neurons expressing lin-29(ot1482[lin-29::SL2::GFP::H2B]) in males that undergo L1 starvation after 12 hours of food exposure. (I) Representative images (top) and quantification (bottom) of PHB neurons expressing lin-29(ot1482[lin-29::SL2::GFP::H2B]) in wild type, tph-1(ot1274), crh-1(tz2), and lin-29(ot1500) males after 12 hours of food exposure. Statistics: Chi-square tests followed by Bonferroni multiple comparisons test. P value and n numbers are indicated on the graph. The red dashed circle indicates PHB. Scale bars, 5 μm. + indicates the mean value.
Fig. 5.
Fig. 5.. LIN-29A in PHB is required and sufficient to establish PHB>AVA sexual dimorphic connectivity upon sexual maturation.
(A and B) Representative images (A) and quantification (B) of PHB>AVA synaptic GRASP(otIs839) in day 1 wild type, lin-29(xe38), and lin-29(xe40) in both sexes. (C) Developmental analyses of PHB>AVA synaptic connectivity in wild-type and lin-29a mutants. n > 10 for each genotype and sex at any given time point. (D) Representative images of PHB>AVA neurite CD4-GRASP(otEx8152) in lin-29a mutants in both sexes. (E) Quantification of CD4-GRASP(otEx8152) lin-29a mutants in both sexes. (F) Quantification of SDS-avoidance assay in wild type, lin-29(xe38), and lin-29(xe40). (G) Quantification of PHB>AVA synaptic GRASP in lin-29(xe38) males with transgenes expressing LIN-29A cDNA in either AVA(otEx7763) or PHB (otEx7790 for gpa-6p and otEx7915 for srab-20p). (H) Quantification of PHB>AVA synaptic GRASP in wild-type hermaphrodite with transgenes expressing LIN-29A cDNA in either AVA(otEx7763) or PHB (otEx7790 for gpa-6p and otEx7915 for srab-20p). (I) Quantification of PHB>AVA synaptic GRASP(otIs839) in well-fed wild-type animals and L1-starved wild-type and lin-29(xe38) animals expressing PHB::LIN-29A (otEx7915) or PHB::GOA-1gof(otEx7925 and otEx8158). (J) Epistasis analysis of tph-1 and lin-29a for PHB>AVA synaptic GRASP(otIs839) in males. (K and L) Quantification of PHB>AVA synaptic GRASP in tph-1(ot1274) (K) and tph-1(ot1274) lin-29(xe38) (L) males with transgene overexpressing GOA-1gof (otEx7925) and LIN-29A(otEx7915) in the PHB. Statistics: [(B), (E), (F), and (I)] Two-way ANOVA, (C) three-way ANOVA, and [(G), (H), and (J) to (L)] one-way ANOVA followed by Bonferroni multiple comparisons test. P value and n numbers are indicated on the graph. Scale bars, 10 μm. + indicates the mean value.
Fig. 6.
Fig. 6.. LIN-29A represses DMD-4 in PHB to control sexually dimorphic PHB>AVA connectivity.
(A and B) Representative images (A) and quantification (B) of PHB neurons expressing dmd-4(ot935) in wild-type hermaphrodite and male and lin-29(xe38) male. (C and D) Representative images (C) and quantification (D) of PHB neurons expressing dmd-4(ot935) in well-fed and L1-starved day 1 males. (E to G) Representative images (E) and quantification [(F) and (G)] of PHB neurons expressing dmd-4(ot935) in wild-type, tph-1(ot1274), and crh-1(1342) males. (H and I) Representative images (H) and quantification (I) of PHB neuron expressing dmd-4(ot935) in lin-29(xe38) with transgenes that express LIN-29A cDNA in either PHB (otEx7961 and otEx7964) or PHA (otEx8159 and otEx8160). (J) Epistasis mutant analysis of lin-29a and dmd-4 for PHB>AVA synaptic GRASP(otIs839) in males. (K) Quantification of PHB>AVA synaptic GRASP(otIs839) in wild-type and lin-29(xe38) males with transgene overexpression DMD-4 in either PHB (otEx7984) or PHA(otEx7983). Statistics: [(B), (D), (F), (G), and (I)] Two-proportion Z test and [(J) and (K)] one-way ANOVA followed by Bonferroni multiple comparisons test. P value and n numbers are indicated on the graph. The red dashed circle indicates PHB. Scale bars, 5 μm.
Fig. 7.
Fig. 7.. LIN-29A inhibits fmi-1/Flamingo expression via repressing DMD-4.
(A and B) Representative images (A) and quantification (B) of fmi-1(syb4563) expression in the PHB in early L4 animals and day 1 animals with various genotypes. (C) Representative images (top) and quantification (bottom) of fmi-1(syb4563) expression in the PHB in wild-type hermaphrodites with transgene overexpressing LIN-29A cDNA(otEx7961) in the PHB neurons. (D) Representative images (left) and quantification (right) of fmi-1(syb4563) expression in the PHB in males that underwent L1 starvation. (E to G) Representative images (E) and quantification [(F) and (G)] of fmi-1(syb4563) expression in the PHB in wild-type, tph-1(ot1274), and crh-1(ot1342) males. (H) Representative images (left) and quantification (right) of fmi-1(syb4563) expression in the PHB in wild-type males with transgene overexpressing DMD-4 cDNA (otEx8083) in the PHB neurons. (I) Representative images (left) and quantification (right) of fmi-1(syb4563) expression in the PHB in dmd-4(ot957ot935) hermaphrodites. Statistics: [(B) to (D) and (F) to (I)] Two-proportion Z test, followed by Bonferroni multiple comparisons test. P value and n numbers are indicated on the graph. The red dashed circle indicates PHB. Scale bars, 5 μm. + indicates the mean value.
Fig. 8.
Fig. 8.. FMI-1 acts in PHB to promote the formation of en passant PHB>AVA synapses.
(A and B) Quantification of PHB>AVA synaptic GRASP(otIs839) in fmi-1(ot1291) hermaphrodites (A) and wild-type males (B) with transgenes expressing FMI-1A cDNA (otEx8032 and otEx8033) in the PHB neurons. (C) Quantification of CD4-GRASP(otEx8152) in L3 and day 1 wild-type, fmi-1(ot1291), and fmi-1(ot1291); PHB::FMI-1A. (D) Quantification of CD4-GRASP(otEx8152) in L1 wild-type, fmi-1(ot1291), and fmi-1(ot1291); PHB::FMI-1A. (E) Quantification of PHB>AVA synaptic GRASP(otIs839) in fmi-1(ot1349) hermaphrodite with transgenes expressing Cre pan-neuronally using the UPN driver (50) (otEx8063) or in PHB (otEx8062 and otEx8161) or AVA (otEx8064 and otEx8162). fmi-1(ot1349) is an fmi-1 allele, which fmi-1 locus is flanked with LoxP site and a GFP::H2B tagged at the C-terminal region. (F) Quantification of PHB>AVA synaptic GRASP(otIs839) in fmi-1(ot1349) hermaphrodites with transgenes expressing Cre in heat-shock promoter (otEx8084) and heat shock was performed by indicated time point. (G) Quantification of PHB>AVA synaptic GRASP(otIs839) in fmi-1(ot1349) hermaphrodites with transgenes expressing Cre in heat-shock promoter (otEx8084) and heat shock was performed by indicated time point. (H) Schematic illustration of fmi-1 expression in the lin-29(xe38); fmi-1(ot1349) in heat-shock fmi-1 removal experiment. (I) Quantification of PHB>AVA synaptic GRASP(otIs839) in lin-29(xe38);fmi-1(ot1349) males with transgenes expressing Cre in heat-shock promoter (otEx8084) and heat shock was performed by indicated time point. Statistics: [(A), (B), (D), and (E)] One-way ANOVA and [(C), (F), (G), and (I)] two-way ANOVA followed by Bonferroni multiple comparisons test. P value and n numbers are indicated on the graph. + indicates the mean value.
Fig. 9.
Fig. 9.. Schematic summary of results.
(A) LIN-29A integrates four dimensions of information, including cell identity (CEH-14), sexual identity (TRA-1), temporal identity (LIN-41), and feeding state experience (serotonin–SER-4–CRH-1). (B) Schematic illustration of FMI-1 functions in PHB embryonic and postembryonic developmental stages and adulthood. (C) Schematic illustration of the regulation of LIN-29A>DMD-4>fmi-1 in the nucleus and the corresponding regulation of PHB>AVA neurite adjacency and synaptogenesis.

Update of

References

    1. Herringa R. J., Birn R. M., Ruttle P. L., Burghy C. A., Stodola D. E., Davidson R. J., Essex M. J., Childhood maltreatment is associated with altered fear circuitry and increased internalizing symptoms by late adolescence. Proc. Natl. Acad. Sci. U.S.A. 110, 19119–19124 (2013). - PMC - PubMed
    1. Lupien S. J., McEwen B. S., Gunnar M. R., Heim C., Effects of stress throughout the lifespan on the brain, behaviour and cognition. Nat. Rev. Neurosci. 10, 434–445 (2009). - PubMed
    1. Hiscox L. V., Sharp T. H., Olff M., Seedat S., Halligan S. L., Sex-based contributors to and consequences of post-traumatic stress disorder. Curr. Psychiatry Rep. 25, 233–245 (2023). - PMC - PubMed
    1. Honeycutt J. A., Demaestri C., Peterzell S., Silveri M. M., Cai X., Kulkarni P., Cunningham M. G., Ferris C. F., Brenhouse H. C., Altered corticolimbic connectivity reveals sex-specific adolescent outcomes in a rat model of early life adversity. eLife 9, e52651 (2020). - PMC - PubMed
    1. Bayer E. A., Hobert O., Past experience shapes sexually dimorphic neuronal wiring through monoaminergic signalling. Nature 561, 117–121 (2018). - PMC - PubMed

MeSH terms

LinkOut - more resources