. 2024 Nov 13;16(773):eadr1032.
doi: 10.1126/scitranslmed.adr1032. Epub 2024 Nov 13.

Sex differences and immune correlates of Long Covid development, symptom persistence, and resolution

Affiliations

Sex differences and immune correlates of Long Covid development, symptom persistence, and resolution

Rebecca E Hamlin et al. Sci Transl Med. .

Abstract

Sex differences have been observed in acute coronavirus disease 2019 (COVID-19) and Long Covid (LC) outcomes, with greater disease severity and mortality during acute infection in males and greater proportions of females developing LC. We hypothesized that sex-specific immune dysregulation contributes to LC pathogenesis. To investigate the immunologic underpinnings of LC development and symptom persistence, we performed multiomic analyses on blood samples obtained during acute severe acute respiratory syndrome coronavirus 2 (SARS-CoV-2) infection and 3 and 12 months after infection in a cohort of 45 participants who either developed LC or recovered. Several sex-specific immune pathways were associated with LC. Males who would later develop LC exhibited increases in transforming growth factor-β (TGF-β) signaling during acute infection, whereas females who would go on to develop LC had reduced TGFB1 expression. Females who developed LC demonstrated increased expression of XIST, an RNA gene implicated in autoimmunity, during acute infection compared with females who recovered. Many immune features of LC were also conserved across sexes, such as alterations in monocyte phenotype and activation state. Nuclear factor κB (NF-κB) transcription factors were up-regulated in many cell types at acute and convalescent time points. Those with ongoing LC demonstrated reduced ETS1 expression across lymphocyte subsets and elevated intracellular IL-4 in T cell subsets, suggesting that ETS1 alterations may drive aberrantly elevated T helper cell 2-like responses in LC. Altogether, this study describes multiple innate and adaptive immune correlates of LC, some of which differ by sex, and offers insights toward the pursuit of tailored therapeutics.


Conflict of interest statement

U.S. reports research support from the National Institutes of Health, Agency for Healthcare Research and Quality, and Pfizer Inc.; she is an advisor to Regeneron and Gilead. C.A.B. is an advisor to Immunebridge and DeepCell on topics unrelated to this research. All other authors declare that they have no competing interests.

Figures

Fig. 1.
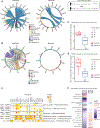
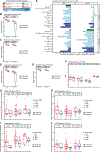
Fig. 1.. BTM differences during acute infection were observed between those who recovered and those who developed LC.
(A) Symptom prevalence of participants with LC at 3 months after acute infection (n = 36) and 12 months after acute infection (n = 12). Cog, cognitive; Const, constitutional; Derm, dermatologic; ENT, ear, nose, and throat; GI, gastrointestinal; MSK, musculoskeletal; Neuro, neurologic; Psych, psychiatric; Pulm, pulmonary; Sleep, sleep disturbance. (B) Experimental design demonstrating use of CyTOF and scRNA-seq for PBMC samples and Olink proteomics for plasma samples. (C) UMAP of scRNA-seq data (subsampled to 100,000 cells to reduce overplotting), with individual cell types further analyzed with MultiNicheNet for cell-cell communication inference and BioNet for gene network analysis. (D) BTMs of samples during acute infection that differentiated individuals with LC versus those who recovered by 3 months after infection for males and females combined. Only modules in which >10% of the constituent genes had an absolute log2 fold change (log2FC) >0.25 are plotted. Red tiles indicate higher expression in individuals who developed LC, and blue tiles indicate lower expression. (E) Participants included in acute SARS-CoV-2 infection analysis, separated by sex and LC versus recovered status at 3 months after infection. (F) BTMs during acute infection that differentiated those with LC versus those who recovered by 3 months after infection. Males and females are plotted separately. The top 50 modules, by percentage of genes, in which >10% of the constituent genes had an absolute log2FC >0.25, are plotted. Red tiles indicate higher expression in individuals who developed LC, and blue tiles indicate lower expression.
Fig. 2.
Fig. 2.. Proliferating NK cells exhibited different transcriptional profiles in males during acute infection based on LC status.
(A and B) Predicted ligand-receptor interactions involving proliferating NK cells, separated by development of LC symptoms 3 months after acute infection versus resolution of symptoms by 3 months, showing signaling sent from proliferating NK cells (A) and signaling received by proliferating NK cells (B). Arrows point from ligand to receptor. (C and D) Boxplots demonstrating mean normalized expression of TGFB1 (C) and TGFBR1 (D) during acute infection in males. (E) Target genes with altered expression in proliferating NK cells of acutely infected males who go on to develop LC at 3 months are shown with associated upstream ligand-receptor interactions. Tile color in the heatmap indicates the Pearson correlation coefficient of expression of the ligand-receptor pair and the target gene. Cell-cell communication analyses were performed with MultiNicheNet, which uses pseudobulk aggregation followed by edgeR analysis. (F) Pseudobulk IL7R expression by cell type during acute infection, separated by sex. Tile color in the heatmap indicates log2FC, with higher expression in those who will develop LC at 3 months after infection indicated by red and lower expression indicated by blue.
Fig. 3.
Fig. 3.. TGFB1 expression differs by sex in those who develop LC.
(A) Log2FC of pseudobulk expression of TGFB1 gene during acute infection, separated by sex. Bars to the right of the dashed line indicate increased expression and bars to the left indicate reduced expression in those who will develop LC at 3 months after infection. Myeloid cells are represented by orange bars, NK cells by green bars, T cells by light blue bars, and B cells by dark blue bars. (B to D) Boxplots of mean expression of TGFB1 by participant during acute infection shows reductions in females who develop LC in NK cells (B), CD8+ TEM cells (C), and CD4+ TCM cells (D). * indicates locally adjusted P < 0.05 for differential gene expression by MAST, comparing those who go on to develop LC versus those who were recovered by 3 months. (E) Boxplot of normalized protein expression (NPX) of LAP TGF-β1 in plasma during acute infection, separated by sex. * indicates unadjusted P < 0.05 by Wilcoxon rank sum test between those who will go on to develop LC versus recover at 3 months after infection.
Fig. 4.
Fig. 4.. Sex-specific differences in inflammatory monocytes are present during acute SARS-CoV-2 infection.
(A and B) Inferred cell-cell communication, separated by development of LC symptoms 3 months after acute infection (n = 6) versus resolution of symptoms by 3 months (n = 3), toward CD14+ monocytes (A) and CD16+ monocytes (B) in males. (C) Cell-cell communication inference, separated by development of LC symptoms 3 months after acute infection (n = 9) versus resolution of symptoms by 3 months (n = 3), toward CD14+ monocytes in females. Cell-cell communication analyses were performed with MultiNicheNet, which uses pseudobulk aggregation followed by edgeR analysis. (D) Differential gene network in CD14+ monocytes in females during acute infection (false discovery rate 1 × 10⁻⁵). Red nodes indicate higher expression (log2FC) in those who will develop LC, and blue nodes indicate lower expression. Light orange shading highlights an interferon-stimulated gene subnetwork. (E) Cell-cell communication inference, separated by development of LC symptoms 3 months after acute infection versus resolution of symptoms by 3 months, toward CD16+ monocytes in females. (F) Differential gene network in CD16+ monocytes in females during acute infection (false discovery rate 1 × 10⁻¹⁰). Red nodes indicate higher expression (log2FC) in those who will develop LC, and blue nodes indicate lower expression. Light orange shading highlights an interferon-stimulated gene subnetwork.
Fig. 5.
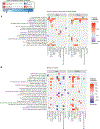
Fig. 5.. BTMs at 3 and 12 months differ between those who recover and individuals with LC.
(A) BTMs at 3 months after acute infection, separated by sex, which differentiate those with ongoing LC at 12 months after infection versus those who will recover by 12 months. (B) BTMs at 12 months after acute infection, separated by sex, which differentiate those with ongoing LC at 12 months after infection versus those who recovered between 3 and 12 months. The top 50 modules, by percentage of genes, in which >10% of the constituent genes had an absolute log2FC >0.25, are plotted. Red tiles indicate higher expression in individuals with LC, and blue tiles indicate lower expression.
Fig. 6.
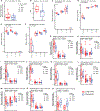
Fig. 6.. Inflammatory markers and ISG expression are increased in monocytes of individuals with ongoing LC.
(A) Boxplot of mean normalized IL1B expression for each participant is shown for CD14+ monocytes of those with LC at 12 months after acute infection. (B) Boxplot of IL-1α abundance is shown for those with LC at 12 months by plasma proteomics. (C to F) Boxplots of median signal intensity by CyTOF of intracellular CXCL10, IL-6, IL-1β, and TNF-α in unstimulated CD14+ monocytes (C), in vitro stimulated CD14+ monocytes (D), unstimulated CD16+ monocytes (E), and in vitro stimulated CD16+ monocytes (F) at 12 months after acute infection. * indicates unadjusted P < 0.05, ** indicates unadjusted P < 0.01, and *** indicates unadjusted P < 0.001 by Wilcoxon rank sum test. (G to N) Boxplots demonstrating expression during acute infection and 3 and 12 months after infection in CD14+ monocytes are shown for EPSTI1 (G), GBP2 (H), HERC5 (I), IFI44L (J), IFIT3 (K), LAP3 (L), UBE2D1 (M), and PARP9 (N). 3 mo, 3 months; 12 mo, 12 months. (O) CD86 expression in CD14+ monocytes is shown for samples collected at 3 and 12 months after acute infection. * indicates locally adjusted P < 0.05 for differential gene expression by MAST.
Fig. 7.
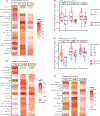
Fig. 7.. Increased expression of NF-κB transcription factors is associated with LC development and symptom persistence.
(A) Pseudobulk expression of NFKB1 across cell types is shown in samples collected during acute infection (n = 21) and at 3 and 12 months after infection (n = 23). (B and C) Boxplots of NFKB1 expression are shown by participants in CD8+ TEM cells (B) and CD4+ TCM cells (C) during acute infection and 3 and 12 months later. (D and E) Pseudobulk expression of RELB (D) and REL (E) is shown across cell types during acute infection and at 3 and 12 months after infection. For (A), (D), and (E), red tiles indicate higher expression (log2FC) in LC, and blue tiles indicate lower expression. * indicates locally adjusted P < 0.05 for differential gene expression by MAST.
Fig. 8.
Fig. 8.. ETS1 expression and IL-4 production distinguish those with persistent LC from those who recover.
(A) Log2FC of pseudobulk ETS1 expression at 3 and 12 months after infection, comparing those with LC at 3 and 12 months versus those with LC at 3 months but recovery by 12 months, separated by sex. NK cells are represented by green bars, T cells by light blue bars, and B cells by dark blue bars. (B to E) Boxplots showing intracellular IL-4 as measured using CyTOF in CD4+ and CD8+ T cells at 3 months in unstimulated (B) and in vitro stimulated (C) samples and at 12 months after infection in unstimulated (D) and in vitro stimulated (E) samples, comparing those with ongoing LC at 3 and 12 months versus those with LC at 3 months but recovery by 12 months. (F) Boxplot of normalized protein expression (NPX) of common TH2 cell immune cytokines IL-13, IL-33, IL-4, and IL-5 in plasma. * indicates unadjusted P < 0.05, ** indicates unadjusted P < 0.01, *** indicates unadjusted P < 0.001, and **** indicates unadjusted P < 0.0001 by Wilcoxon rank sum test. (G to J) Boxplots demonstrating CD8+ TEM cell expression of NKG2C (G), ABCB1 (H), ITGAM (I), and CTBP2 (J) are shown by participants during acute infection and 3 and 12 months later. * indicates locally adjusted P < 0.05 for differential gene expression by MAST.

Update of

References

    1. World Health Organization Coronavirus (COVID-19) Dashboard; https://covid19.who.int.
    1. World Health Organization, “Coronavirus disease (COVID-19): Post COVID-19 condition,” 28 March 2023; https://who.int/news-room/questions-and-answers/item/coronavirus-disease....
    1. Klein J, Wood J, Jaycox J, Dhodapkar RM, Lu P, Gehlhausen JR, Tabachnikova A, Greene K, Tabacof L, Malik AA, Monteiro VS, Silva J, Kamath K, Zhang M, Dhal A, Ott IM, Valle G, Peña-Hernandez M, Mao T, Bhattacharjee B, Takahashi T, Lucas C, Song E, Mccarthy D, Breyman E, Tosto-Mancuso J, Dai Y, Perotti E, Akduman K, Tzeng TJ, Xu L, Geraghty AC, Monje M, Yildirim I, Shon J, Medzhitov R, Lutchmansingh D, Possick JD, Kaminski N, Omer SB, Krumholz HM, Guan L, Dela Cruz CS, van Dijk D, Ring AM, Putrino D, Iwasaki A, Distinguishing features of long COVID identified through immune profiling. Nature 623, 139–148 (2023). - PMC - PubMed
    1. Su Y, Yuan D, Chen DG, Ng RH, Wang K, Choi J, Li S, Hong S, Zhang R, Xie J, Kornilov SA, Scherler K, Pavlovitch-Bedzyk AJ, Dong S, Lausted C, Lee I, Fallen S, Dai CL, Baloni P, Smith B, Duvvuri VR, Anderson KG, Li J, Yang F, Duncombe CJ, McCulloch DJ, Rostomily C, Troisch P, Zhou J, Mackay S, DeGottardi Q, May DH, Taniguchi R, Gittelman RM, Klinger M, Snyder TM, Roper R, Wojciechowska G, Murray K, Edmark R, Evans S, Jones L, Zhou Y, Rowen L, Liu R, Chour W, Algren HA, Berrington WR, Wallick JA, Cochran RA, Micikas ME; ISB-Swedish COVID-19 Biobanking Unit, Wrin T, Petropoulos CJ, Cole HR, Fischer TD, Wei W, Hoon DSB, Price ND, Subramanian N, Hill JA, Hadlock J, Magis AT, Ribas A, Lanier LL, Boyd SD, Bluestone JA, Chu H, Hood L, Gottardo R, Greenberg PD, Davis MM, Goldman JD, Heath JR, Multiple early factors anticipate post-acute COVID-19 sequelae. Cell 185, 881–895.e20 (2022). - PMC - PubMed
    1. Phetsouphanh C, Darley DR, Wilson DB, Howe A, Munier CML, Patel SK, Juno JA, Burrell LM, Kent SJ, Dore GJ, Kelleher AD, Matthews GV, Immunological dysfunction persists for 8 months following initial mild-to-moderate SARS-CoV-2 infection. Nat. Immunol 23, 210–216 (2022). - PubMed

Publication types