. 2024 Dec:78:103413.
doi: 10.1016/j.redox.2024.103413. Epub 2024 Oct 30.

Riboflavin kinase binds and activates inducible nitric oxide synthase to reprogram macrophage polarization

Affiliations

Riboflavin kinase binds and activates inducible nitric oxide synthase to reprogram macrophage polarization

Xiao Shan et al. Redox Biol. 2024 Dec.

Abstract

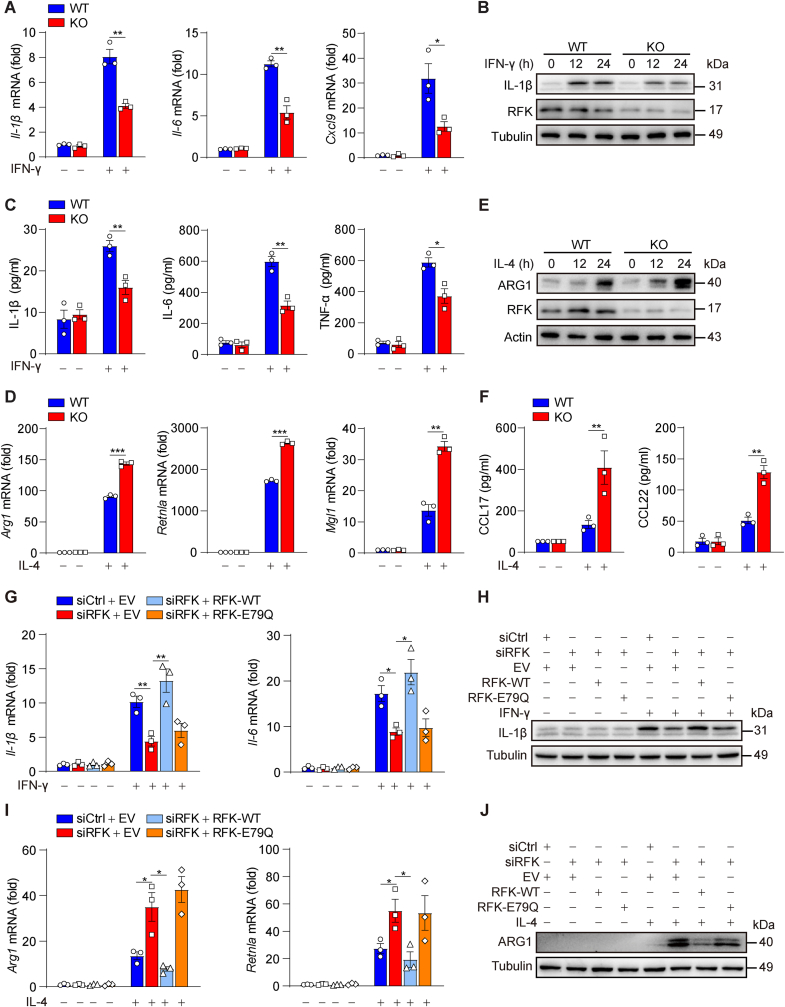
Riboflavin kinase (RFK) is essential in riboflavin metabolism, converting riboflavin to flavin mononucleotide (FMN), which is further processed to flavin adenine dinucleotide (FAD). While RFK enhances macrophage phagocytosis of Listeria monocytogenes, its role in macrophage polarization is not well understood. Our study reveals that RFK deficiency impairs M(IFN-γ) and promotes M(IL-4) polarization, both in vitro and in vivo. Mechanistically, RFK interacts with inducible nitric oxide (NO) synthase (iNOS), which requires FMN and FAD as cofactors for activation, leading to increased NO production that alters energy metabolism by inhibiting the tricarboxylic acid cycle and mitochondrial electron transport chain. Exogenous FAD reverses the metabolic and polarization changes caused by RFK deficiency. Furthermore, bone marrow adoptive transfer from high-riboflavin-fed mice into wild-type tumor-bearing mice reprograms tumor-associated macrophage polarization and inhibits tumor growth. These results suggest that targeting RFK-iNOS or modulating riboflavin metabolism could be potential therapies for macrophage-related immune diseases.

Keywords: Inducible nitric oxide synthase; Macrophage polarization; Riboflavin kinase.


Conflict of interest statement

Declaration of competing interest The authors declare that they have no known competing financial interests or personal relationships that could have appeared to influence the work reported in this paper.

Figures

Fig. 1
Fig. 1
RFK promotes M(IFN-γ) but inhibits M(IL-4) polarization through its enzyme activity. A–C Bone marrow-derived macrophages (BMDMs) of Rfkfl/flLyz2-Cre- (WT) and Rfkfl/flLyz2-Cre+ (KO) mice were stimulated with IFN-γ for 12 h or the indicated times, followed by detection of the intracellular or secreted levels of M1 marker expression by qPCR (A) or Western blot (B) or ELISA analysis (C). D–F RFK-WT and RFK-KO BMDMs were stimulated with IL-4 for 24 h or the indicated times, followed by detection of the intracellular or secreted levels of M2 marker expression by qPCR (D) or Western blot (E) or ELISA analysis (F). G–J RAW264.7 cells were transfected with siControl or siRFK, together with an RNA interference (RNAi)-resistant FLAG-tagged WT-RFK ectopic expression plasmid or an RFK enzyme activity mutation plasmid (E79Q), and then stimulated either with IFN-γ for 12 h to detect M1 marker expression, or with IL-4 for 24 h to detect M2 marker expression, by qPCR (G, I) or Western blot (H, J). Data are presented as mean ± SEM. n = 3 per group (A, C, D, F, G, and I). ∗p < 0.05, ∗∗p < 0.01, ∗∗∗p < 0.001.
Fig. 2
Fig. 2
RFK regulates macrophage polarization in vivo. A–F RFK-WT-Mφ and RFK-KO-Mφ mice were subcutaneously injected with 2 × 106 Hepa1-6 cells per mouse. Tumor volume was calculated every 2 days beginning 5 days after cell inoculation (A). Excised tumor and tumor weights on the 25th day are shown (B). Immunohistochemical staining were performed on tumor sections of RFK-WT-Mφ and RFK-KO-Mφ mice with the indicated antibodies; representative images are shown. Scale bars, 50 μm. Histological semiquantification was performed (C). The proportions of monocytes (P1, CD11b+Ly6GLy6Chigh) and neutrophils (P2, CD11b+Ly6G+Ly6Clow) in tumor tissues of RFK-WT-Mφ and RFK-KO-Mφ mice were analyzed by flow cytometry (D). Representative fluorescence-activated cell sorting (FACS) and quantification of macrophages (P1, F4/80+CD11b+) sorted from tumor tissues of RFK-WT-Mφ and RFK-KO-Mφ mice (E), and the expression of Il-1β and Arg1 was detected by qPCR (F). Data are presented as mean ± SEM. n = 6 per group (D–F); n = 9 per group (A and B); n = 10 per group (C). ∗p < 0.05, ∗∗p < 0.01, ∗∗∗p < 0.001.
Fig. 3
Fig. 3
RFK modulates macrophage polarization through FAD. A–D RFK-WT and RFK-KO BMDMs were pretreated with FAD for 6 h and then stimulated with IFN-γ for 12 h or IL-4 for 24 h, to detect M1 or M2 marker expression by qPCR (A, C) or Western blot (B, D). Data are presented as mean ± SEM. n = 3 per group (A, C). NS, not significant (p ≥ 0.05), ∗p < 0.05, ∗∗p < 0.01, ∗∗∗p < 0.001.
Fig. 4
Fig. 4
RFK regulates macrophage polarization through NO. A RFK-WT and RFK-KO BMDMs were stimulated with LPS + IFN-γ or IFN-γ for the indicated times and the concentration of NO in the cell culture supernatant was then determined. B–E RFK-WT and RFK-KO BMDMs were pretreated with NO donor for 6 h and then stimulated with IFN-γ for 12 h or IL-4 for 24 h, followed by detection of M1 or M2 marker expression by qPCR (B, D) or Western blot (C, E). F–I RFK-WT and RFK-KO BMDMs were pretreated with AG for 6 h and then stimulated with IFN-γ for 12 h or IL-4 for 24 h, followed by detection of M1 or M2 marker expression by qPCR (F, H) or Western blot (G, I). Data are presented as mean ± SEM. n = 3 per group (A, B, D, F, and H). NS, not significant (p ≥ 0.05), ∗p < 0.05, ∗∗p < 0.01, ∗∗∗p < 0.001.
Fig. 5
Fig. 5
RFK deficiency modulates energy metabolism through NO-mediated remodeling of the TCA cycle and mitochondrial electron transport chain. A–D Analysis of extracellular acidification rate (ECAR) or oxygen consumption rate (OCR) of RFK-WT and RFK-KO PEMs by Seahorse assay. WT and KO PEMs were pretreated with NO donor for 6 h and then stimulated with IFN-γ for 12 h or IL-4 for 24 h. ECAR was analyzed by addition of glucose, oligomycin, and 2-deoxy-d-glucose (A, B). OCR was analyzed by addition of oligomycin, FCCP, and antimycin A plus rotenone (C, D). E–J RFK-WT and RFK-KO PEMs were pretreated with NO donor for 6 h and then stimulated with IFN-γ for 12 h or with IL-4 for 24 h, followed by analysis of PDH, IDH2, and ACO2 activities (E–G), citrate concentration (H), or mitochondrial complex activities (I, J). Data are presented as mean ± SEM. n = 3 per group (E–J); n = 4 per group (B and D); n = 5 per group (A and C). NS, not significant (p ≥ 0.05), ∗p < 0.05, ∗∗p < 0.01, ∗∗∗p < 0.001.
Fig. 6
Fig. 6
RFK interacts with iNOS and boosts iNOS activity. A Immunoprecipitation of exogenous iNOS-hemagglutinin (HA) with an anti-HA antibody and Western blot analyses with the indicated antibodies were performed using HEK293T cell extracts. B Immunoprecipitation of endogenous RFK with an anti-iNOS antibody and Western blot analyses with the indicated antibodies were performed using RAW264.7 cell extracts. C, D A His pulldown assay (C) or a GST pulldown (D) assay was performed by mixing bacterially expressed His-iNOS and GST-RFK. E HEK293T cells were transfected with plasmids expressing RFK and iNOS-WT, iNOS (aa 1–500), or iNOS (aa 501–1144); immunoprecipitation was conducted with an anti-HA antibody and Western blot analyses with the indicated antibodies. F, G A streptavidin pulldown assay was performed. Biotin-tagged scrambled, RFK (aa 1–30), RFK (aa 60–92), or RFK (aa 100–130) peptides were incubated with lysates from iNOS-HA overexpressing HEK293T cells (F) or bacterially expressed His-iNOS (G). H iNOS and RFK mutants were expressed in HEK293T cells. Immunoprecipitation of exogenous RFK-FLAG mutants with an anti-FLAG antibody and Western blot analyses with the indicated antibodies were performed. I, J RFK-WT and RFK-KO PEMs were transfected with plasmids expressing RFK or the indicated RFK mutation, and then stimulated with IFN-γ for 12 h. Immunoprecipitation with an anti-iNOS antibody and Western blot analyses were performed with the indicated antibodies. iNOS activity was analyzed normalized to the amount of immunoprecipitated iNOS, determined by densitometry of western blots. K, L RFK-WT and RFK-KO PEMs were transfected with an RNA interference (RNAi)-resistant RFK ectopic expression plasmid, RFK-S64A or RFK-Y91A mutation plasmid, pretreated with FAD/FAD + AG/FAD + 2-DG for 6 h, and then stimulated with IFN-γ for 12 h or with IL-4 for 24 h, followed by detection of M1 (K) or M2 (L) marker expression by qPCR. Data are presented as mean ± SEM. n = 3 per group (the upper panels of J, and K, L); n = 4 per group (the lower panels of J). ∗p < 0.05, ∗∗p < 0.01, ∗∗∗p < 0.001.
Fig. 7
Fig. 7
High riboflavin diet inhibits tumor progression. A–H Schematic overview of bone marrow (BM) adoptive transfer, tumor induction, and analysis (A). C57BL/6 mice were fed normal or high riboflavin diet for 2 weeks then the FAD concentration in BMs was measured (B). BMs were then stimulated with either LPS + IFN-γ or IFN-γ for 12 h to detect M1 marker expression (C, D), or stimulated with IL-4 for 24 h to detect M2 marker expression (E) by qPCR. C57BL/6 mice were subcutaneously injected with 2 × 106 E0771 cells per mouse, tumor volume was calculated every 2 days beginning 5 days after cell inoculation. Seven days later, BMs of mice fed normal or high riboflavin diet for 2 weeks were intraperitoneally injected into mice inoculated with E0771 cells (once every 5 days, 5 times); excised tumor and tumor weights on the 31st day are shown (F, G). Immunohistochemical staining was performed with the indicated antibodies on tumor sections. Representative images are shown (H). Scale bars, 100 μm. Histological semiquantification was performed. Data are presented as mean ± SEM. n = 3 per group (CE); n = 5 per group (B and G); n = 6 per group (F and H). ∗p < 0.05, ∗∗p < 0.01, ∗∗∗p < 0.001.
Fig. 8
Fig. 8
RFK interacts with and activates iNOS to orchestrate macrophage polarization. RFK deletion significantly inhibits M(IFN-γ) polarization, but enhances M(IL-4) polarization. Exogenous FAD or riboflavin supplementation could regulate macrophage polarization both in vitro and in vivo. RFK interacts with iNOS and enhances iNOS catalytic activity and NO production, which modulate macrophage polarization by reprogramming TCA cycle and mitochondrial electron transport chain.

References

    1. Funes S.C., Rios M., Escobar-Vera J., Kalergis A.M. Implications of macrophage polarization in autoimmunity. Immunology. 2018;154(2):186–195. - PMC - PubMed
    1. Wynn T.A., Chawla A., Pollard J.W. Macrophage biology in development, homeostasis and disease. Nature. 2013;496(7446):445–455. - PMC - PubMed
    1. Glass C.K., Natoli G. Molecular control of activation and priming in macrophages. Nat. Immunol. 2016;17(1):26–33. - PMC - PubMed
    1. Sica A., Mantovani A. Macrophage plasticity and polarization: in vivo veritas. J. Clin. Invest. 2012;122(3):787–795. - PMC - PubMed
    1. Murray P.J., Allen J.E., Biswas S.K., Fisher E.A., Gilroy D.W., Goerdt S., Gordon S., Hamilton J.A., Ivashkiv L.B., Lawrence T., Locati M., Mantovani A., Martinez F.O., Mege J.L., Mosser D.M., Natoli G., Saeij J.P., Schultze J.L., Shirey K.A., Sica A., Suttles J., Udalova I., van Ginderachter J.A., Vogel S.N., Wynn T.A. Macrophage activation and polarization: nomenclature and experimental guidelines. Immunity. 2014;41(1):14–20. - PMC - PubMed

Publication types

MeSH terms

LinkOut - more resources