

Windows of susceptibility and joint effects of prenatal and postnatal ambient air pollution and temperature exposure on asthma and wheeze in Mexican children
- PMID: 39536662
- PMCID: PMC11622388
- DOI: 10.1016/j.envint.2024.109122
Windows of susceptibility and joint effects of prenatal and postnatal ambient air pollution and temperature exposure on asthma and wheeze in Mexican children
Abstract
Introduction: Prenatal and early-life exposure to air pollution and extreme temperatures are associated with childhood asthma and wheeze. However, potential windows of susceptibility and their sex-specific and interactive effects have not been fully elucidated. We aimed to identify critical windows of susceptibility and evaluate sex-specific effects in these associations, and evaluate exposure interactions.
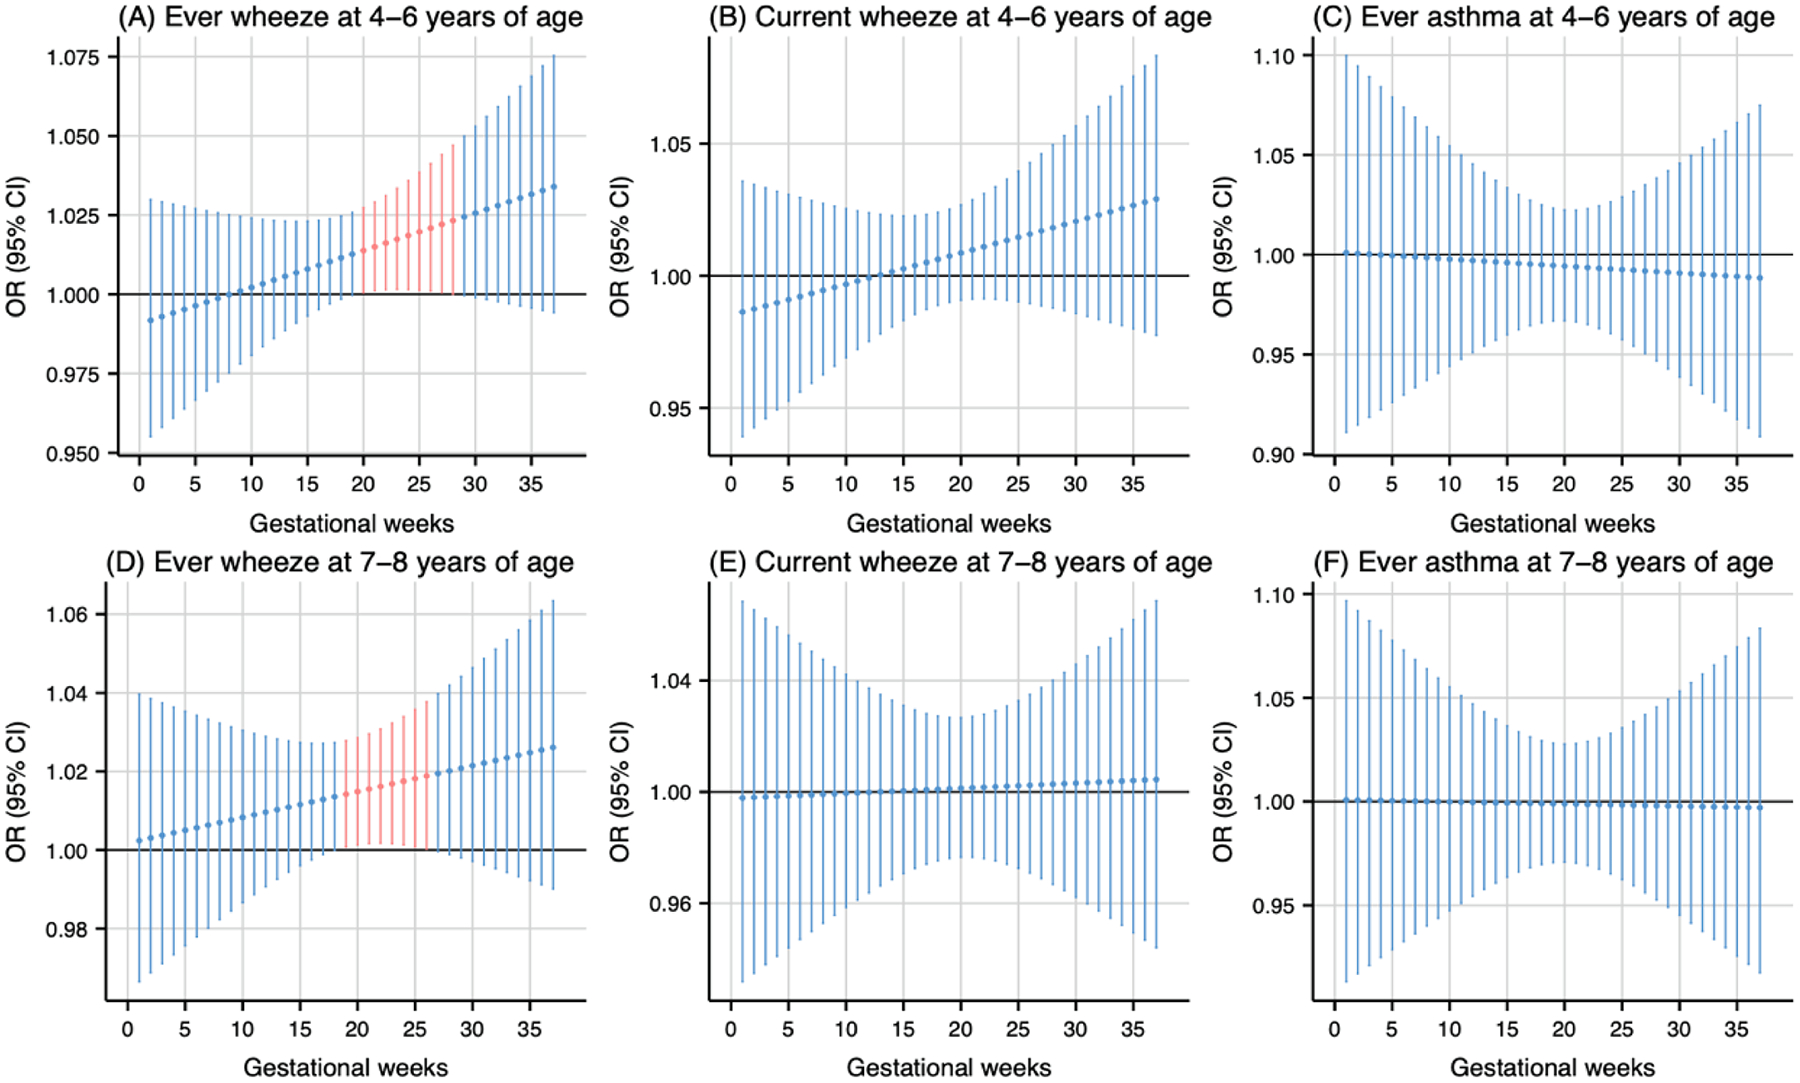
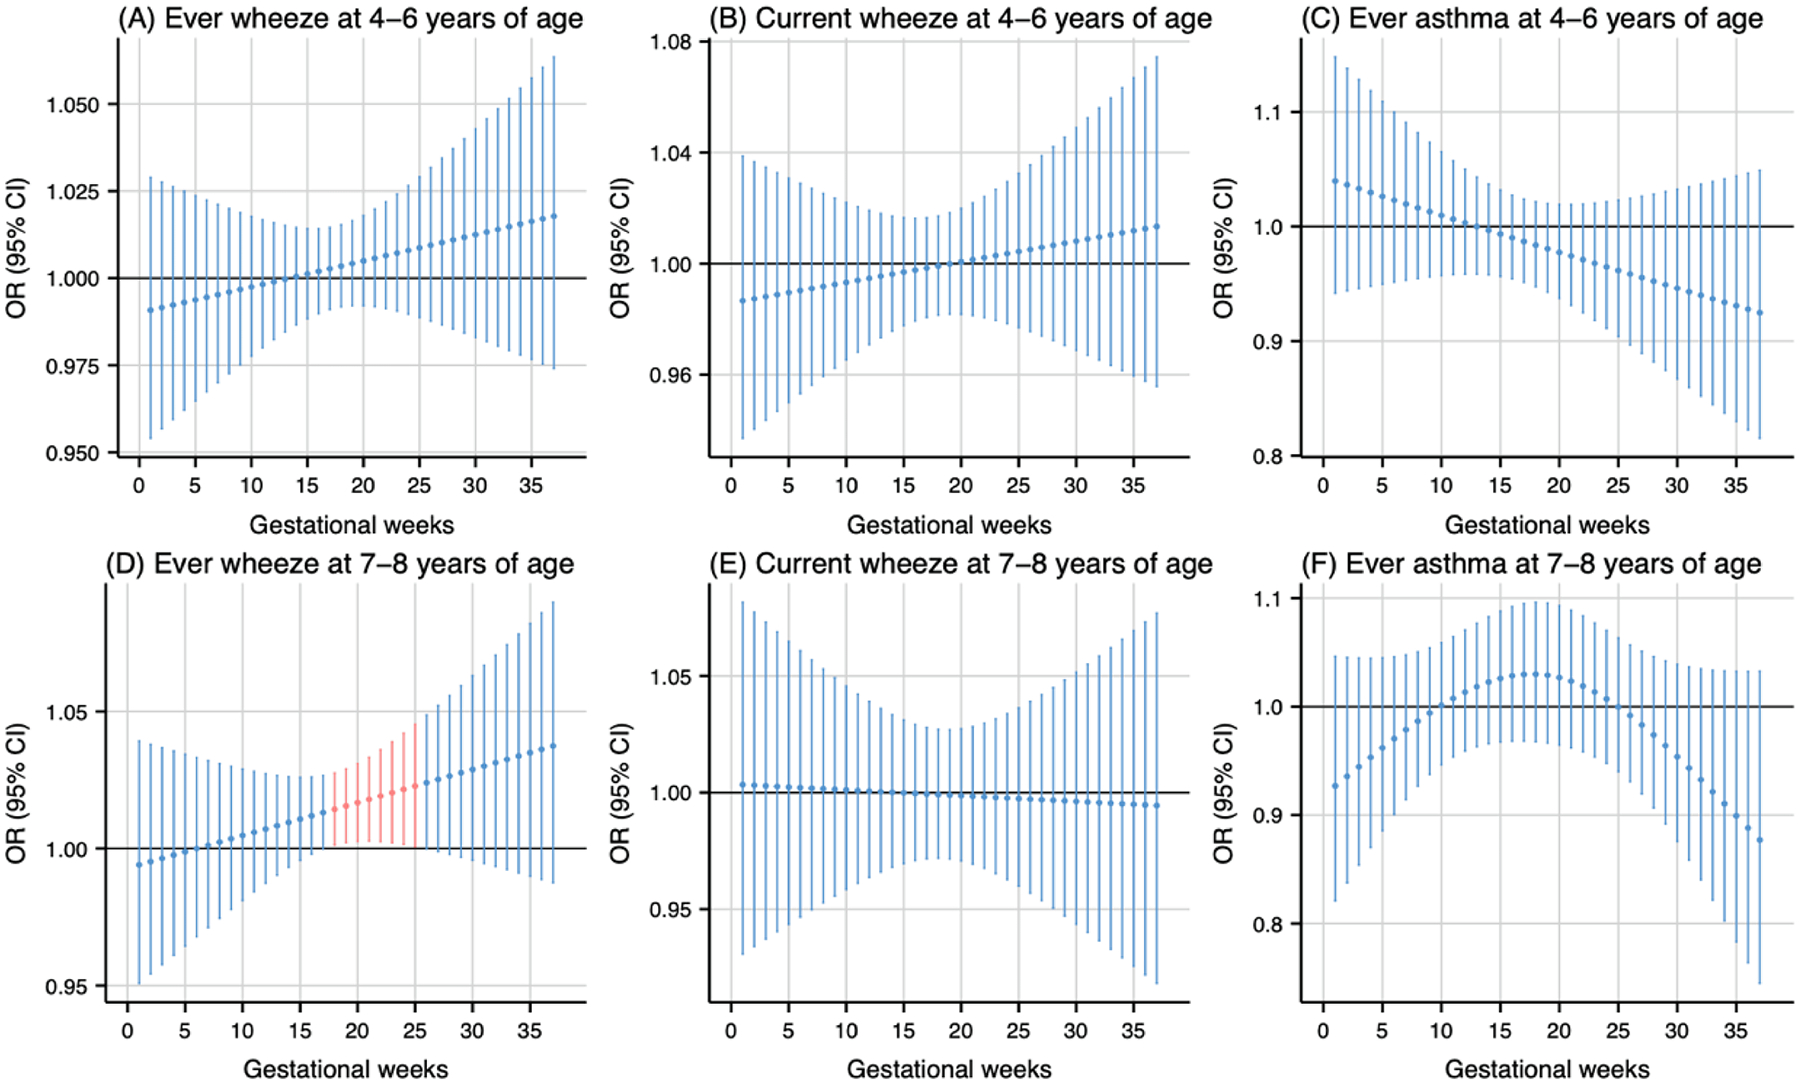
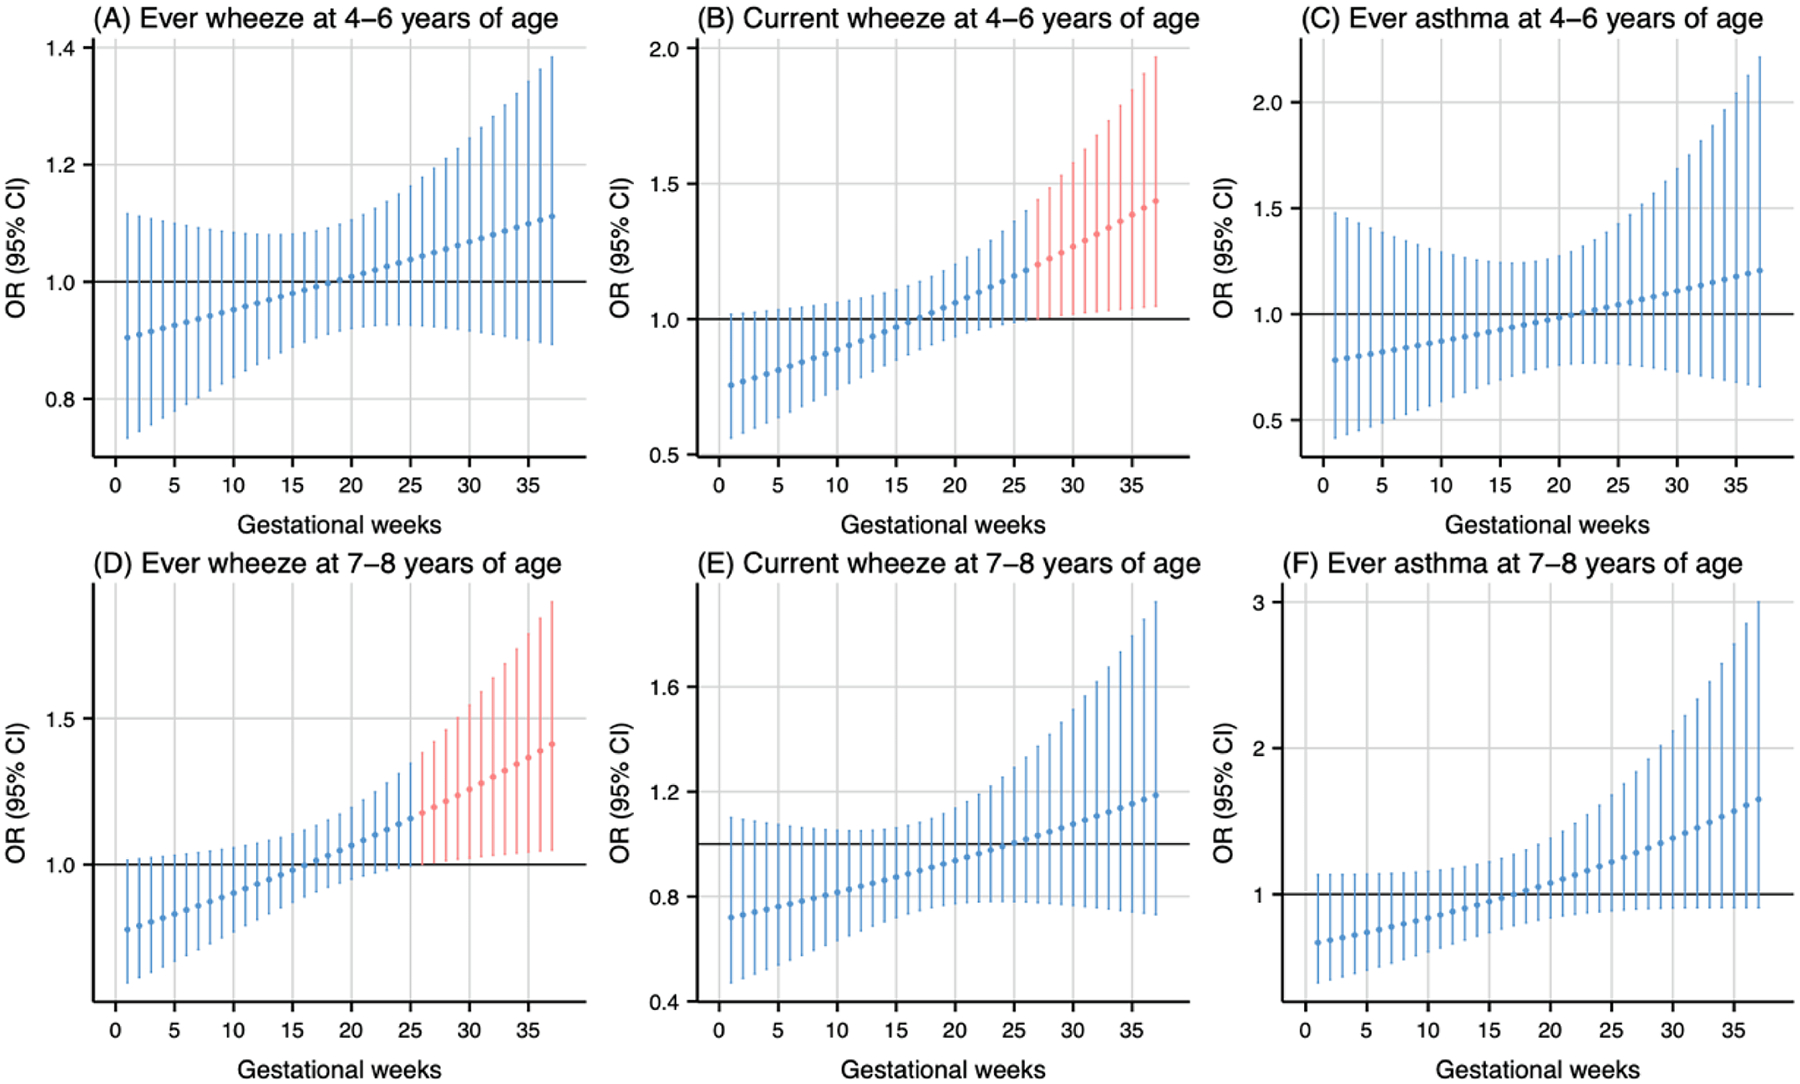
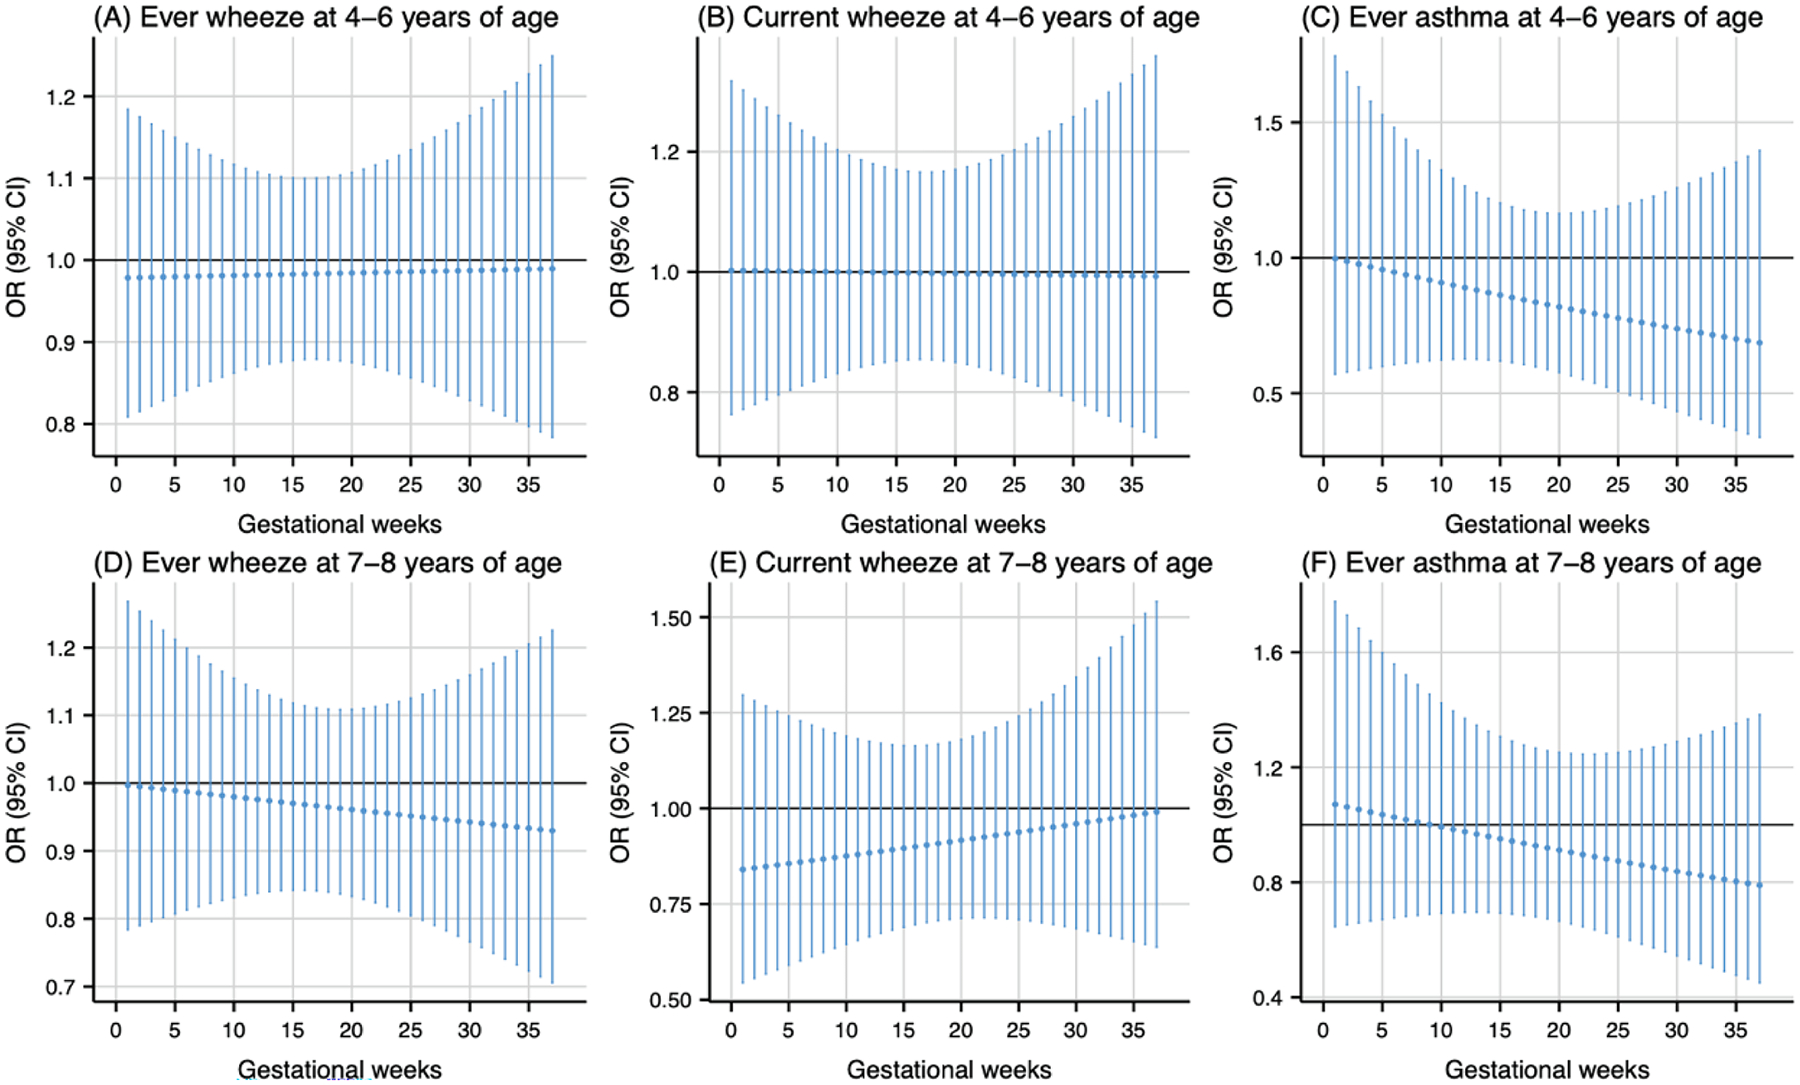
Methods: We analyzed data from 468 mother-child pairs enrolled in the PROGRESS birth cohort in Mexico City. Daily residential levels of PM2.5, NO2, and temperature were generated from our validated spatiotemporally resolved models from conception to age 4 years. Childhood asthma and wheeze outcomes were collected at 4-6 and 7-8 years. Distributed lag nonlinear models (DLNMs) were used to identify susceptible windows for prenatal weekly-specific and postnatal monthly-specific associations of air pollution and temperature with respiratory outcomes adjusting for covariates. To evaluate sex-specific effects, DLNMs were stratified. Joint effects were assessed using relative excess risk due to interaction and attributable proportion.
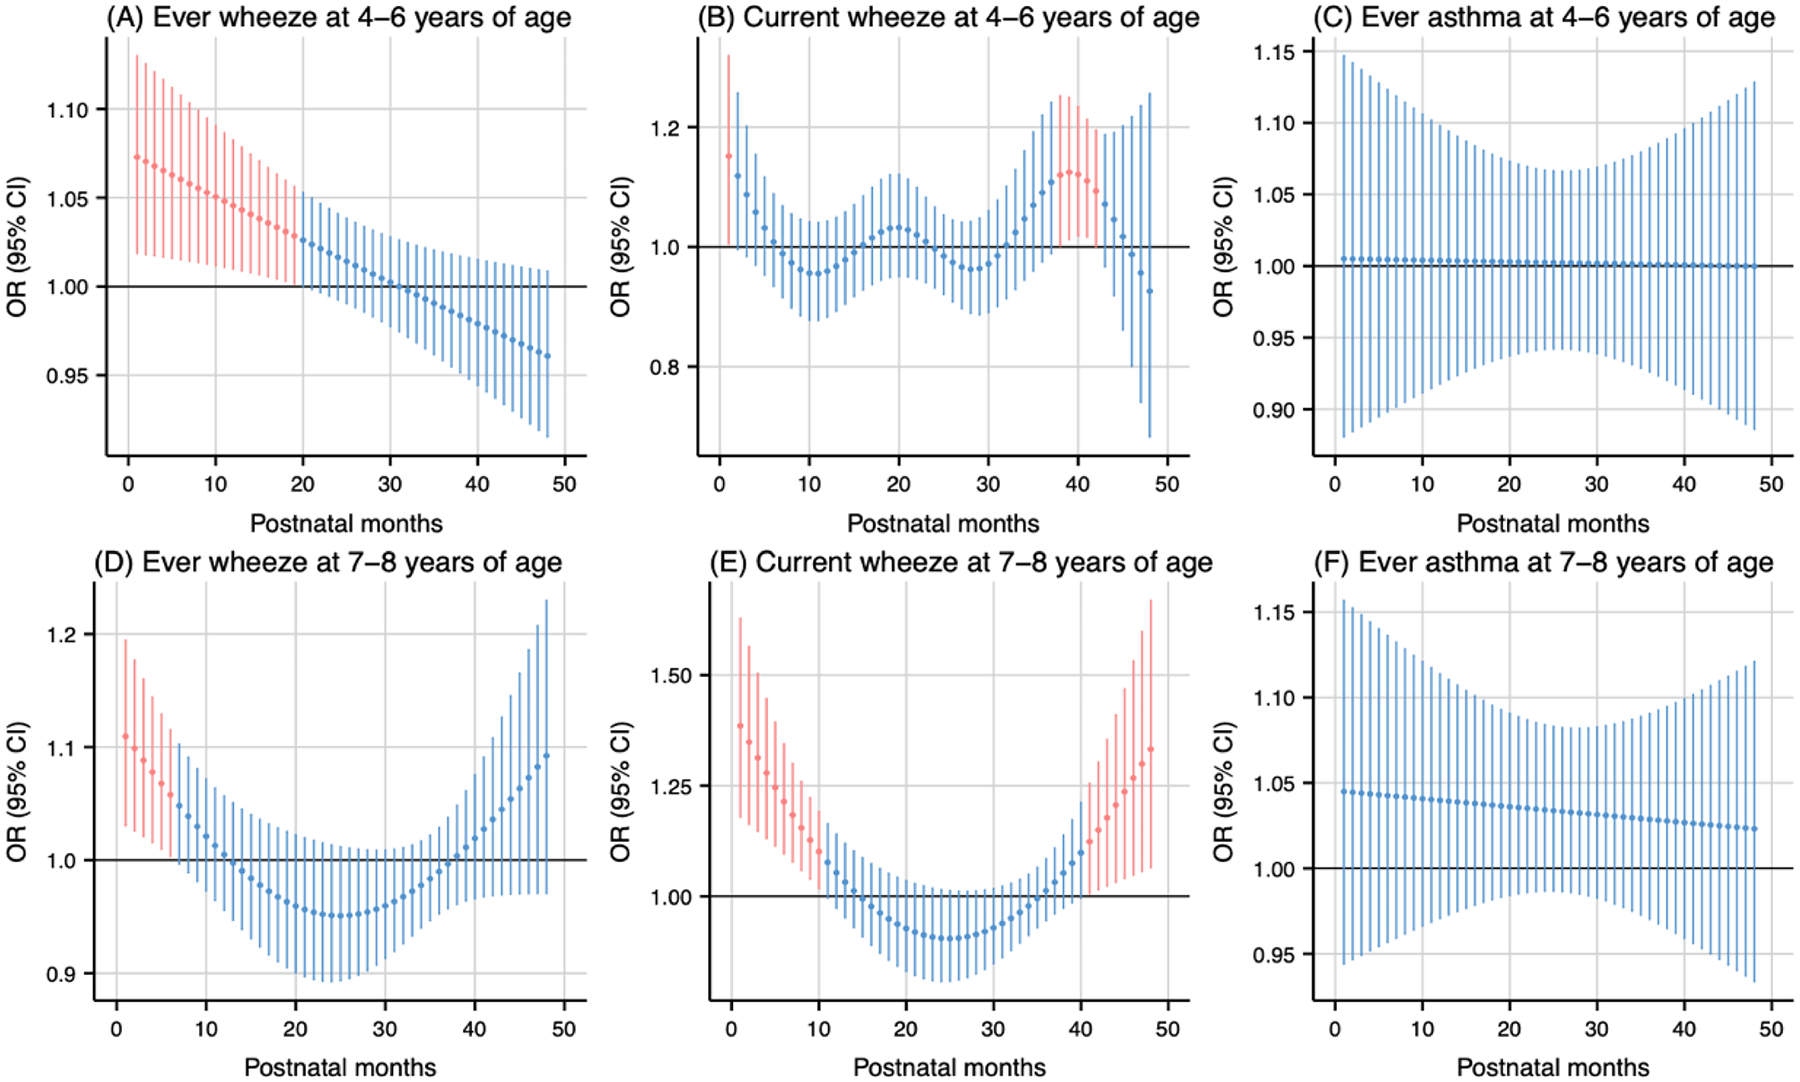
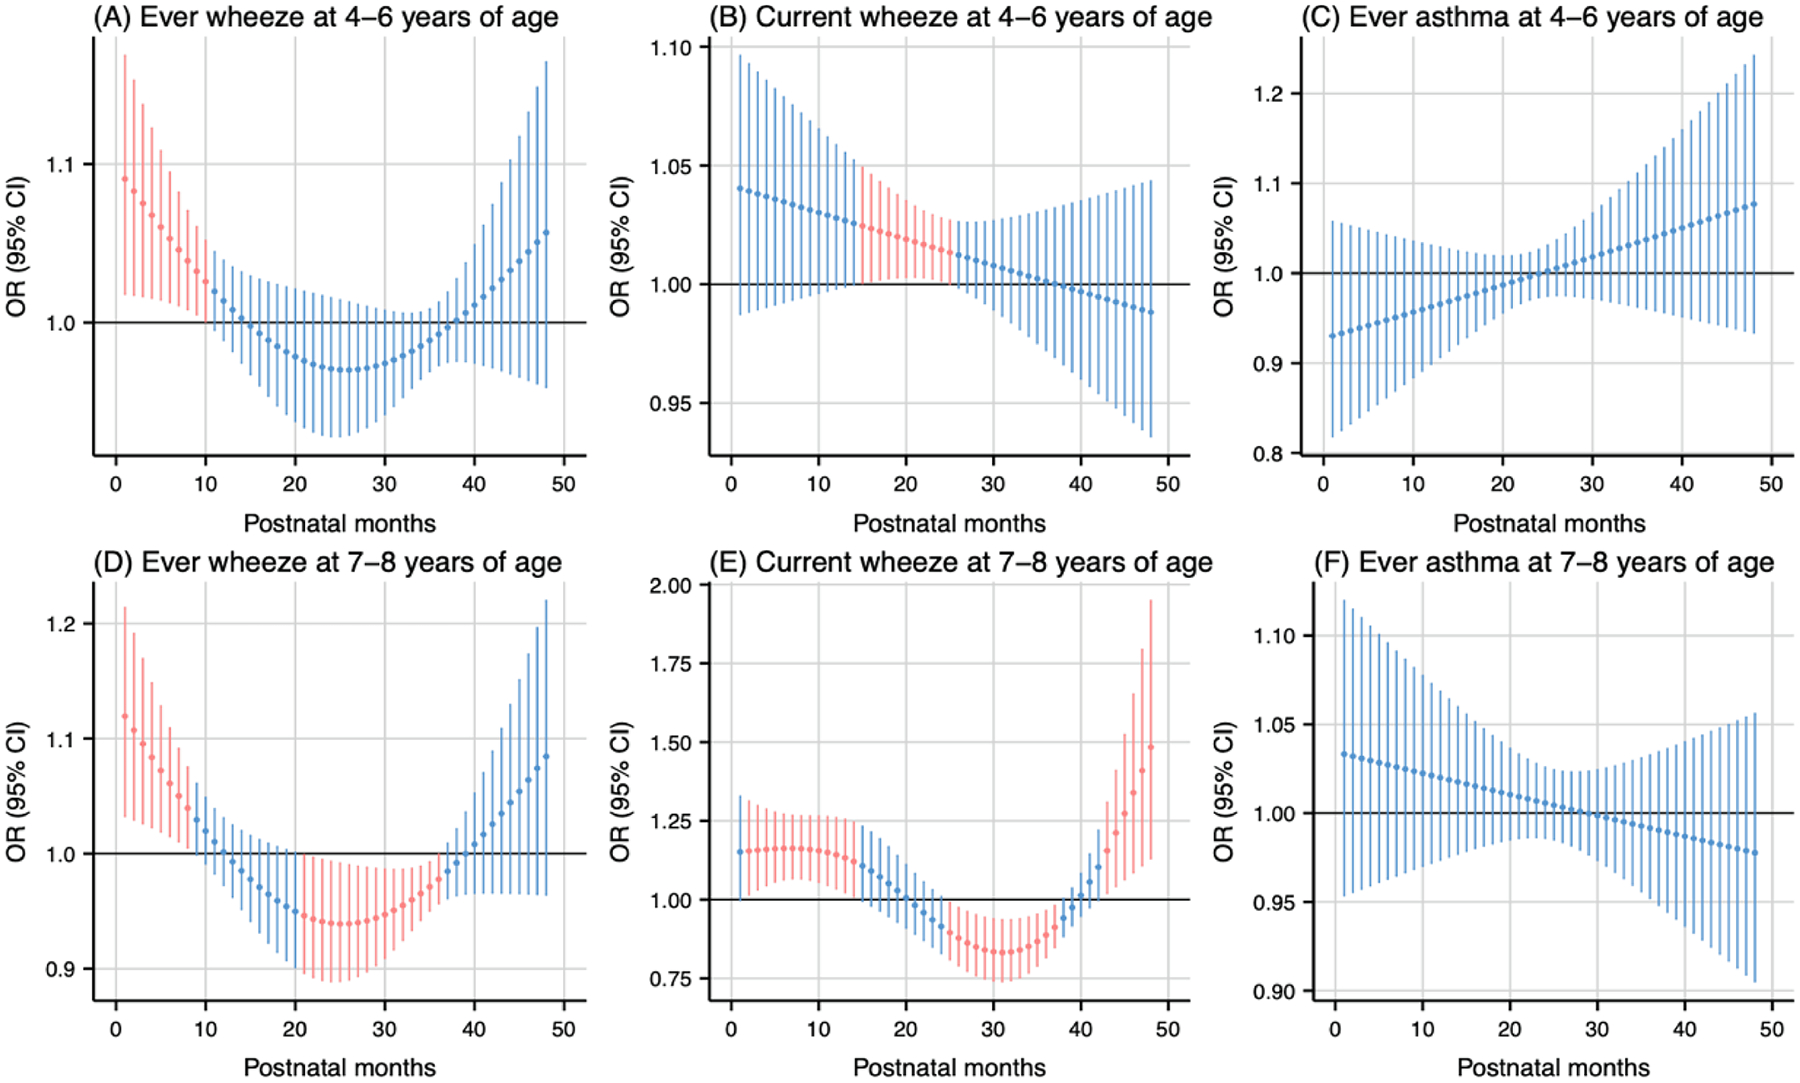
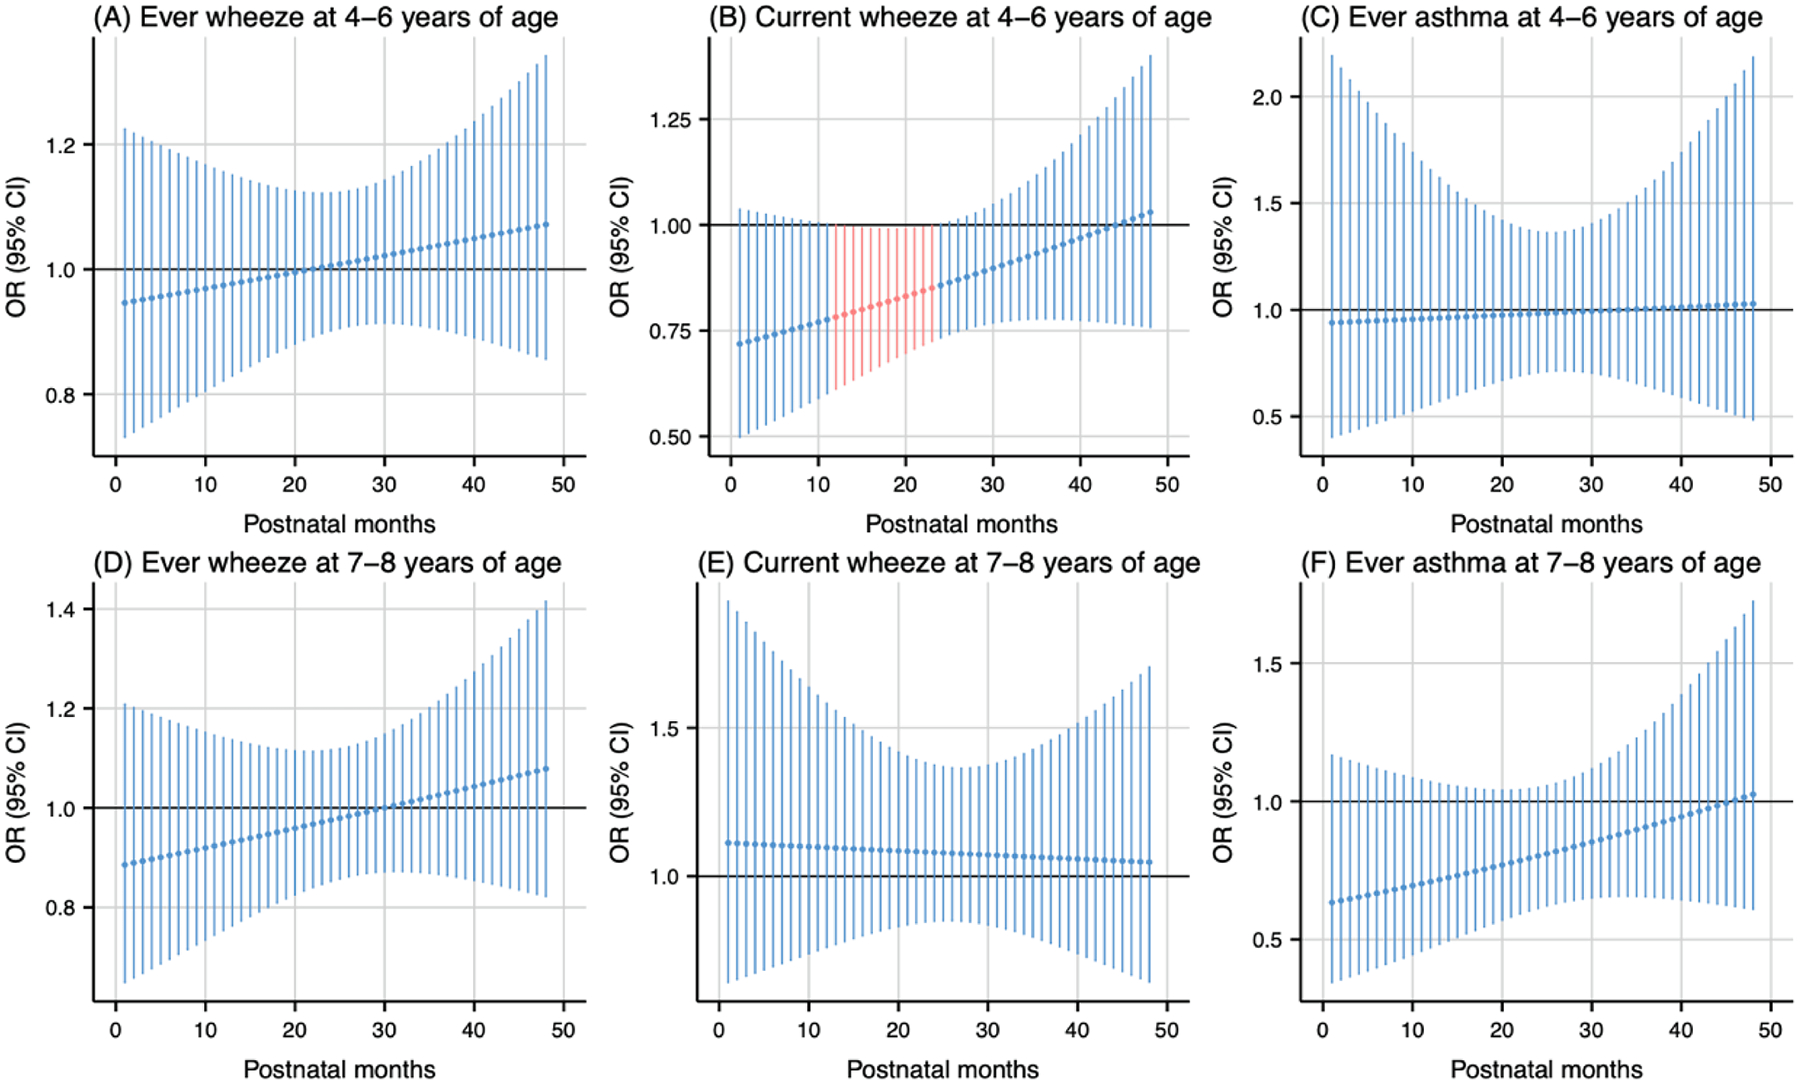
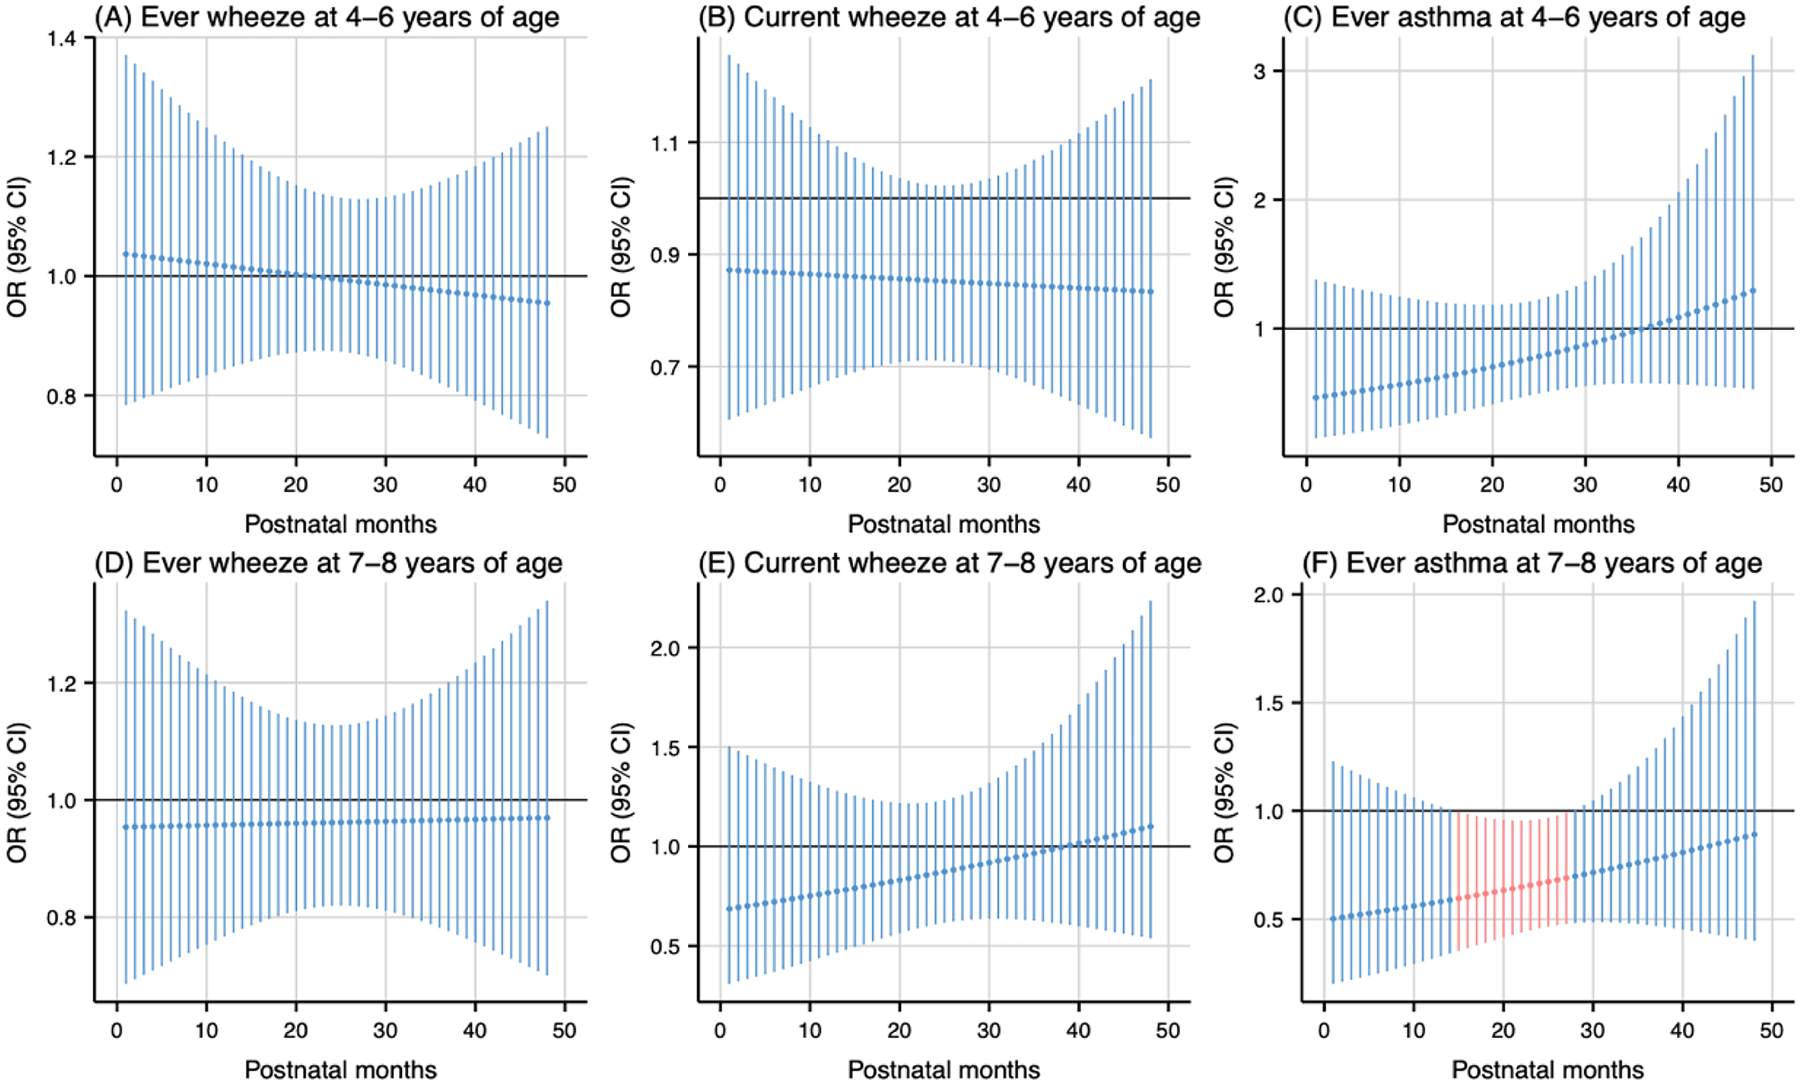
Results: Mid-gestation was a critical window for both PM2.5 (weeks 20-28, cumulative OR: 1.18 [95% CI: 1.01, 1.37]; weeks 19-26, cumulative OR: 1.18 [95% CI: 1.02, 1.36]) and NO2 (weeks 18-25, cumulative OR: 1.16 [95% CI: 1.02, 1.31]) exposure, associated with higher odds of wheeze. Postnatal exposure to PM2.5 and NO2 during the first year of life was also linked to higher odds of wheeze. The warmer and colder temperatures showed mixed effects on respiratory outcomes. We observed a synergistic interaction between high PM2.5 and high temperature exposure during the first year of life, associated with higher odds of current wheeze. The associations of prenatal air pollution and temperature exposure with respiratory outcomes were more pronounced in males.
Conclusions: Early-life air pollution exposure contributes to the development of childhood asthma and wheeze, while exposure to temperature showed mixed associations with respiratory outcomes.
Keywords: Air pollution; Asthma; Susceptible window; Temperature; Wheeze.
Copyright © 2024 The Author(s). Published by Elsevier Ltd.. All rights reserved.
Conflict of interest statement
Declaration of competing interest The authors declare that they have no known competing financial interests or personal relationships that could have appeared to influence the work reported in this paper.
Figures
References
-
- Agache I, et al., 2024. The impact of outdoor pollution and extreme temperatures on asthma-related outcomes: a systematic review for the EAACI guidelines on environmental science for allergic diseases and asthma. Allergy. - PubMed
-
- Althouse AD, 2016. Adjust for multiple comparisons? it’s not that simple. Ann. Thorac. Surg 101, 1644–1645. - PubMed
-
- Anenberg SC, et al., 2022. Long-term trends in urban NO2 concentrations and associated paediatric asthma incidence: estimates from global datasets. The Lancet Planetary Health. 6, e49–e58. - PubMed
MeSH terms
Substances
Grants and funding
LinkOut - more resources
Full Text Sources
Medical
