Clinical Trial
. 2024 Nov 19;5(11):101824.
doi: 10.1016/j.xcrm.2024.101824. Epub 2024 Nov 12.

PD-1 blockade plus cisplatin-based chemotherapy in patients with small cell/neuroendocrine bladder and prostate cancers

Affiliations
Clinical Trial

PD-1 blockade plus cisplatin-based chemotherapy in patients with small cell/neuroendocrine bladder and prostate cancers

Yiqian Gu et al. Cell Rep Med. .

Abstract

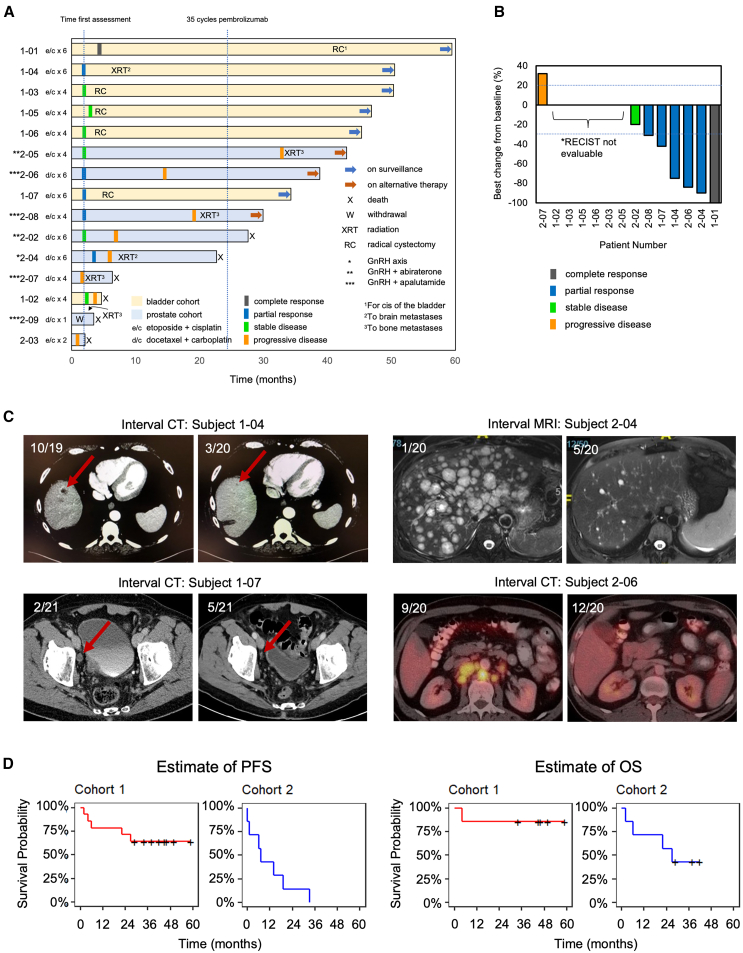
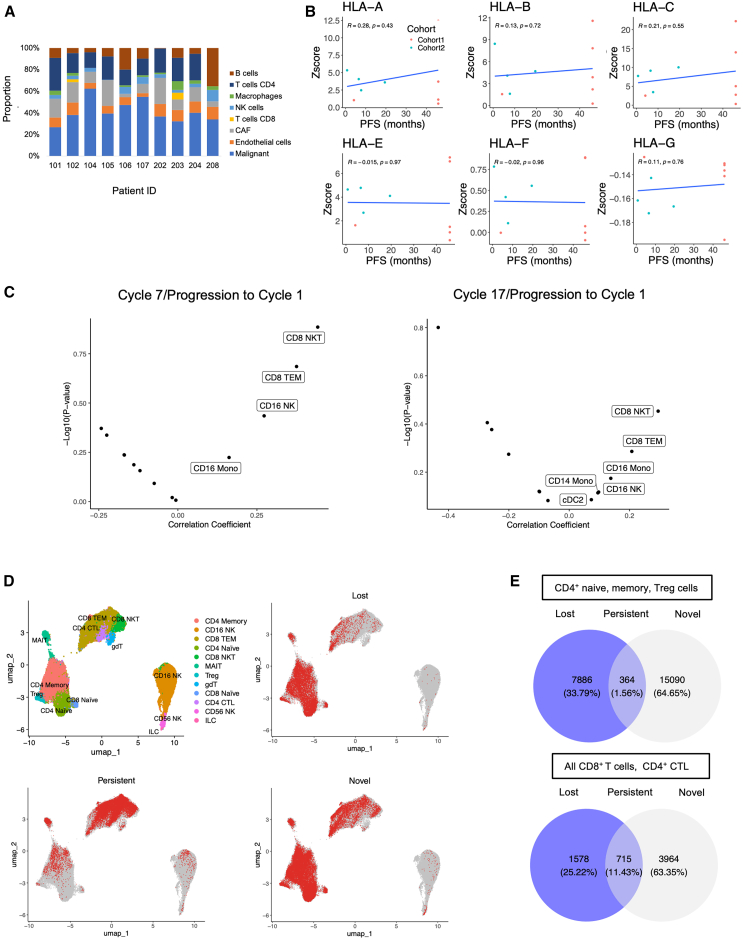
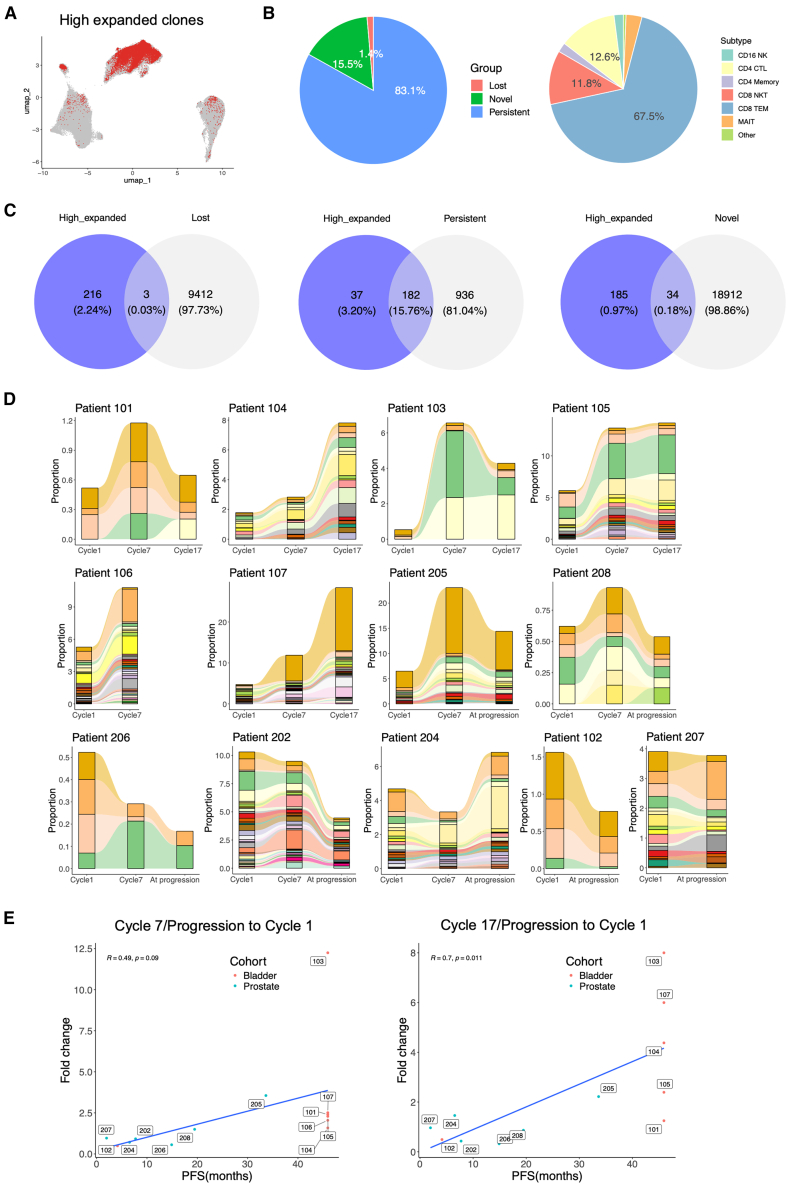
Small cell neuroendocrine cancers share biologic similarities across tissue types, including transient response to platinum-based chemotherapy with rapid progression of disease. We report a phase 1b study of pembrolizumab in combination with platinum-based chemotherapy in 15 patients with stage III-IV small cell bladder (cohort 1) or small cell/neuroendocrine prostate cancers (cohort 2). Overall response rate (ORR) is 43% with two-year overall survival (OS) rate of 86% (95% confidence interval [CI]: 0.63, 1.00) for cohort 1 and 57% (95% CI: 0.30, 1.00) for cohort 2. Treatment is tolerated well with grade 3 or higher adverse events occurring in 40% of patients with no deaths or treatment cessation secondary to toxicity. Single-cell and T cell receptor sequencing of serial peripheral blood samples reveals clonal expansion of diverse T cell repertoire correlating with progression-free survival. Our results demonstrate promising efficacy and safety of this treatment combination and support future investigation of this biomarker. This study was registered at ClinicalTrials.gov (NCT03582475).

Keywords: PD-1 blockade; T cell receptor sequencing; clinical trial; immunochemotherapy; neuroendocrine prostate cancer; single-cell sequencing; small cell bladder cancer; small cell cancers.


Conflict of interest statement

Declaration of interests The authors declare no competing interests.

Figures

None
Graphical abstract
Figure 1
Figure 1
Clinical study flow CONSORT (consolidated standards of reporting trials) diagram. Treatment involving pembrolizumab was administered on cycle 1 and continued every 3 weeks for 2 years. Chemotherapy (4–6) cycles was co-administered on cycle 1. Pre-treatment tumor tissue was used for somatic mutation testing, PD-L1 expression, tumor mutational burden, MSI determination, and RNA sequencing based on tissue availability. Peripheral blood cells were stored at baseline and every 6 weeks.
Figure 2
Figure 2
Patient targeted somatic mutation and biomarker profiles Tumor tissue in the form of formalin-fixed paraffin-embedded was used to determine PD-L1 status (22C3 antibody) in tumor (Tm) and tumor-infiltrating lymphocytes (TILs). Microsatellite instability (MSI) by immunohistochemistry, tumor mutation burden (TMB) in mutations per megabase pair (m/Mb), and targeted 648 gene somatic mutation panel was performed. Mutation types are indicated; loss of function (LOF), gain of function (GOF), loss of heterozygosity (LOH).
Figure 3
Figure 3
Efficacy outcomes and clinical responses to treatment (A) Individual patients denoted by encoded identification with treatment characteristics and responses as shown. (B) Waterfall plot depicted best clinical response shown by RECIST v.1.1. Patients who did not meet RECIST v.1.1 criteria are indicated with value set at 0. Responses as indicated. (C) Individual before and after imaging by computed tomography (CT) or magnetic resonance imaging (MRI) shown to depict representative radiographic results. (D) Kaplan-Meier estimate of progression-free survival (PFS) and overall survival (OS) of cohort 1 and cohort 2. See also Tables S1–S3.
Figure 4
Figure 4
Tumor RNA-seq analysis and pre- and on-treatment analysis of single-cell PBMC sequencing (A) Deconvolution of bulk RNA-seq of tumor tissue depicting relative proportion of immune populations. Patients as listed. (B) Scatterplots display the Z scores of major histocompatibility complex class I gene expression against PFS as labeled. Individual patients represented as dots with blue corresponding to cohort 1 and red corresponding to cohort 2. Pearson correlation coefficients and p values as indicated. (C) Pearson correlation coefficients and p values for all cell types visualized on volcano plots. Comparison of cycle 7/progression or cycle 17/progression relative to cycle 1 as indicated. Cell types with a positive correlation coefficient are labeled. (D) UMAP of only T lymphocytes with clonotypes found only in cycle 1 denoted as lost, observed in cycle 1 and either cycle 7 or cycle 17/progression as persistent, or only in cycle 7/17/progression but not cycle 1 as novel. (E) Venn diagram depicting proportion of lost, persistent, and novel clonotypes in cell populations as indicated. See also Figures S1 and S3.
Figure 5
Figure 5
Characteristics and TCR repertoire of highly expanded clonotypes (A) Highly expanded clonotypes (>0.1% of total PBMCs) shown on UMAP. (B) Percentage of expanded clonotypes in the lost, persistent, and novel clonotype populations shown as percentage composition of cell clusters. (C) Venn diagram depicting proportion of highly expanded clonotypes in the lost, persistent, and novel clonotype populations. (D) Proportion of TCR repertoire pre-treatment and expansion on-treatment of the highly expanded clonotypes compared to all PBMCs for individual patients where data were available and organized by descending PFS. Patient 106 was missing cycle 17. (E) Scatterplots display fold change of expanded clonotypes comparing cycle 7/progression or cycle 17/progression relative to cycle 1 as indicated. Individual patients represented as dots and labeled. Pearson correlation coefficients and p values as indicated.
Figure 6
Figure 6
Phenotype of highly expanded CD8+ T lymphocytes (A) Dot plot depicting gene expression of the top 10 most prevalent genes in the highly expanded CD8+ T lymphocytes compared to non-expanded CD8+ T lymphocytes of highly expanded clonotypes as the mean of all cycles and genes in pre-treatment (cycle 1) only. (B) Gene ontology terms of significant genes in the highly expanded CD8+ T cell population compared to non-expanded. The colors are differentiated by −log10(P) with 20 as threshold. See also Figure S4.

References

    1. Brennan S.M., Gregory D.L., Stillie A., Herschtal A., Mac Manus M., Ball D.L. Should extrapulmonary small cell cancer be managed like small cell lung cancer? Cancer. 2010;116:888–895. doi: 10.1002/cncr.24858. - DOI - PubMed
    1. Duan K., Mete O. Algorithmic approach to neuroendocrine tumors in targeted biopsies: Practical applications of immunohistochemical markers. Cancer Cytopathol. 2016;124:871–884. doi: 10.1002/cncy.21765. - DOI - PubMed
    1. Gong J., Salgia R. Managing Patients With Relapsed Small-Cell Lung Cancer. J. Oncol. Pract. 2018;14:359–366. doi: 10.1200/JOP.18.00204. - DOI - PMC - PubMed
    1. Thota S., Kistangari G., Daw H., Spiro T. A clinical review of small-cell carcinoma of the urinary bladder. Clin. Genitourin. Cancer. 2013;11:73–77. doi: 10.1016/j.clgc.2012.11.002. - DOI - PubMed
    1. Aggarwal R., Zhang T., Small E.J., Armstrong A.J. Neuroendocrine prostate cancer: subtypes, biology, and clinical outcomes. J. Natl. Compr. Cancer Netw. 2014;12:719–726. doi: 10.6004/jnccn.2014.0073. - DOI - PubMed

Publication types

MeSH terms

Associated data