. 2024 Nov 19;5(11):101823.
doi: 10.1016/j.xcrm.2024.101823. Epub 2024 Nov 12.

A p38 MAPK-ROS axis fuels proliferation stress and DNA damage during CRISPR-Cas9 gene editing in hematopoietic stem and progenitor cells

Affiliations

A p38 MAPK-ROS axis fuels proliferation stress and DNA damage during CRISPR-Cas9 gene editing in hematopoietic stem and progenitor cells

Lucrezia Della Volpe et al. Cell Rep Med. .

Abstract

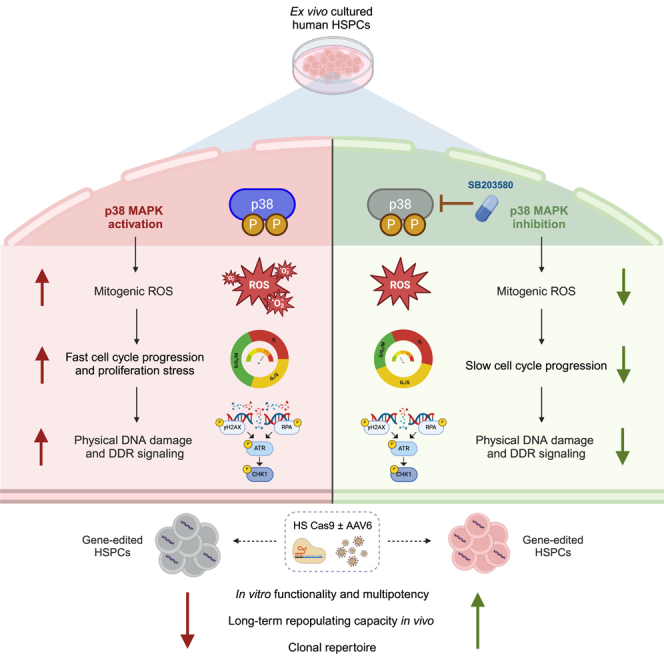
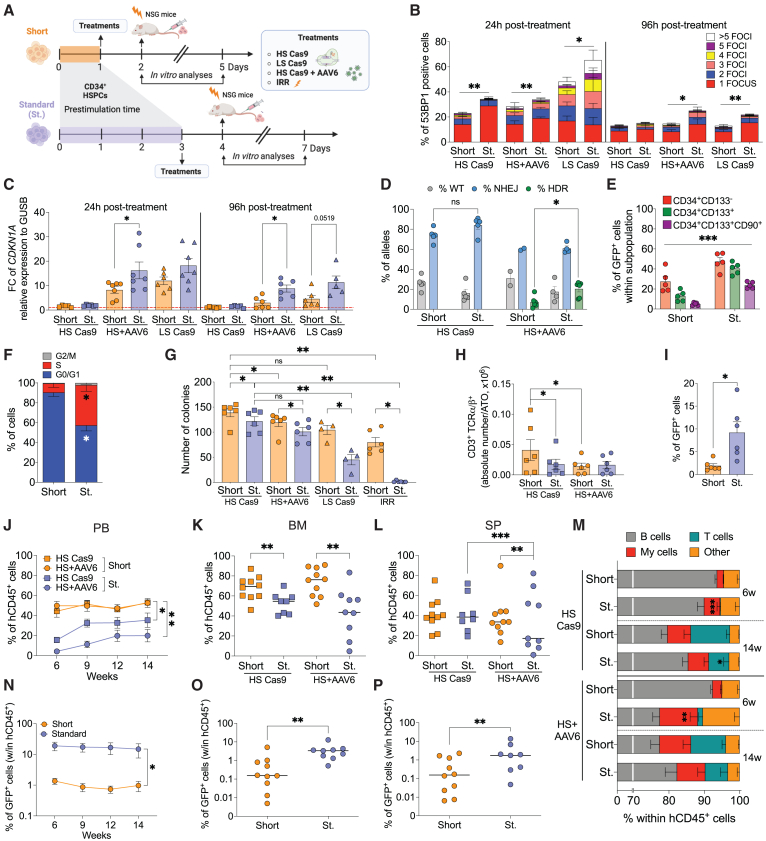
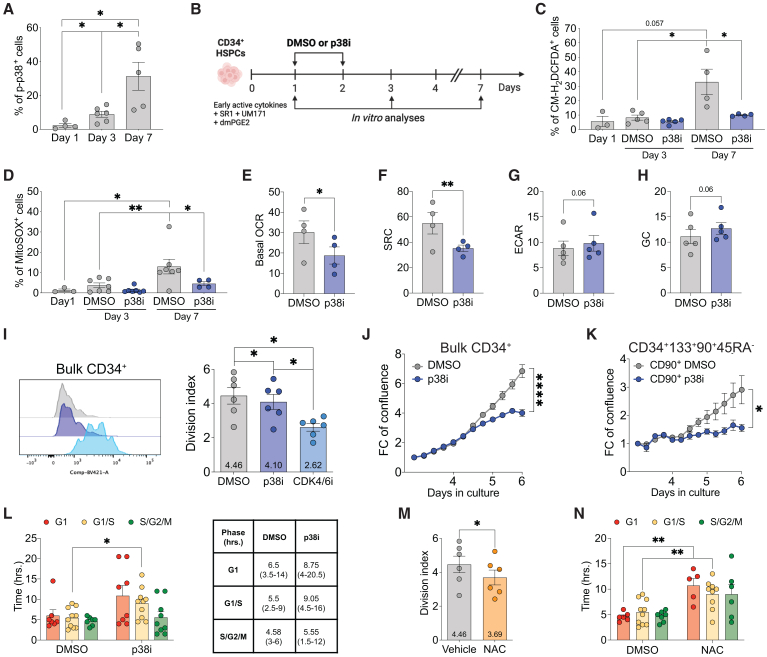
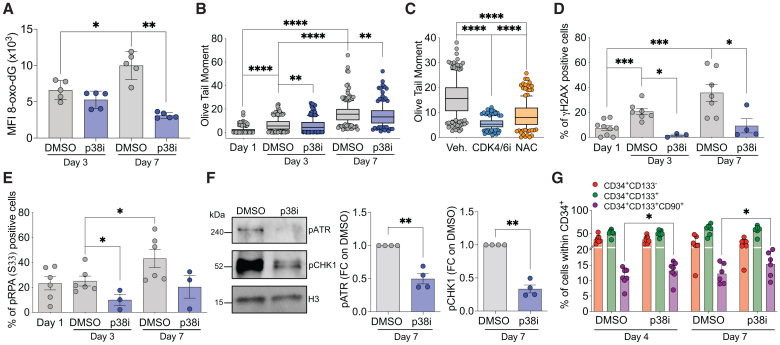
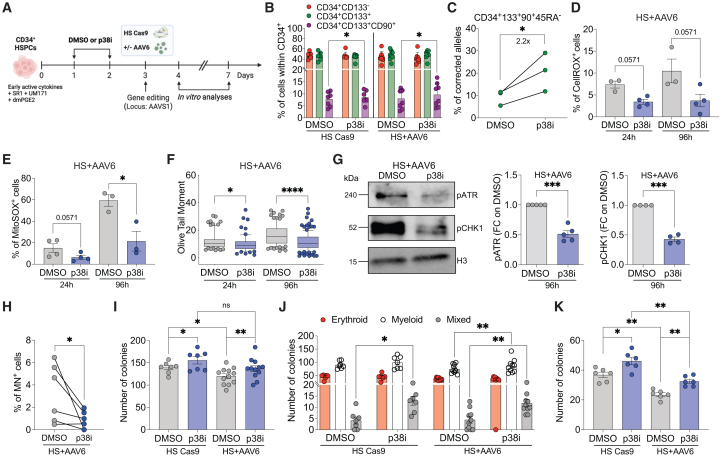
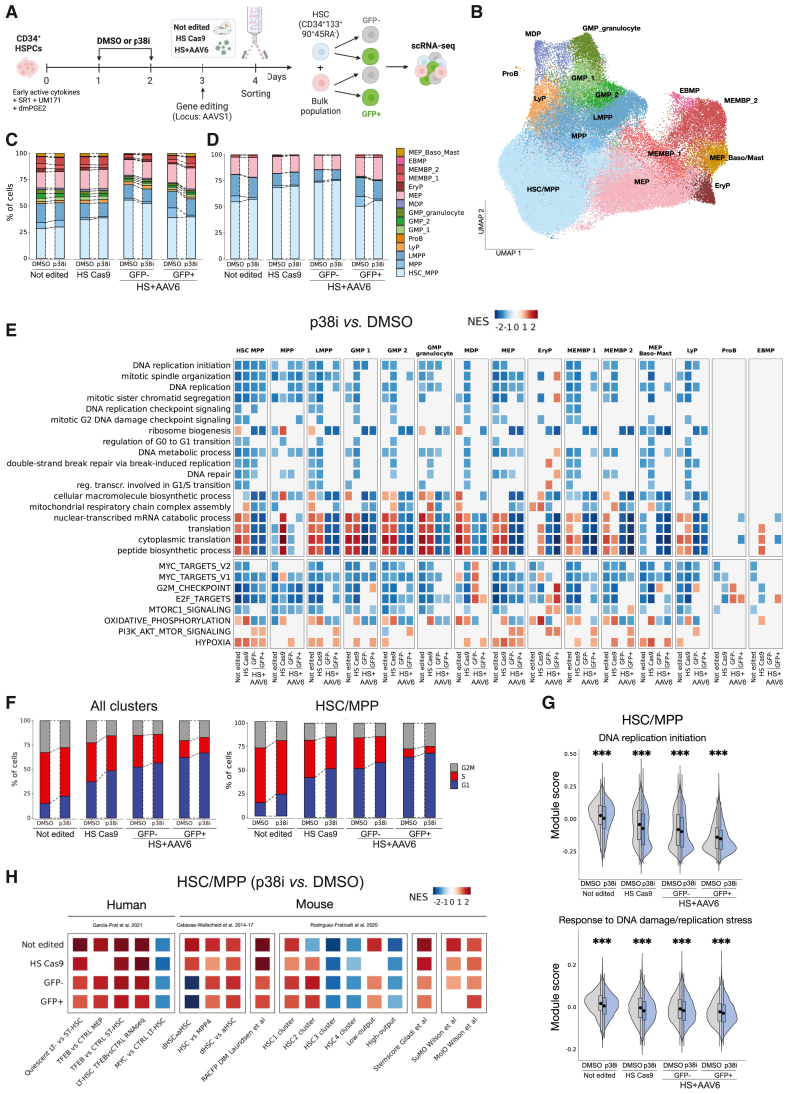
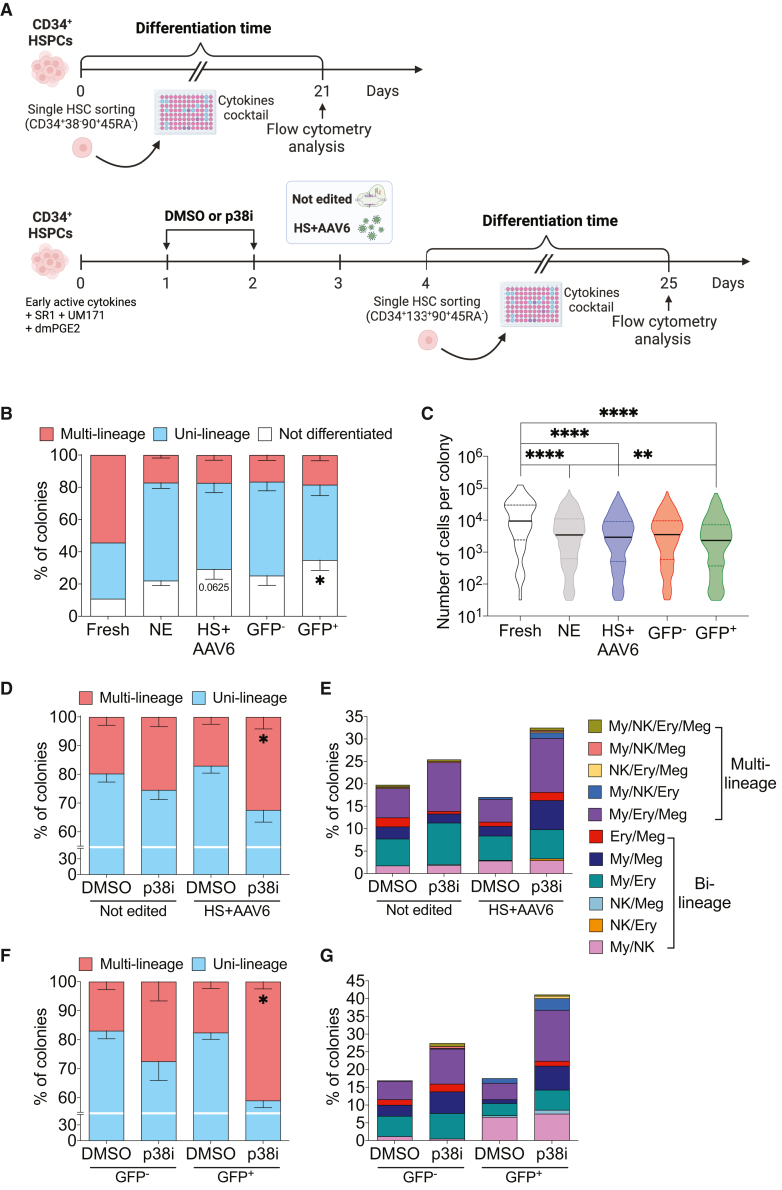
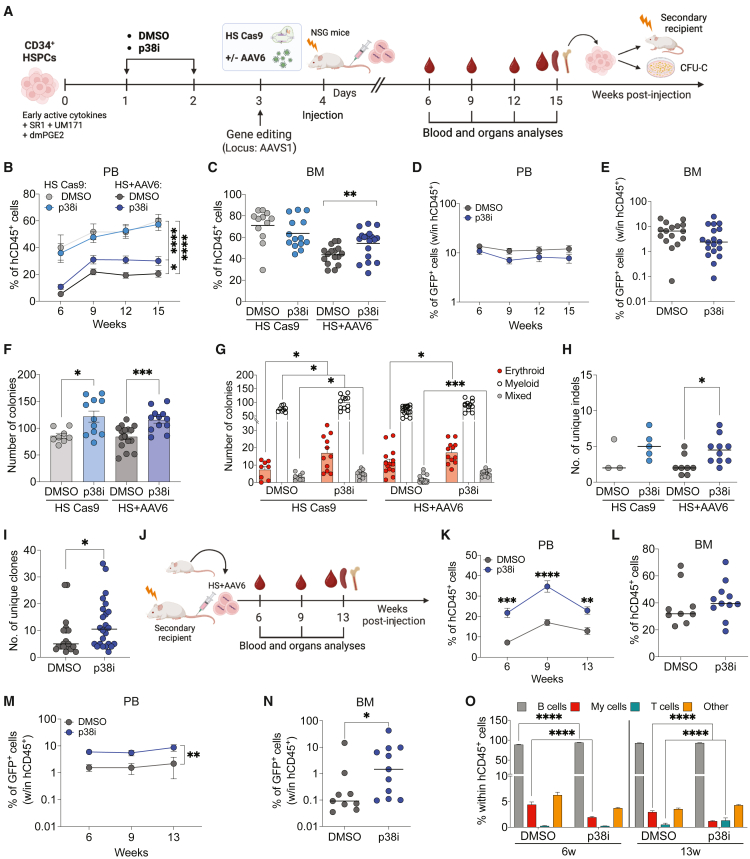
Ex vivo activation is a prerequisite to reaching adequate levels of gene editing by homology-directed repair (HDR) for hematopoietic stem and progenitor cell (HSPC)-based clinical applications. Here, we show that shortening culture time mitigates the p53-mediated DNA damage response to CRISPR-Cas9-induced DNA double-strand breaks, enhancing the reconstitution capacity of edited HSPCs. However, this results in lower HDR efficiency, rendering ex vivo culture necessary yet detrimental. Mechanistically, ex vivo activation triggers a multi-step process initiated by p38 mitogen-activated protein kinase (MAPK) phosphorylation, which generates mitogenic reactive oxygen species (ROS), promoting fast cell-cycle progression and subsequent proliferation-induced DNA damage. Thus, p38 inhibition before gene editing delays G1/S transition and expands transcriptionally defined HSCs, ultimately endowing edited cells with superior multi-lineage differentiation, persistence throughout serial transplantation, enhanced polyclonal repertoire, and better-preserved genome integrity. Our data identify proliferative stress as a driver of HSPC dysfunction with fundamental implications for designing more effective and safer gene correction strategies for clinical applications.

Keywords: CRISPR-Cas9; DNA damage; DNA damage response; cell cycle; clonal output; differentiation; gene editing; hematopoietic stem cells; p38 MAPK-ROS; proliferative stress; single-cell analyses.


Conflict of interest statement

Declaration of interests R.D.M., L.d.V., F.M., A.C., L.N., and S.F. are inventors of patents on applications of gene editing in HSPCs owned and managed by the San Raffaele Scientific Institute and the Telethon Foundation. L.N. is a founder and quota holder of GeneSpire.

Figures

None
Graphical abstract
Figure 1
Figure 1
Ex vivo activation is a prerequisite for efficient HDR-based correction, although it heightens DDR activation and affects GE HSPC repopulation capacity (A) Experimental workflow for short and standard protocols in human CB-derived HSPCs. Indicated treatments were performed at day 1 (short) or day 3 (standard) post-thawing, while in vitro analyses were conducted at 24 or 96 h post-treatments (corresponding to day 2 or 4, and day 5 or 7, respectively). (B) 53BP1 foci distribution (24 h: n = 6,8,5,8,6,8; 96 h: n = 6, 6, 6, 4, 6, 7). Mann-Whitney test. (C) Relative expression of CDKN1A (24 h: n = 5, 6, 7, 7, 6, 7; 96 h: n = 6, 5, 6, 6, 6, 5). For each time point, fold change was calculated relatively to HSPCs treated with an RNP loaded with a gRNA with no specificity against the human genome. Mann-Whitney test. (D) Percentage of wild-type and HDR- or NHEJ-edited alleles measured 96 h post-editing (HS: n = 5; HS+AAV6: n = 2, 2, 6, 4, 4, 6). Wilcoxon test. (E) Percentage of GFP+ cells within HSPC subpopulations (CD34+CD133-, CD34+CD133+, and CD34+CD133+CD90+ cells) at 96 h post-treatments (n = 5). Kruskal-Wallis test. (F) Percentage of HSPCs in indicated cell-cycle phases measured at day 1 (short: n = 5) and day 3 (standard: n = 4). Mann-Whitney test. (G) Number of colonies generated by HSPCs plated at 96 h post-treatment (HS Cas9: n = 6; HS+AAV6: n = 6; LS Cas9: n = 4; IRR: n = 6). Wilcoxon test for intra-treatment comparisons or Mann-Whitney test for inter-treatment measurements. (H) Absolute number of CD3+TCRα/β+ cells in ATO seeded with HSPCs after the indicated treatment (n = 6). Wilcoxon test. (I) Percentage of GFP+ cells measured by flow cytometry in ATO seeded with HS+AAV6-edited HSPCs (n = 6). Wilcoxon test. (J–L) Percentage of human CD45+ cells in the (J) PB, (K) BM, and (L) SP of mice transplanted with HSPCs edited as indicated (n = 10, 8, 10, 9). Mann-Whitney test (calculated at the last time point for PB). (M) Percentage of B cells, T cells, myeloid, and other cells within the human graft (PB) (n = 10, 8, 10, 9). Mann-Whitney test for short vs. standard comparisons. (N–P) Percentage of GFP+ cells (within hCD45+) measured in the (N) PB, (O) BM, and (P) SP of mice transplanted with HS+AAV6 HSPCs (n = 10, 9). Mann-Whitney test (calculated at the last time point for PB). Mean ± SEM and, unless otherwise specified, lines indicate median values. ns > 0.05; ∗p < 0.05; ∗∗p < 0.01; ∗∗∗p < 0.001.
Figure 2
Figure 2
p38 MAPK activation mediates excessive proliferation through mitogenic ROS (A) Quantification of phospho-p38 by flow cytometry analysis in ex vivo cultured HSPCs (n = 4, 6, 5). Mann-Whitney test. (B) Experimental workflow indicating in vitro treatments with DMSO (vehicle) or 4 μM p38i at day 1 and 2 post-thawing of human CB-derived HSPCs. In vitro analyses were conducted on days 1, 3, and 7 post-thawing. (C and D) Quantification of (C) cytosolic ROS detected by CM-H2DCFDA and of (D) mitochondrial superoxides measured by MitoSOX (C: n = 3, 5, 5, 4, 4; D: n = 3, 7, 7, 7, 4). Mann-Whitney test. (E and F) Quantification of (E) basal oxygen consumption rate (OCR) or (F) spare respiratory capacity (SRC) after 7 days of culture (n = 4). Mann-Whitney test. (G and H) Quantification of (G) extracellular acidification rate (ECAR) or (H) glycolytic capacity (GC) after 7 days of culture (n = 5). Wilcoxon test. (I) Representative plot of CellTrace dilution and division index of CD34+ cells measured at day 7 (n = 6). Wilcoxon test. (J and K) Cellular confluence of (J) bulk CD34+ or (K) CD34+CD133+CD90+CD45RA HSPCs reported as fold change (FC) to the first time point (n = 3). Mann-Whitney test. (L) Duration (hours) of cell-cycle phases measured in single HSPCs expressing the Fucci2a reporter. Live imaging started on day 2 after p38 inhibitor treatment; each dot represents individual cells. Mann-Whitney test. (M) Division index of HSPCs measured at day 7 (n = 6). As a control, the DMSO condition from (I) is reported. Wilcoxon test. (N) Duration (hours) of cell-cycle phases measured in single HSPCs expressing the Fucci2a reporter. Live imaging started on day 2 after NAC treatment; each dot represents individual cells. As a control, the DMSO condition from (L) is reported. Mann-Whitney test. Mean ± SEM. ∗p < 0.05; ∗∗p < 0.01; ∗∗∗∗p < 0.0001.
Figure 3
Figure 3
p38 MAPK/ROS triggers proliferation stress and heightens DNA damage (A) Quantification of 8-oxo-2′-deoxyguanosine by flow cytometry (n = 5). Mann-Whitney test. (B) Quantification of SSBs and DSBs by comet assay; each point represents a single cell from 3 independent experiments (up to 250 cells were analyzed). Mann-Whitney test. Whiskers represent 10–90 percentile. (C) Quantification of SSBs and DSBs by comet assay at day 7 of culture; each point represents a single cell from 3 independent experiments (up to 250 cells were analyzed). Mann-Whitney test. Whiskers represent 10–90 percentile. (D and E) Percentage of (D) γH2AX- or (E) pRPA-positive HSPCs (γH2AX: n = 9, 7, 3, 7, 4; pRPA = n = 6, 6, 3, 6, 3). Mann-Whitney test. (F) Western blot analysis of pATR (left) and pCHK1 (right) at day 7 (n = 4). Histone H3 was used as a loading control, and fold change relative to control is reported. One-sample t test. (G) Percentage of HSPC subpopulations (CD34+CD133-, CD34+CD133+, and CD34+CD133+CD90+ cells) (n = 7). Wilcoxon test. Unless otherwise specified, mean ± SEM. ∗p < 0.05; ∗∗p < 0.01; ∗∗∗p < 0.001; ∗∗∗∗p < 0.0001.
Figure 4
Figure 4
The functionality of gene-edited HSPCs is enhanced by p38 inhibitor treatment (A) Experimental workflow indicating in vitro treatments with vehicle (DMSO) or p38i at day 1 and 2 post-thawing of human CB- or mPB-derived HSPCs. Cells were GE at day 3 by nucleofection of HS Cas9 in the presence or not of AAV6. In vitro analyses were conducted on days 4 and 7 (24 and 96 h post-editing, respectively). (B) Percentage of HSPC subpopulations (CD34+CD133-, CD34+CD133+, and CD34+CD133+CD90+ cells) at 96 h post-nucleofection (HS Cas9: n = 7, 7, 7; HS+AAV6: n = 8, 8, 8). Wilcoxon test. (C) Percentage of HDR-corrected alleles at 96 h post-editing in CB-sorted CD34+CD133+CD90+CD45RA (n = 3). Mann-Whitney test. (D and E) Quantification of (D) cytosolic ROS detected by CellROX and of (E) mitochondrial superoxides measured by MitoSOX in HS+AAV6 CB-derived HSPCs (D: n = 3, 4, 3, 4; E: n = 4, 4, 3, 3). Mann-Whitney test. (F) Quantification of SSBs and DSBs by comet assay in HS+AAV6 CB-derived HSPCs; each point represents a single cell from 2 independent experiments (up to 165 cells were analyzed). Mann-Whitney test. Whiskers represent 10–90 percentile. (G) Western blot analysis of pATR (left) and pCHK1 (right) at 96 h post-nucleofection in HS+AAV6-edited HSPCs (pATR: n = 5; pCHK1: n = 4). Histone H3 was used as a loading control, and fold change relative to control is reported. One-sample t test. (H) Percentage of micronuclei-positive HSPCs at 96 h post-editing (HS+AAV6: n = 6). Wilcoxon test. (I) Number of colonies generated by CB-derived HSPCs plated in methylcellulose 24 h post-treatments (HS Cas9: n = 7; HS+AAV6: n = 12). Wilcoxon test for intra-treatment comparisons or Mann-Whitney test for inter-treatment measurements were performed. (J) Number of erythroid, myeloid, and mixed colonies from (I). Wilcoxon test. (K) Number of colonies generated after secondary replating in methylcellulose (n = 6). Mann-Whitney test. Mean ± SEM. ns > 0.05; ∗p < 0.05; ∗∗p < 0.01; ∗∗∗p < 0.001; ∗∗∗∗p < 0.0001.
Figure 5
Figure 5
Single-cell transcriptomic analysis reveals replication stress mitigation and stemness maintenance by p38 inhibition across conditions (A) Schematic representation of the single-cell RNA transcriptomic analysis experimental workflow: at day 1 and 2 post-thawing human CB-derived HSPCs were treated with vehicle (DMSO) or p38i. At day 3, cells were nucleofected with HS Cas9 in the presence or not of AAV6. A not edited control was included. At day 4 (24 h post-editing), HSPCs were sorted and collected for subsequent analyses. (B) Uniform manifold approximation and projection (UMAP) of annotated populations with cells belonging to all conditions. (C and D) Barplots showing the distribution of (C) all the cells retrieved and (D) CD34+CD133+CD90+CD45RA assigned to each subpopulation. (E) Enriched terms obtained performing GSEA of intra-condition comparisons of p38i vs. vehicle. Rows report terms enriched in at least one of the comparisons (columns) (false discovery rate < 0.1) from the gene ontology (GO), biological processes (BP), and the hallmark signatures (MSigDB). Colors indicate negative/positive normalized enrichment score (NES). (F) Percentage of cell-cycle distribution across all the cell subpopulations (left) or the HSC cluster (right). (G) Module score of DNA replication initiation and response to DNA damage/replication stress signatures as in Jacobs et al. Wilcoxon test (∗∗∗p < 0.001). (H) GSEA analysis of intra-condition comparisons of p38i vs. vehicle of HSPC-related categories retrieved from the literature (see STAR Methods).
Figure 6
Figure 6
In vitro multi-potency of GE HSCs is enhanced by p38 MAPK inhibition (A) Experimental workflow of the single-cell differentiation assay. CB-derived HSPCs were FACS-sorted and seeded as single cells in a cytokine-enriched medium immediately after thawing (fresh), or at day 4 for not edited and HS+AVV6 conditions. Colonies were harvested and analyzed after 25 days of culture. (B) Percentage of not differentiated, uni-lineage, and multi-lineage colonies. HS+AAV6 condition was subsequently analyzed as GFP and GFP+ colonies. >100 colonies for fresh condition and >1,000 colonies for all the other conditions from 4 independent experiments were analyzed. Mann-Whitney test. (C) Distribution of the number of cells composing individual colonies analyzed in (B). Mann-Whitney test. (D) Percentage of uni-lineage and multi-lineage colonies. >1,000 colonies analyzed from 4 independent experiments. Mann-Whitney test. (E) Percentage of colonies with the indicated composition derived from multi-lineage colonies in (D). (F) Percentage of uni-lineage and multi-lineage colonies derived from HS+AAV6 in (D). Mann-Whitney test. (G) Percentage of colonies with the indicated composition derived from multi-lineage colonies in (F). Mean ± SEM. ∗p < 0.05; ∗∗p < 0.01; ∗∗∗∗p < 0.0001.
Figure 7
Figure 7
Repopulating capacity and clonal repertoire of GE HSPCs are ameliorated by p38 inhibitor administration (A) Experimental workflow showing the time of in vitro treatments, GE, and in vivo injection of human CB- or mPB-derived HSPCs into NSG mice, followed by blood and organ analyses. (B and C) Percentage of human CD45+ cells in the (B) PB and (C) BM of NSG mice transplanted with CB-derived HSPCs edited as indicated (n = 12, 14, 16, 18). Mann-Whitney test (calculated at the last time point for PB). (D and E) Percentage of GFP+ cells (within hCD45+ cells) in the (D) PB and (E) BM of mice from (B and C) (n = 16, 18). Mann-Whitney test. (F) Number of colonies formed by BM-derived CD34+ cells purified from mice in (C) (HS Cas9: n = 8, 11; HS + AAV6: n = 16, 12). Mann-Whitney test. (G) Number of erythroid, myeloid, and mixed colonies from samples in (F). Mann-Whitney test. (H) Number of unique indels in human BM-derived cells (HS Cas9: n = 3, 5; HS+AAV6: n = 8, 10). Median values are reported. Mann-Whitney test. (I) Number of unique BARs in HS+AAV6 human BM-derived cells (n = 19, 24). Median values are reported. Mann-Whitney test. (J) Schematic representation of the secondary transplantation: BM-derived CD34+ cells recovered from primary mice were injected into secondary recipients. Hematopoietic organs were analyzed at the endpoint (13 weeks). (K and L) Percentage of hCD45+ cells in the (K) PB and (L) BM of secondary-transplanted mice (n = 9, 11). Mann-Whitney test. (M and N) Percentage of GFP+ cells (within hCD45+ cells) in the (M) PB and (N) BM of mice in (K and L) (n = 9, 11). Mann-Whitney tests. (O) Percentage of B cells, T cells, myeloid, and other cells within hCD45+ cells in the PB of mice in (K) (n = 9, 11). Mann-Whitney test. Mean ± SEM and, unless otherwise specified, lines indicate median values. ∗p < 0.05; ∗∗p < 0.01; ∗∗∗p < 0.001; ∗∗∗∗p < 0.0001.

References

    1. Naldini L., Cicalese M.P., Bernardo M.E., Gentner B., Gabaldo M., Ferrari G., Aiuti A. The EHA Research Roadmap: Hematopoietic Stem Cell Gene Therapy. HemaSphere. 2022;6:E671. - PMC - PubMed
    1. Ferrari S., Valeri E., Conti A., Scala S., Aprile A., Di Micco R., Kajaste-Rudnitski A., Montini E., Ferrari G., Aiuti A., Naldini L. Genetic engineering meets hematopoietic stem cell biology for next-generation gene therapy. Cell Stem Cell. 2023;30:549–570. - PubMed
    1. Doudna J.A., Charpentier E. The new frontier of genome engineering with CRISPR-Cas9. Science. 2014;346 - PubMed
    1. Porteus M.H. A New Class of Medicines through DNA Editing. N. Engl. J. Med. 2019;380:947–959. - PubMed
    1. Scully R., Panday A., Elango R., Willis N.A. DNA double-strand break repair-pathway choice in somatic mammalian cells. Nat. Rev. Mol. Cell Biol. 2019;20:698–714. - PMC - PubMed

MeSH terms

Substances