. 2025 Jan:91:102062.
doi: 10.1016/j.molmet.2024.102062. Epub 2024 Nov 12.

Increased susceptibility to diet-induced obesity in female mice impairs ovarian steroidogenesis: The role of elevated leptin signalling on nodal activity inhibition in theca cells

Affiliations

Increased susceptibility to diet-induced obesity in female mice impairs ovarian steroidogenesis: The role of elevated leptin signalling on nodal activity inhibition in theca cells

Karolina Wołodko et al. Mol Metab. 2025 Jan.

Abstract

Objectives: Susceptibility to obesity in humans is driven by the intricate interplay of genetic, environmental and behavioural factors. Moreover, the mechanisms linking maternal obesity to infertility remain largely understudied. In this study, we investigated how variable susceptibility to obesity in mice affects ovarian steroidogenesis, with a particular focus on the leptin-mediated dysregulation of Nodal signalling pathway in theca cells (TC).

Methods: C56BL/6J (B6) and 129S1/SvlmJ (129) mice, models of maternal obesity (MO), were fed a chow diet (CD) and a high fat diet (HFD) for 16 weeks. To investigate the contrasting effects of leptin on ovarian steroidogenesis, B6 mice pharmacologically treated with leptin for 16 days on CD were used to model hyperleptinemia, while homozygous ob/ob (-/-) mice with genetic leptin deficiency, also on a CD, were used to examine the effects of obesity in the absence of leptin. Following the characterisation of the mouse phenotype, gonadal fat (GON), whole ovaries (WO), ovarian TC and granulosa cell (GC) fractions were collected for mRNA transcription and protein expression analysis. Finally, in vitro treated ovarian explants obtained from B6 mice were used to further elucidate the effects of Nodal on steroidogenesis.

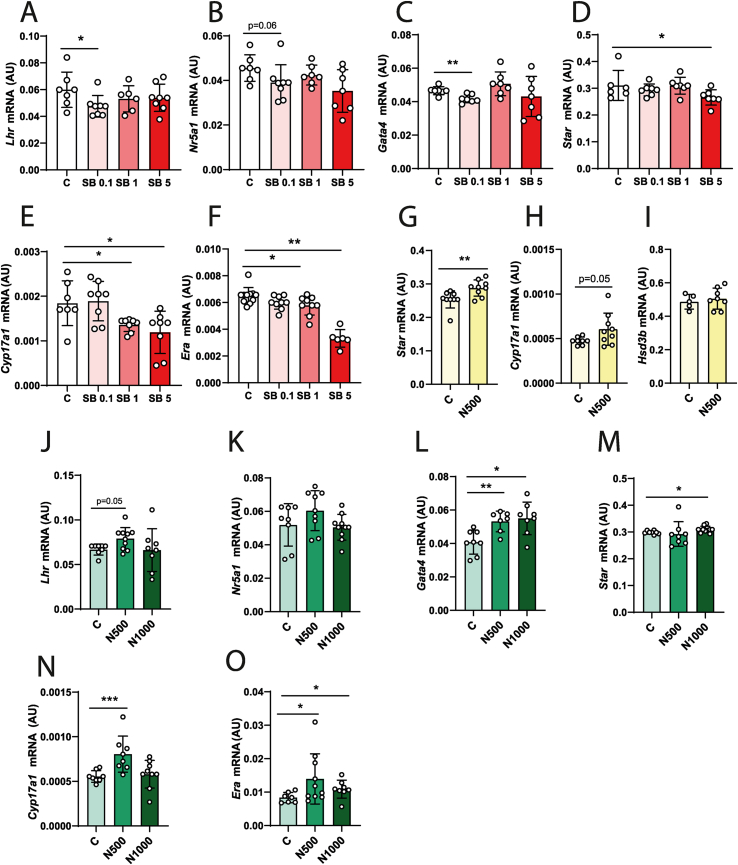
Results: The significant gain in body weight (BW) and fat mass (FM) in HFD-fed B6 mice (p < 0.05), was associated with increased mRNA transcription of the adipose tissue expansion genes Polymerase I and transcript release factor (Cavin), Secreted frizzled-related protein 5 (Sfrp5) and Mesoderm specific transcript (Mest) in GON (p < 0.05). Furthermore, the HFD-fed B6 mice presented also impaired glucose metabolism and insulin sensitivity (p < 0.05). In contrast, the HFD-fed 129 mice exhibited no changes in BW and FM, maintaining glucose and insulin metabolism. At the ovarian level, decreased protein expression of Steroidogenic Acute Regulatory Protein (StAR) in WO obtained from HFD-fed B6 mice (p = 0.05), was followed by reduced transcription of key steroidogenic genes like Star and Cytochrome P450 17a1 (Cyp17a) in TC (p < 0.05). Furthermore, the transcription of Nodal and its receptors was downregulated (p < 0.05), whereas mRNA levels of Suppressor of cytokine signalling 3 (Socs3) and SMAD family member 7 (Smad7) were upregulated in TC obtained from HFD-fed B6 mice (p < 0.05). No changes were seen in the genes regulating steroidogenesis, Nodal signalling, or Socs3 and Smad7 activity in the ovaries of HFD-fed 129 mice. Importantly, the pharmacological treatment of lean mice with leptin, upregulated the ovarian transcription of Socs3 and Smad7, while downregulating Nodal and its receptors (p < 0.05). Finally, in vitro pharmacological inhibition of Nodal signalling pathway in ovarian explants isolated from CD-fed B6 mice decreased the transcription of Star and Cyp17a in TC (p < 0.05), whereas Nodal treatment of explants obtained from HFD-fed B6 mice restored the transcription of both genes (p < 0.05).

Conclusions: Increased susceptibility to obesity in MO is associated with systemic hyperleptinemia and hypoestrogenism due to compromised ovarian steroidogenesis, largely driven by the inhibitory effects of leptin-Smad7 pathway on Nodal signalling activity in the TC compartment of ovarian follicles.

Keywords: Diet induced-obesity; Leptin; Nodal; Ovarian steroidogenesis.


Conflict of interest statement

Declaration of competing interest All authors of the present work have nothing to declare.

Figures

Figure 1
Figure 1
Obesity prone B6 mice, but not obesity resistant 129, present body weight gain, fat accumulation, and impaired glucose metabolism and insulin sensitivity after diet induced obesity. (A) Experimental design: obesity prone (C57BL/6J, B6) and obesity resistant (129S1/SvlmJ, 129) mice were fed either chow diet (CD) or high fat diet (HFD) for 16 weeks. Phenotype characterisation included the measurement of (B) body weight (BW), (C) fat mass (FM), (D) adiposity index (AI, FM/lean mass [LM]) and (E) LM. (F) Food intake (FI) presented as weekly caloric intake; the dot plot represents mean caloric intake throughout the experiment; the box whisker plot shows the average caloric intake during the experiment in HFD groups from B6 and 129. Blood glucose levels were measured within 120 min after challenging the animals with glucose in the (G) glucose tolerance test; and insulin in the (H) insulin tolerance test. Bar plots represent the area under the curve was calculated for each group (results presented as mean ± standard deviation). (I) Plasma leptin level measured by enzyme linked immunosorbent assay (ELISA). The differences between groups were analysed using Mann–Whitney test. N = 7–8. Grey bars- B6 CD group, black bars- B6 HFD group, orange bars- 129 CD group, brown bars- 129 HFD group. Asterisks indicate significant differences: ∗p < 0.05; ∗∗p < 0.01; ∗∗∗p < 0.001; ∗∗∗∗p < 0.0001. Diagrams generated with BioRender.com. (For interpretation of the references to color in this figure legend, the reader is referred to the Web version of this article.)
Figure 2
Figure 2
Diet induced obesity promotes the expression of white adipose tissue expansion genes and proinflammatory markers in gonadal fat of obesity prone B6 mice. Levels of mRNA transcription of gonadal fat (GON) expansion genes: (A) Polymerase I and transcript release factor (Cavin), (B) Secreted frizzled-related protein 5 (Sfrp5), (C) Mesoderm specific transcript (Mest), (D) Leptin; and the proinflammatory cytokines: (E) NLR Family Pyrin Domain Containing 1 (Nlrp1), (F) Interleukin 1 beta (Il1b), (G) C–C motif chemokine ligand 5 (Ccl5) in obesity prone C57BL/6J (B6) and obesity resistant 129S1/SvlmJ (129) mice fed either chow diet (CD) or high fat diet (HFD) for 16 weeks. Fat expansion markers and leptin levels were measured by quantitative real-time PCR (RT-PCR) with TaqMan probes and primers using a standard curve generated from pooled RNA isolated from white adipose tissue and normalised to cyclophilin b expression level. Expression of proinflammatory markers was measured using SYBR Green real-time PCR and normalised to the averaged expression of cyclophilin b and beta-2-microglobulin (b2m). In each assay, both target and housekeeping gene were run simultaneously and in duplicate. AU- arbitrary units (results presented as mean ± standard deviation). The differences between groups were analysed using Mann–Whitney test. N = 6–8. Light green bars- B6 CD group, green bars- B6 HFD group, grey bars- 129 CD group, dark grey bars- 129 HFD group. Asterisks indicate significant differences: ∗p < 0.05; ∗∗p < 0.01. (For interpretation of the references to color in this figure legend, the reader is referred to the Web version of this article.)
Figure 3
Figure 3
The expression of gonadotropin receptors and steroidogenic enzymes is compromised in the theca compartment of ovaries collected from obese B6 mice. Whole ovaries (WO), theca-enriched population (TC), the granulosa cells (GC) were collected from obesity prone (C57BL/6J, B6) and obesity resistant (129S1/SvlmJ, 129) mice, fed either chow diet (CD) or high fat diet (HFD) for 16 weeks following superovulation. (A) Immunofluorescent staining of perilipin 1 (PLIN 1) was performed in paraffin embedded ovaries of mice subjected to the dietary protocol. PLIN 1 visualised in red was localised in the TC in ovarian follicles; nuclear counterstaining with DAPI in blue. The scale bar represents 5, 20 or 50 μm. Images shown are representative of 3 biological replicates, illustrating follicles from B6 CD (top left), B6 HFD (bottom left) 129 CD (top right) and 129 HFD (bottom right). The insert on the top right represents a magnified area of the main image. The bar plot on the right represents the mean fluorescence intensity in late antral follicles. Briefly, using Zeiss ZEN 3.7 software, both the theca layer and the mural granulosa cell layer were outline. Subsequently the background intensity was set for the GC layer as the minimum threshold signal, and the intensity in TC measured. Results represent the average intensity across antral follicles in three ovarian sections obtained from different mice in each treatment. Abundance of (B) Prolactin receptor (Prlr) mRNA in TC fraction (left graph) and GC compartment (right graph), (C) Luteinizing hormone receptor (LHR) protein expression in WO (left graph) and mRNA level in TC (right graph). Expression of steroidogenic markers and transcription factors in WO and TC, (D) Steroidogenic acute regulatory protein (StAR) protein in WO and mRNA levels in TC, and mRNA assessment of (E) Hydroxysteroid dehydrogenase 3 beta (Hsd3b), (F) Cytochrome P450 family 17 subfamily A member 1 (Cyp17a1), (G) Hydroxysteroid dehydrogenase 17 beta (Hsd17b), (H) Progesterone receptor isoform b (Prb), (I) Estradiol receptor alpha (Era) in TC. (J) Estradiol plasma levels measured by enzyme linked immunosorbent assay (ELISA) in B6 mice submitted to CD and HFD for 16 weeks. Levels of mRNA measured with SYBR Green real-time PCR and normalised by the housekeeping genes Ribosomal protein L32 (Rpl32, WO) or Eukaryotic translation initiation factor 5A (Eif5a, TC and GC). In each assay, both target and housekeeping genes were run simultaneously and in duplicate. Protein expression was measured by western blot (WB) and normalised by B-actin. AU- arbitrary units (results presented as the mean ± standard deviation). The differences between groups were analysed using Mann–Whitney test. N = 6–8 for real-time PCR and N = 4 for WB. Grey bars- B6 CD group, black bars- B6 HFD group, orange bars- 129 CD group, brown bars- 129 HFD group. Plain bars- WO, dotted bars- TC, stripped bars- GC. Asterisks indicate significant differences: ∗p < 0.05; ∗∗p < 0.01; ∗∗∗p < 0.001. (For interpretation of the references to color in this figure legend, the reader is referred to the Web version of this article.)
Figure 4
Figure 4
Diet-induced obesity downregulates Nodal signalling pathway in the theca compartment of ovaries from obesity-prone B6 mice. Whole ovaries (WO), theca (TC) and granulosa cells (GC) were collected from ovaries of C57BL/6J (B6) and 129S1/SvlmJ (129) mice fed either chow diet (CD) or high-fat diet (HFD) for 16 weeks. The mRNA transcription was analysed by real time PCR for: (A) Nodal, (B) Activin a receptor type 2b (Acvr2b), (C) Activin a receptor type 1c (Alk7), (D) Alk4. (E) Phosphorylated SMAD3 (pSMAD3) levels in WO were analysed by western blot (WB) and normalised to total SMAD3. mRNA levels of (F) Left-right determination factor 1 (Lefty 1) and (F) Smad7 were also quantified in TC and GC. Levels of mRNA measured with SYBR Green real-time PCR and normalised by the housekeeping gene Eukaryotic translation initiation factor 5A (Eif5a). In each assay, both target and housekeeping genes were run simultaneously and in duplicate. Protein expression assessed by western blot and normalised by B-actin. AU- arbitrary units (results presented as the mean ± standard deviation). The differences between groups were analysed using Mann–Whitney test. N = 6–8 for real-time PCR and N = 4 for WB. Grey bars- B6 CD group, black bars- B6 HFD group, orange bars- 129 CD group, brown bars- 129 HFD group. Plain bars- WO, dotted bars- TC, stripped bars- GC. Asterisks indicate significant differences: ∗p < 0.05; ∗∗p < 0.01. (For interpretation of the references to color in this figure legend, the reader is referred to the Web version of this article.)
Figure 5
Figure 5
SOCS3 activation in the ovaries of obese mice inhibits Nodal signalling pathway. Obesity prone (C57BL/6J, B6) and obesity resistant (129S1/SvlmJ, 129) mice were fed either chow diet (CD) or high fat diet (HFD) for 16 weeks, followed by the collection of the whole ovaries (WO), the theca-enriched (TC) compartment and granulosa cell (GC) compartment. WO were collected from 12 week old mice pharmacologically treated with leptin (LEPT) or saline (C) for 16 days; and 12 week old mice with genetic leptin deficiency (ob/ob) and their wild type counterparts. Abundance of (A) Suppressor of cytokine signalling 3 (SOCS3) protein (left graph) and mRNA (right graph) in WO; (B) Socs3 mRNA in the TC (left graph) and GC (right graph) collected from B6 and 129. mRNA transcription of: (C) Socs3, (D) Nodal, (E) Activin a receptor type 2b (Acvr2b), (F) Activin a receptor type 1b (Alk4), (G) Activin a receptor type 1c (Alk7), (H) Left-right determination factor 1 (Lefty 1) and (I) SMAD family member 7 (Smad 7) in WO of mice collected LEPT and ob/ob protocols. Levels of mRNA measured with SYBR Green real-time PCR and normalised by the housekeeping genes Ribosomal protein L32 (Rpl32) (WO) and Eukaryotic translation initiation factor 5A (Eif5a) (TC and GC). In each assay, both target and housekeeping genes were run simultaneously and in duplicate. Protein expression assessed by western blot and normalised by B-actin. AU- arbitrary units (results presented as the mean ± standard deviation). The differences between groups were analysed using Mann–Whitney test. N = 6–8 for real-time PCR and N = 4 for WB. Grey bars- B6 CD group, black bars- B6 HFD group, orange bars- 129 CD group, brown bars- 129 HFD group. Plain bars- WO, dotted bars- TC, stripped bars- GC. Light pink bars- LEPT C group, pink bars- LEPT L group, light blue bars-ob/ob +/+ group, blue bars-ob/ob −/− group. Asterisks indicate significant differences: ∗p < 0.05; ∗∗p < 0.01; ∗∗∗p < 0.001. (For interpretation of the references to color in this figure legend, the reader is referred to the Web version of this article.)
Figure 6
Figure 6
Nodal treatment in vitro rescues the downregulation of steroidogenic genes in the TC compartment of obese mice. Obesity prone (C57BL/6J, B6) mice were fed either chow diet (CD, sections A-I) or high fat diet (HFD, sections J-O) for 16 weeks, followed by the collection of whole ovaries (WO) and ovarian explants cultured for 12 h with: Nodal signalling inhibitor SB431542 (SB) at 0.1, 1 or 5 μM,; or 500, Nodal at 1000 ng/ml. Control group represented by C. After culture, ovarian explants were punctured and the theca-enriched (TC) was collected for mRNA analysis of: (A, J) Luteinizing hormone receptor (Lhr), (B, K) Nuclear receptor subfamily 5 group A member 1 (Nr5a1), (C, L) Gata binding protein 4 (Gata4), (D, G, M) Steroidogenic acute regulatory protein (Star), (E, H, N) cytochrome P450 family 17 subfamily A member 1 (Cyp17a1), (F, O) Estradiol receptor alpha (Era) and Hydroxy-steroid dehydrogenase 3b (Hsd3b). Levels of mRNA normalised to Eukaryotic translation initiation factor 5A (Eif5a) expression run simultaneously with the gene of interest. AU- arbitrary units (results presented as the mean ± standard deviation). The differences between groups were analysed using Mann–Whitney test. N = 6–8. White bars- B6 CD group, grading red bars- B6 CD group treated with SB431542, light green bars- B6 HFD group, grading green bars- B6 HFD group treated with Nodal. Asterisks indicate significant differences: ∗p < 0.05; ∗∗p < 0.01; ∗∗∗p < 0.001. (For interpretation of the references to color in this figure legend, the reader is referred to the Web version of this article.)
Figure 7
Figure 7
Compromised steroidogenesis in the ovaries of obese mice is mediated by suppressed Nodal signalling in the TC compartment via SOCS3 and Smad7 increased activity. Steroidogenesis is a complex process, primarily stimulated by luteinizing hormone (LH), that activates the cascade of signals within the theca cell (TC) compartment. Firstly, steroidogenic acute regulatory protein (StAR) facilitates cholesterol transport to the mitochondrial inner membrane. Then, mitochondrial enzymes convert intermediate products. Cholesterol is converted into pregnenolone by cytochrome P450 11A1 (CYP11A1), which is next converted into progesterone by 3B Hydroxysteroid dehydrogenase (3BHSD). CYP17A1 converts progesterone in to androstenedione, which is transformed into testosterone by 17BHSD. Finally, testosterone is transported from TC to the granulosa cells (GC), where the conversion into estradiol (E2) is done CYP19A1. E2 can bind to its receptor on TC- estradiol receptor isoform a (ERa). In mice fed chow diet (CD), normal body weight is maintained, and ovarian leptin and Nodal signalling are preserved, ensuring that steroidogenesis in the TC remains intact. Nodal supports the expression of luteinizing hormone receptor (LHR), ERa, StAR and CYP17A1. Contrarily, when females are fed a high fat diet (HFD) and become obese, ovarian leptin resistance triggers increased SOCS3 and SMAD7 production, particularly in the TC. Subsequently, SMAD7 inhibits Nodal signalling disrupting its supportive role on steroidogenesis within the TC. Consequently, steroidogenesis is impaired in obese mice.

Similar articles

References

    1. Gabrielli A.P., Manzardo A.M., Butler M.G. Exploring genetic susceptibility to obesity through genome functional pathway analysis. Obesity. 2017;25(6):1136. doi: 10.1002/OBY.21847. - DOI - PMC - PubMed
    1. Fink B.D., Herlein J.A., Almind K., Cinti S., Kahn C.R., Sivitz W.I. Mitochondrial proton leak in obesity-resistant and obesity-prone mice. Am J Physiol Regul Integr Comp Physiol. 2007;293(5) doi: 10.1152/AJPREGU.00478.2007/ASSET/IMAGES/LARGE/ZH60110760600006.JPEG. - DOI - PubMed
    1. Wołodko K., Walewska E., Adamowski M., Castillo-Fernandez J., Kelsey G., Galvão A. Leptin resistance in the ovary of obese mice is associated with profound changes in the transcriptome of cumulus cells. Cell Physiol Biochem. 2020;54(3):417–437. doi: 10.33594/000000228. - DOI - PubMed
    1. Chu D.T., Malinowska E., Jura M., Kozak L.P. C57BL/6J mice as a polygenic developmental model of diet-induced obesity. Physiol Rep. 2017;5(7) doi: 10.14814/PHY2.13093. - DOI - PMC - PubMed
    1. Kokkotou E., Jeon J.Y., Wang X., Marino F.E., Carlson M., Trombly D.J., et al. Mice with MCH ablation resist diet-induced obesity through strain-specific mechanisms. Am J Physiol Regul Integr Comp Physiol. 2005;289(1 58–1):117–124. doi: 10.1152/AJPREGU.00861.2004/ASSET/IMAGES/LARGE/ZH60070527910005.JPEG. - DOI - PubMed