

Upregulation of multiple key molecules is correlated with poor prognosis and immune infiltrates in hepatocellular carcinoma by bulk and single-cell RNA-seq
- PMID: 39537209
- PMCID: PMC11719102
- DOI: 10.18632/aging.206151
Upregulation of multiple key molecules is correlated with poor prognosis and immune infiltrates in hepatocellular carcinoma by bulk and single-cell RNA-seq
Abstract
Background: Recent discoveries in hepatocellular carcinoma (HCC) unveil key molecules. However, due to liver cancer's high heterogeneity, predicting patient prognosis is challenging. This study aims to construct a model for predicting HCC prognosis using multiple key genes.
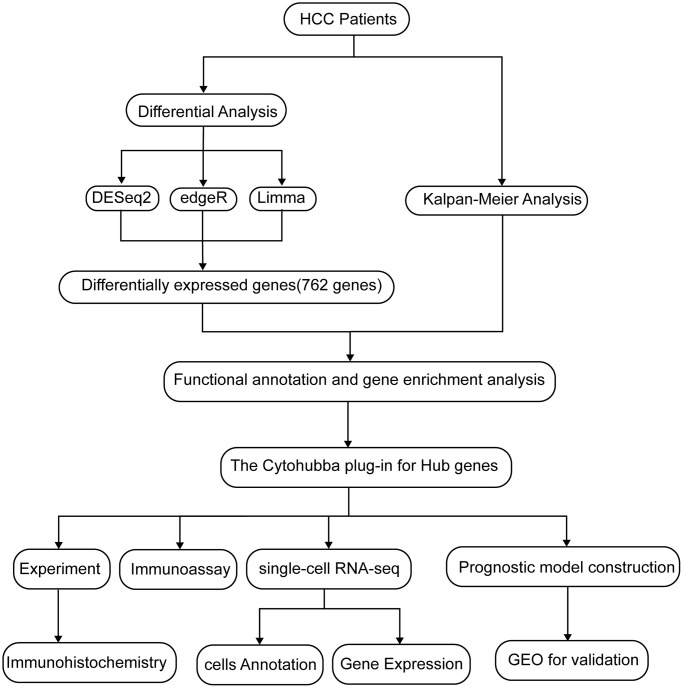
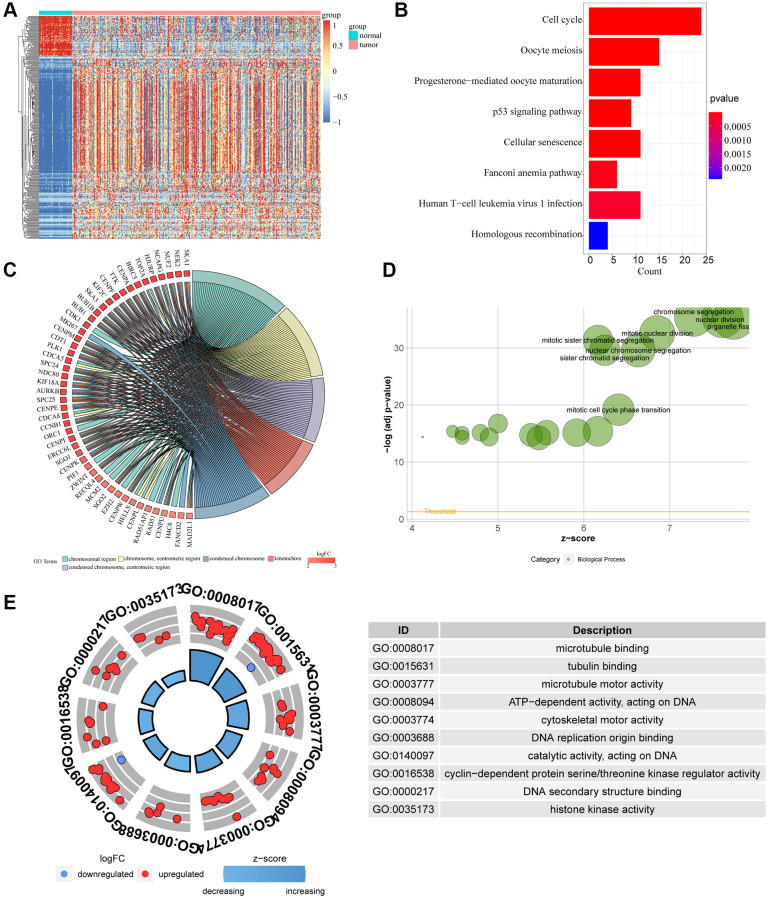
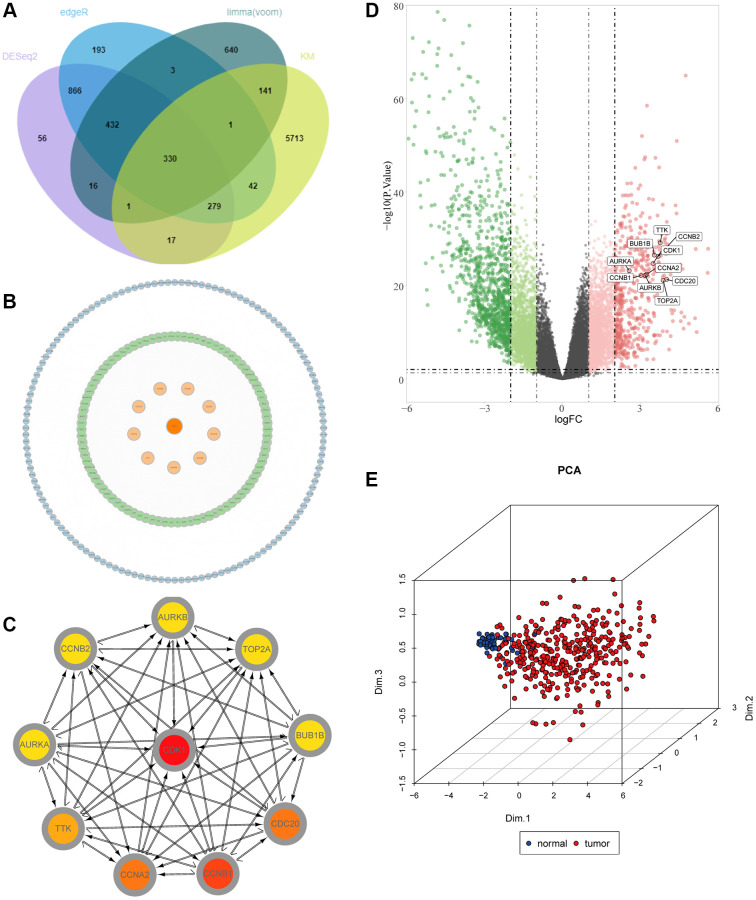
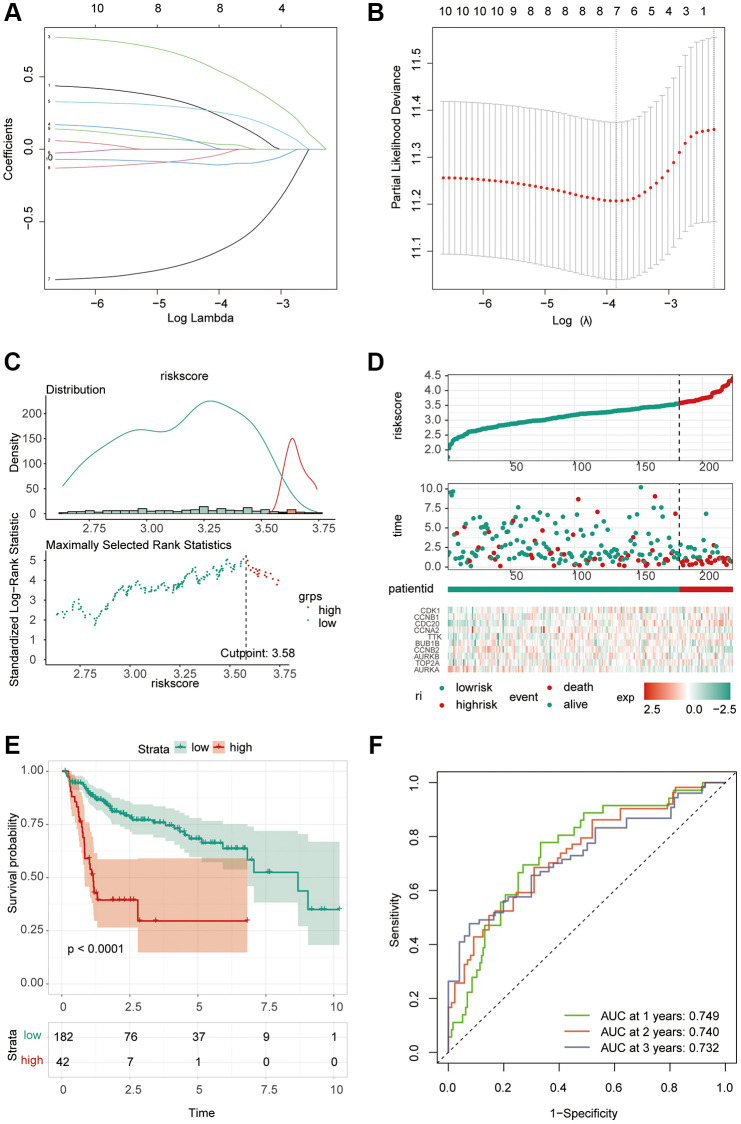
Methods: TCGA provided RNA expression and clinical data, differentially analyzed by DESeq2, edgeR, and Limma. The hub gene was pinpointed via CytoHubba's degree algorithm in Cytoscape. GO and KEGG analyses illuminated potential pathways. Single-cell sequencing detailed key gene expression in diverse cell types. The LASSO regression model predicted patient prognosis.
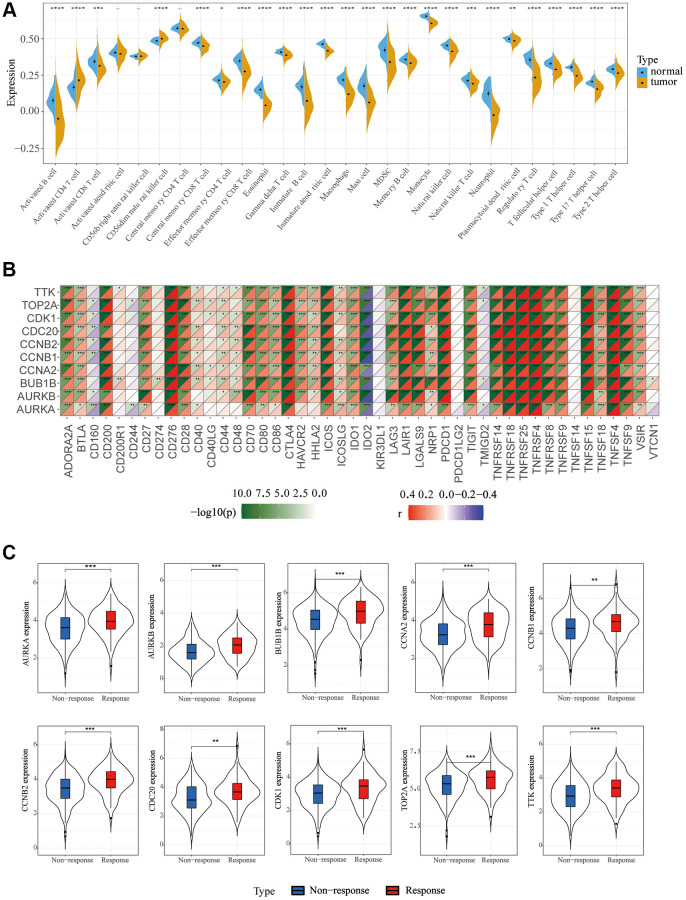
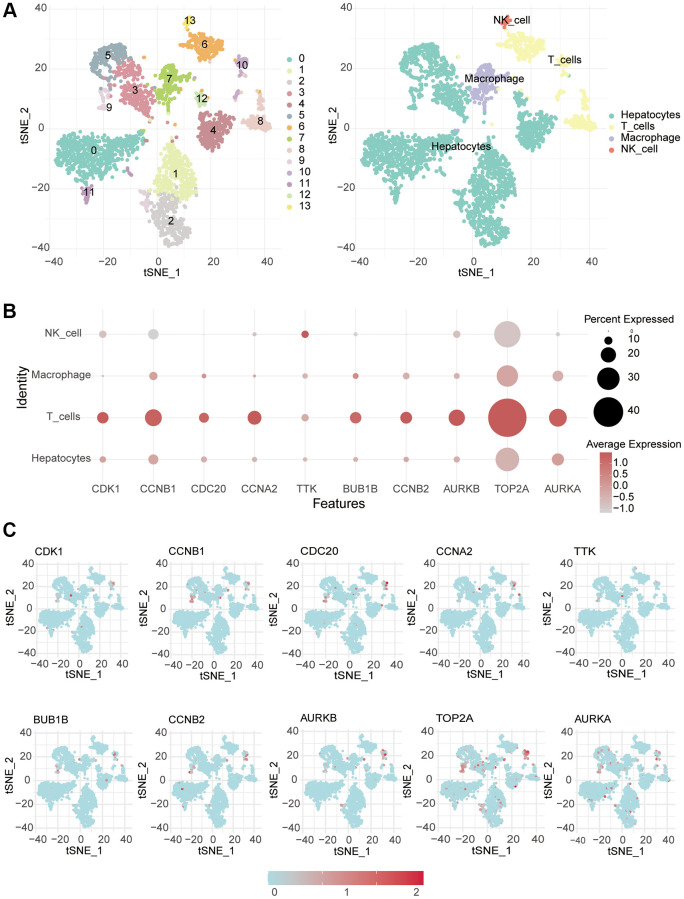
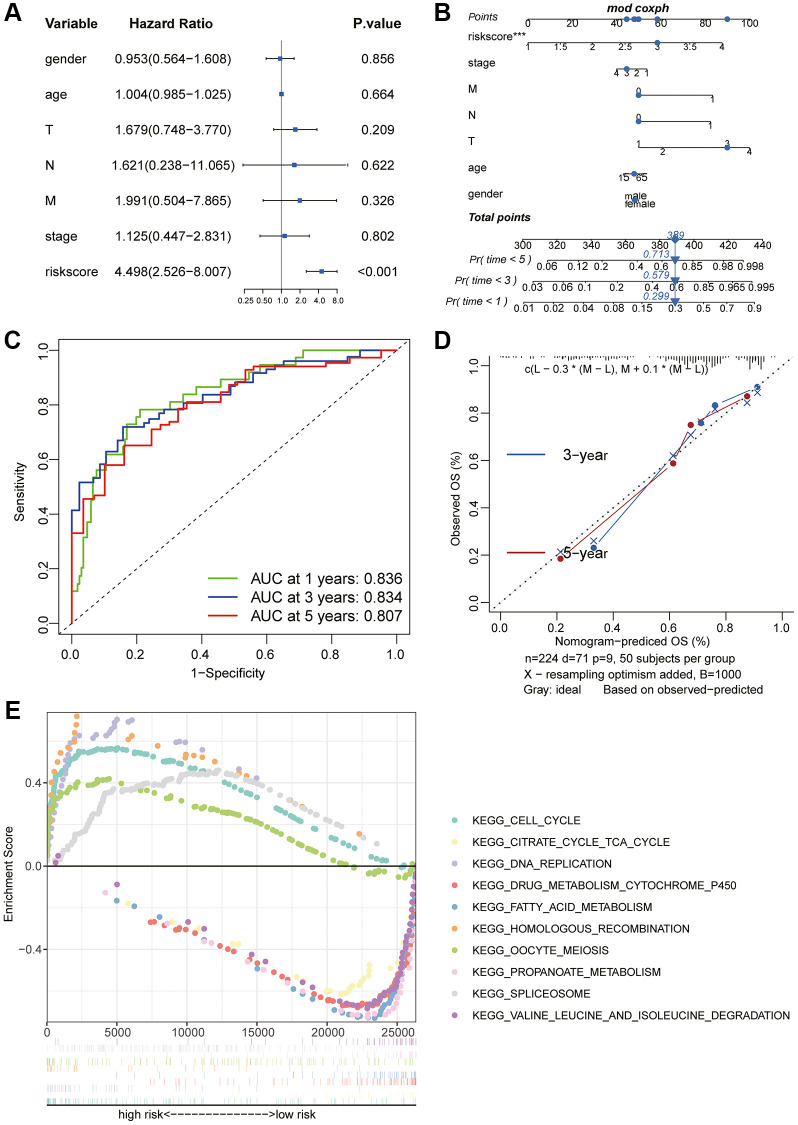
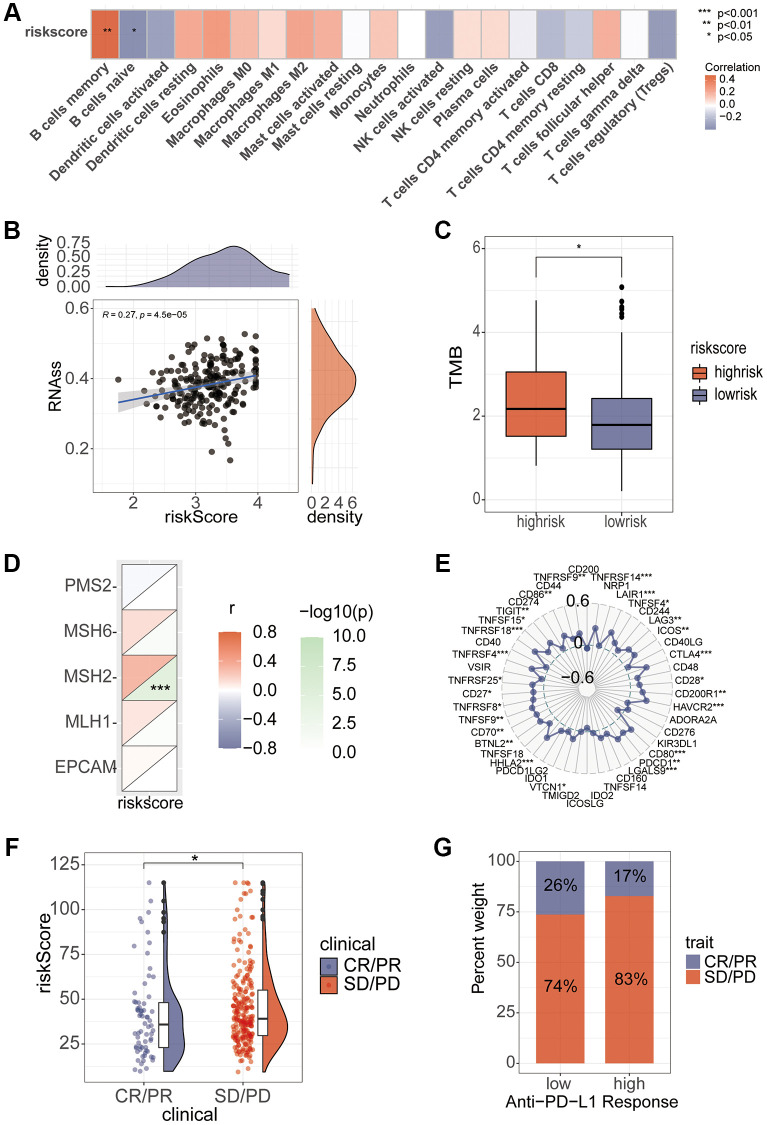
Result: In the RNA-seq analysis using three R packages, we identified 762 differentially expressed genes, with Cytoscape revealing ten key genes showing significant prognostic value (P < 0.05). GO and KEGG analyses highlighted key biological processes and pathways. IHC confirmed higher expression in cancer tissues. Reduced immune cell infiltration was observed in HCC tissues, and immune checkpoint analysis showed a strong correlation between PD1, CTLA4, and hub genes. Single-cell sequencing indicated higher expression of key genes in immune cells than hepatocytes. Cox analysis validated the riskScore as a reliable, independent prognostic marker (HR = 4.498, 95% CI: 2.526-8.007).
Conclusions: The results from differential analysis using three R packages are robust, revealing genes closely linked to immune cell infiltration in the tumor microenvironment. Additionally, a validated prognostic model for liver cancer was established based on key genes.
Keywords: hepatocellular carcinoma; immune infiltration; immunotherapy; prognostic signature; tumor microenvironment.
Conflict of interest statement
Figures
Similar articles
-
Integrated Analysis of Single-Cell and Bulk RNA-Sequencing Defines N7-Methylguanosine (m7G)-Mediated Modifications' Role in Prognosis and the Tumor Immune Microenvironment in Hepatocellular Carcinoma.Cancer Med. 2025 Jun;14(11):e70992. doi: 10.1002/cam4.70992. Cancer Med. 2025. PMID: 40485623 Free PMC article.
-
Multi-omics identification of a polyamine metabolism related signature for hepatocellular carcinoma and revealing tumor microenvironment characteristics.Front Immunol. 2025 Apr 22;16:1570378. doi: 10.3389/fimmu.2025.1570378. eCollection 2025. Front Immunol. 2025. PMID: 40330470 Free PMC article.
-
Integrated single-cell and bulk transcriptome analysis of R-loop score-based signature with regard to immune microenvironment, lipid metabolism and prognosis in HCC.Front Immunol. 2025 Jan 9;15:1487372. doi: 10.3389/fimmu.2024.1487372. eCollection 2024. Front Immunol. 2025. PMID: 39850878 Free PMC article.
-
Unraveling the Heterogeneity of Tumor Immune Microenvironment in Hepatocellular Carcinoma by SingleCell RNA Sequencing and its Implications for Prognosis and Therapeutic Response.Turk J Gastroenterol. 2024 Nov 28;35(12):876-888. doi: 10.5152/tjg.2024.24118. Turk J Gastroenterol. 2024. PMID: 39641225 Free PMC article. Review.
-
Pinpointing the integration of artificial intelligence in liver cancer immune microenvironment.Front Immunol. 2024 Dec 20;15:1520398. doi: 10.3389/fimmu.2024.1520398. eCollection 2024. Front Immunol. 2024. PMID: 39759506 Free PMC article. Review.
Cited by
-
Systemic immune inflammation mediates the association of serum omega-3 and omega-6 polyunsaturated fatty acids with biological aging: a national population-based study.Aging Clin Exp Res. 2025 Mar 8;37(1):74. doi: 10.1007/s40520-025-02964-2. Aging Clin Exp Res. 2025. PMID: 40057623 Free PMC article.
References
-
- Huang XY, Zhang PF, Wei CY, Peng R, Lu JC, Gao C, Cai JB, Yang X, Fan J, Ke AW, Zhou J, Shi GM. Circular RNA circMET drives immunosuppression and anti-PD1 therapy resistance in hepatocellular carcinoma via the miR-30-5p/snail/DPP4 axis. Mol Cancer. 2020; 19:92. 10.1186/s12943-020-01213-6 - DOI - PMC - PubMed
MeSH terms
Substances
LinkOut - more resources
Full Text Sources
Medical
