

Differences in the pathological, transcriptomic, and prognostic implications of lymphoid structures between primary and metastatic cutaneous melanomas
- PMID: 39537211
- PMCID: PMC11575263
- DOI: 10.1136/jitc-2024-009231
Differences in the pathological, transcriptomic, and prognostic implications of lymphoid structures between primary and metastatic cutaneous melanomas
Abstract
Background: While the prognostic role of tertiary lymphoid structures (TLS) has been well studied in solid cancers, the prevalence and impact of immature precursor lymphoid structures known as lymphoid aggregates (LA) remain unresolved in relation to the disease process. In this study, we examined characteristics and the prognostic utility of LA and TLS status in histological samples from patients with melanoma.
Methods: We assessed The Cancer Genomic Atlas-skin cutaneous melanoma digital slides and melanoma specimens from the University of Pittsburgh for the presence of LA and TLS using H&E staining, multiplex immunofluorescence (mIF) and transcriptomic analyses. Cox proportional hazard regression models were used to assess the prognostic value associated with the presence of lymphoid structures in melanomas.
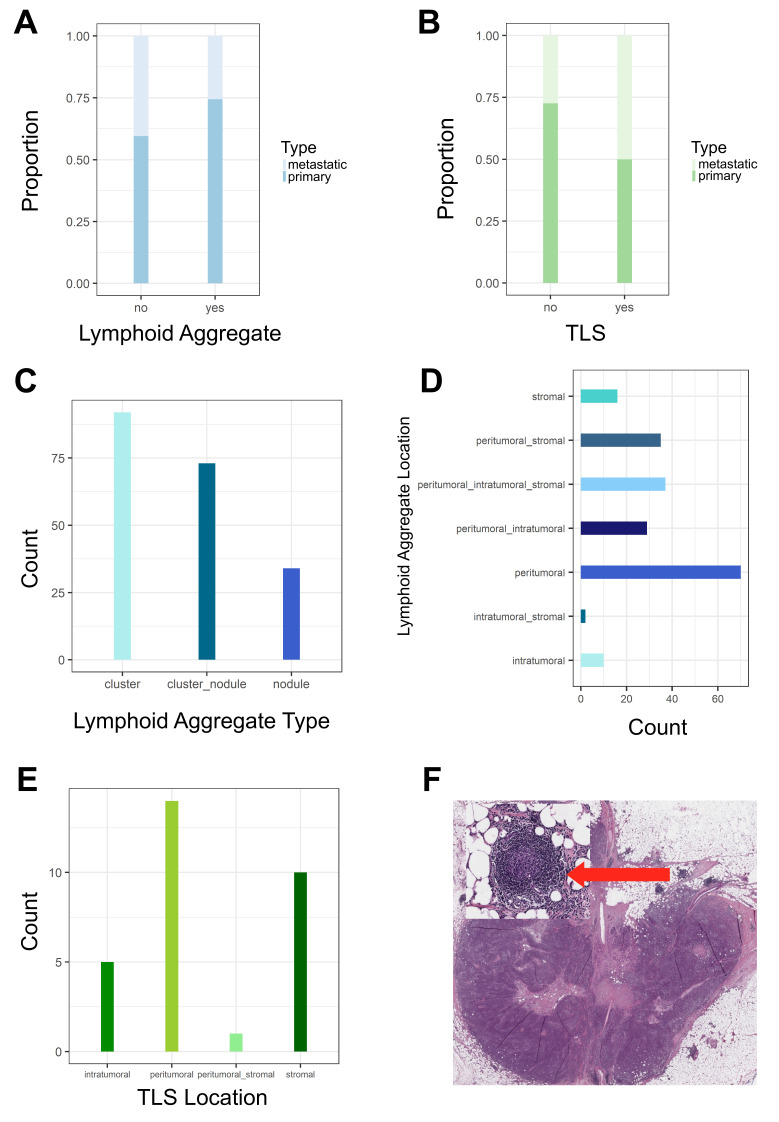
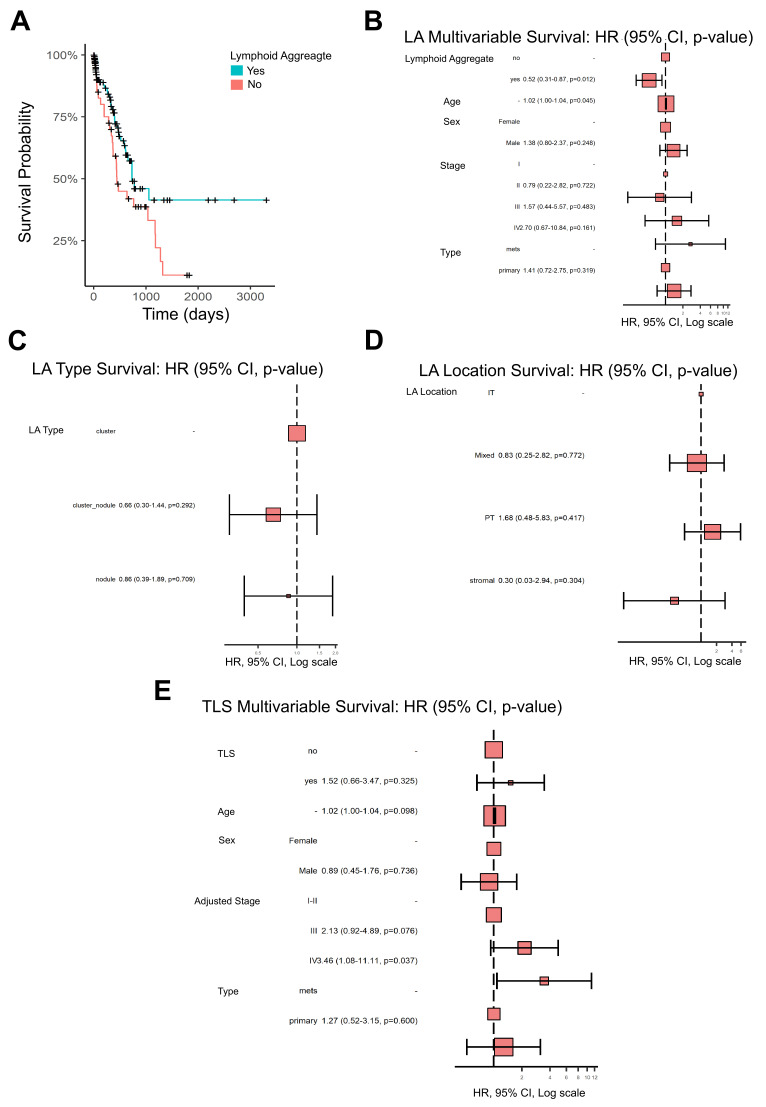
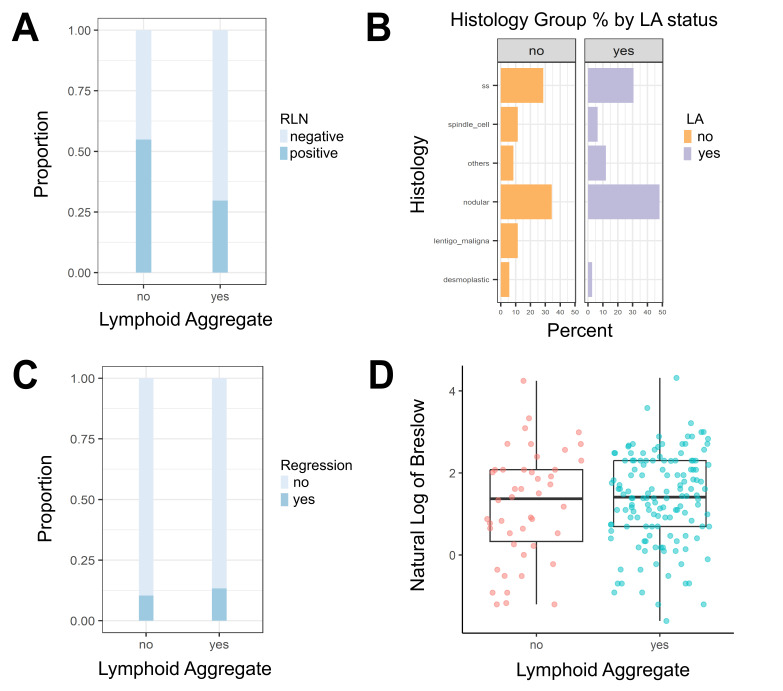
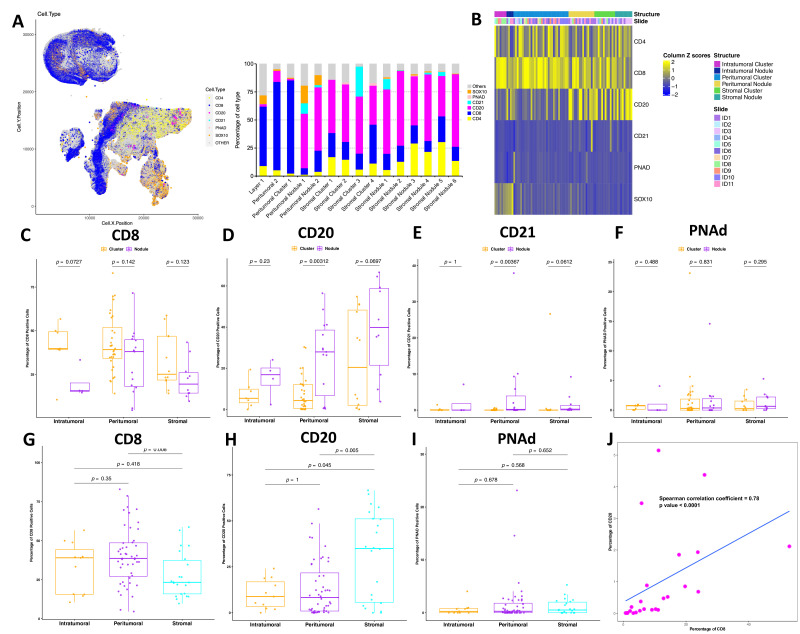
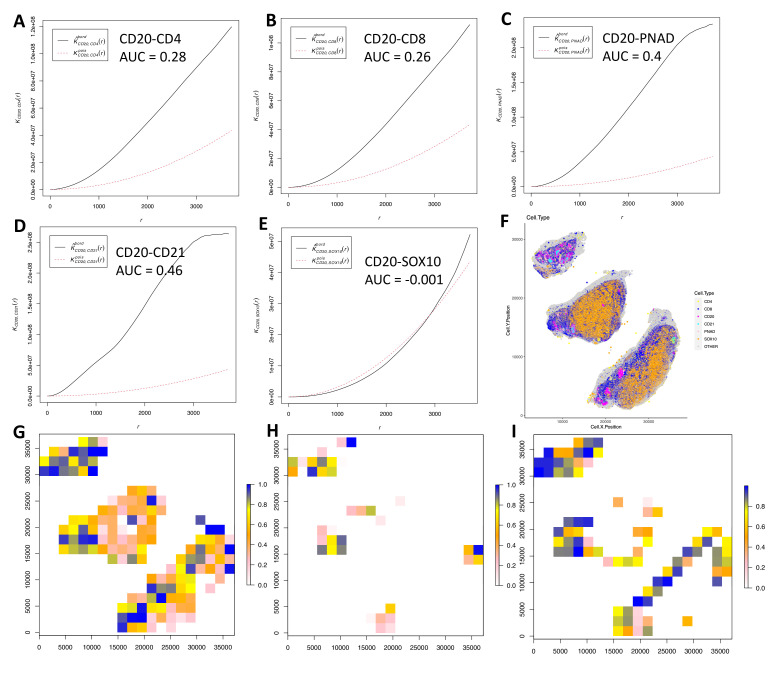
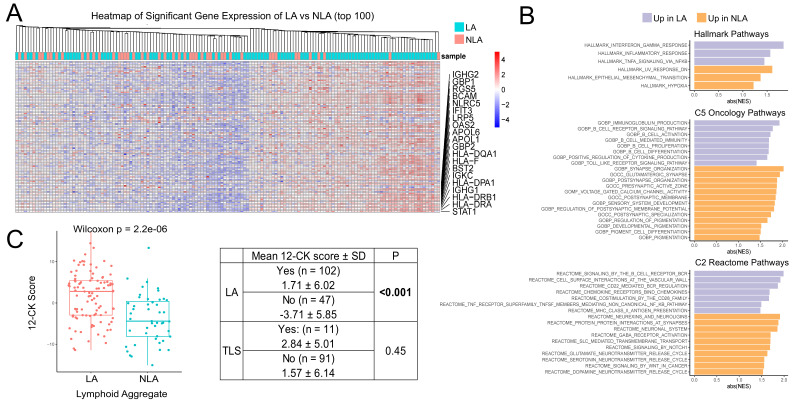
Results: A total of 278 evaluable samples were analyzed and split into primary melanomas in skin (N=195) and metastatic melanomas involving skin/subcutaneous/soft tissue sites (N=83). 72% of tumor specimens contained histologically defined LA located in peritumoral (34%), intratumoral (5.6%) or stromal (6.1%) locations, with the remaining samples (54.3%) exhibiting LA in multiple locations. In contrast to LA which tended to form more commonly in primary melanoma samples, TLS with germinal centers predominantly formed in peritumoral (45.2%) or stromal (35.5%) locations in metastatic melanomas (p=0.02), with TLS observed in 11% of all melanoma specimens evaluated. mIF analyses revealed cellular heterogeneity of lymphoid structures, with CD20+ (B) cells present in nodule-shaped and stromal locations where they exhibited a high degree of colocalization with CD4+ and CD8+ T cells. A previously defined 12-chemokine gene expression score was significantly higher in samples with evidence of LA versus none (p<0.001), and samples without LA/TLS were enriched with pigmentation/neural network gene signatures. The presence of LA was significantly associated with tumor-free regional lymph node status (p=0.002). In multivariable analysis, after adjusting for age, sex, sample type, and stage, the presence of LA was associated with improved patient overall survival (OS) (HR=0.52, 95% CI 0.31 to 0.87, p=0.01).
Conclusion: Melanoma frequently contains LA, which tends to form in diverse locations in the tumor microenvironment in association with improved overall survival and tumor-free regional lymph node status in patients with primary disease.
Keywords: B cell; Immunotherapy; Melanoma.
© Author(s) (or their employer(s)) 2024. Re-use permitted under CC BY-NC. No commercial re-use. See rights and permissions. Published by BMJ.
Conflict of interest statement
Competing interests: JMK: consultation with Amgen (with Davar and Najjar), Ankyra Therapeutics, Applied Clinical Intelligence, Axio Research, Becker Pharmaceutical Consulting, Bristol Myers Squibb, Cancer Network, Cancer Study Group, Checkmate Pharmaceuticals, CytomX Therapeutics, DermTech, Fenix Group International, Harbour BioMed, Immunocore, iOnctura, Iovance Biotherapeutics, IQVIA, Istari Oncology, Jazz Pharmaceuticals, Lytix Biopharma AS, Magnolia Innovation, Merck, Natera, Novartis Pharmaceuticals, OncoCyte Corporation, OncoSec Medical, PathAI, Pfizer, Piper Sandler & Co., PyrOjas Corporation, Regeneron Pharmaceuticals, Replimune, Scopus BioPharma, SR One Capital Management, Takeda, Valar Labs. JJM is Associate Center Director at Moffitt Cancer Center, has ownership interest in Aleta Biotherapeutics, CG Oncology, Turnstone Biologics, Ankyra Therapeutics, and AffyImmune Therapeutics, and is a paid consultant/paid advisory board member for ONCoPEP, CG Oncology, Turnstone Biologics, Vault Pharma, Ankyra Therapeutics, AffyImmune Therapeutics, UbiVac, Vycellix, and Aleta Biotherapeutics.
Figures
Similar articles
-
Heterogeneity in tertiary lymphoid structure B-cells correlates with patient survival in metastatic melanoma.J Immunother Cancer. 2021 Jun;9(6):e002273. doi: 10.1136/jitc-2020-002273. J Immunother Cancer. 2021. PMID: 34103353 Free PMC article.
-
Expression of lymphoid structure-associated cytokine/chemokine gene transcripts in tumor and protein in serum are prognostic of melanoma patient outcomes.Front Immunol. 2023 Jun 22;14:1171978. doi: 10.3389/fimmu.2023.1171978. eCollection 2023. Front Immunol. 2023. PMID: 37435077 Free PMC article.
-
A Standardized Analysis of Tertiary Lymphoid Structures in Human Melanoma: Disease Progression- and Tumor Site-Associated Changes With Germinal Center Alteration.Front Immunol. 2021 Jun 24;12:675146. doi: 10.3389/fimmu.2021.675146. eCollection 2021. Front Immunol. 2021. PMID: 34248957 Free PMC article.
-
Cutaneous Melanoma: Mutational Status and Potential Links to Tertiary Lymphoid Structure Formation.Front Immunol. 2021 Mar 4;12:629519. doi: 10.3389/fimmu.2021.629519. eCollection 2021. Front Immunol. 2021. PMID: 33746966 Free PMC article. Review.
-
Tumor-Infiltrating Lymphocytes and Their Prognostic Value in Cutaneous Melanoma.Front Immunol. 2020 Sep 10;11:2105. doi: 10.3389/fimmu.2020.02105. eCollection 2020. Front Immunol. 2020. PMID: 33013886 Free PMC article. Review.
Cited by
-
Proteogenomic Profiling of Treatment-Naïve Metastatic Malignant Melanoma.Cancers (Basel). 2025 Feb 27;17(5):832. doi: 10.3390/cancers17050832. Cancers (Basel). 2025. PMID: 40075679 Free PMC article.
References
MeSH terms
Grants and funding
LinkOut - more resources
Full Text Sources
Medical
Research Materials
Miscellaneous