. 2024 Nov 13;15(1):9818.
doi: 10.1038/s41467-024-53973-0.

Charting and probing the activity of ADARs in human development and cell-fate specification

Affiliations

Charting and probing the activity of ADARs in human development and cell-fate specification

Amir Dailamy et al. Nat Commun. .

Abstract

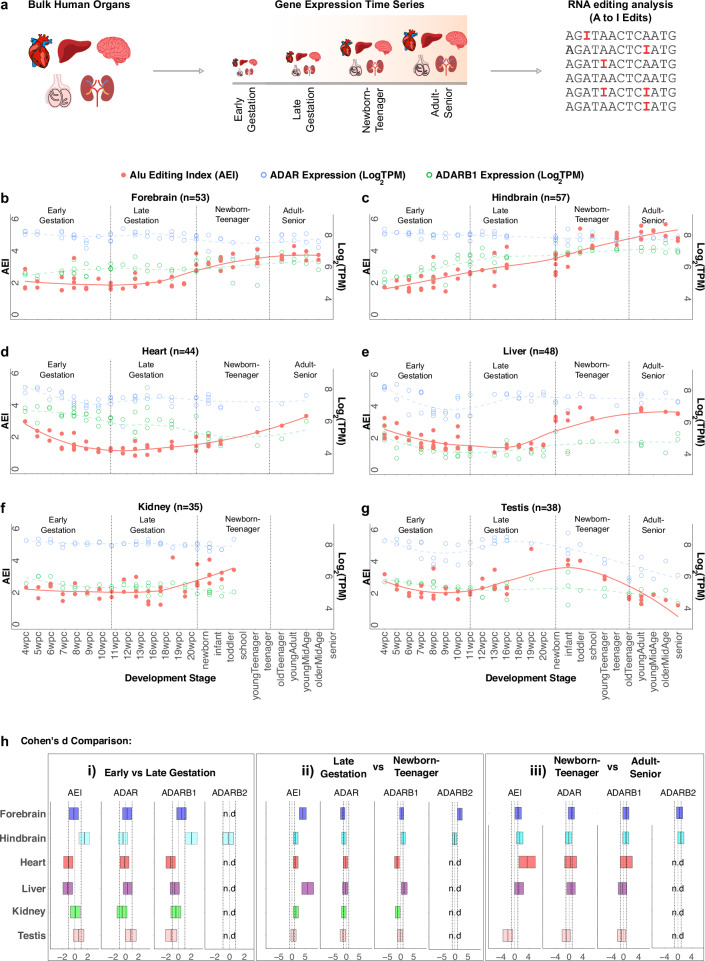
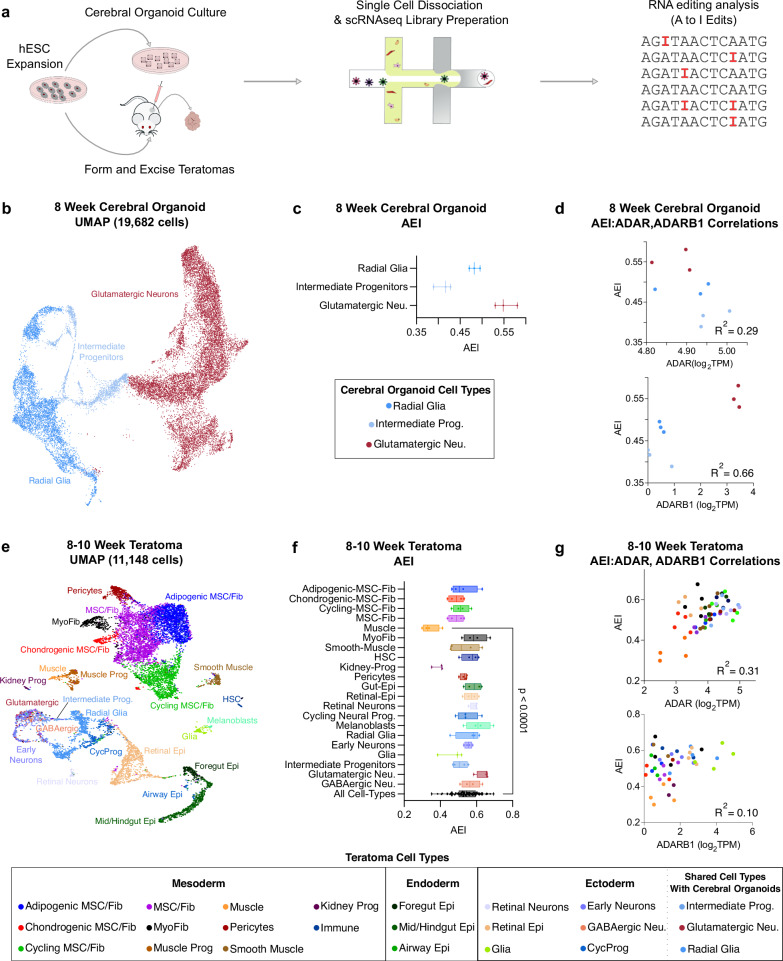
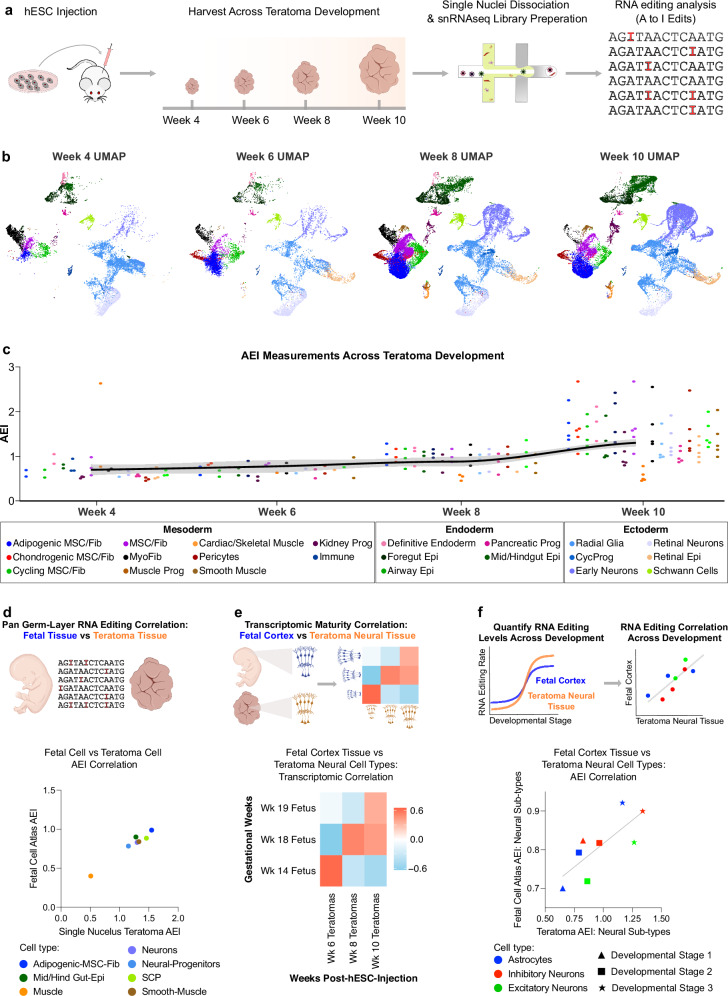
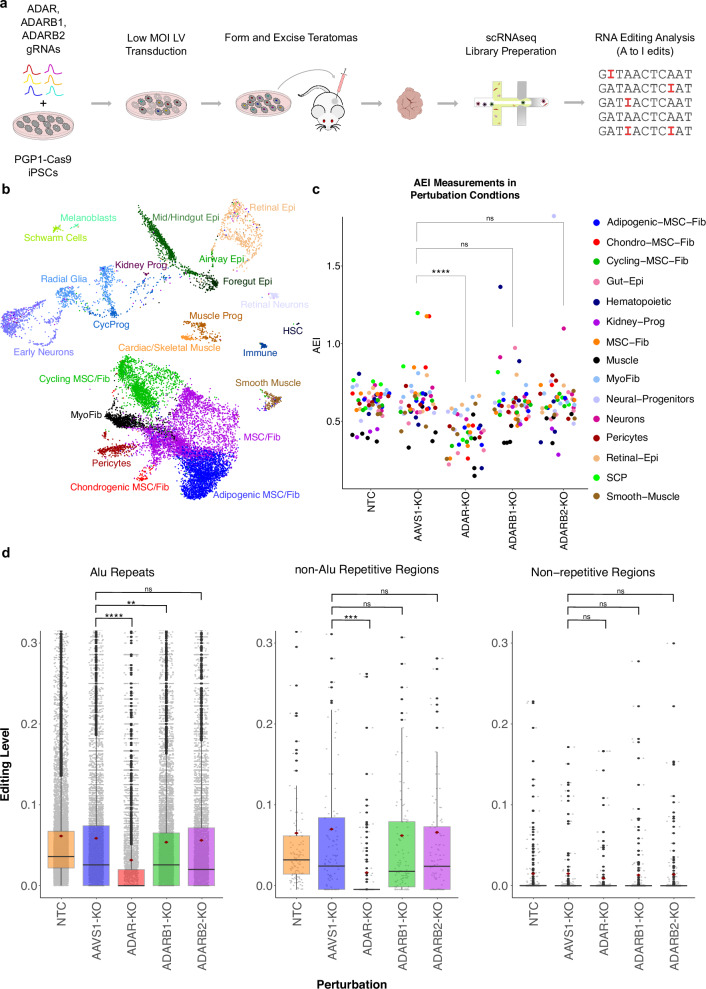
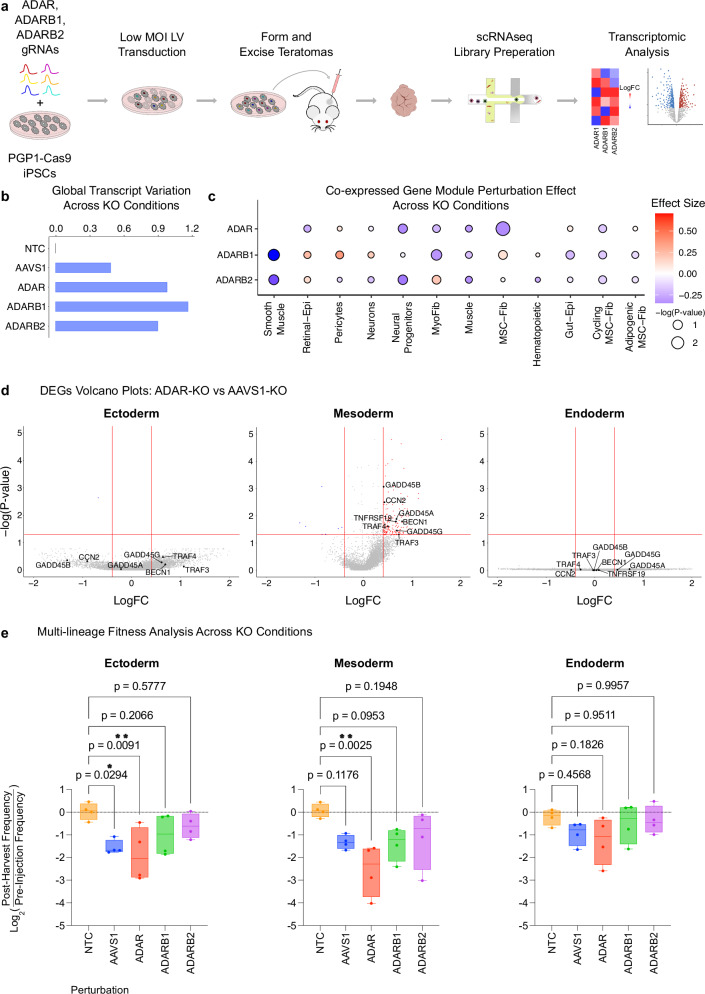
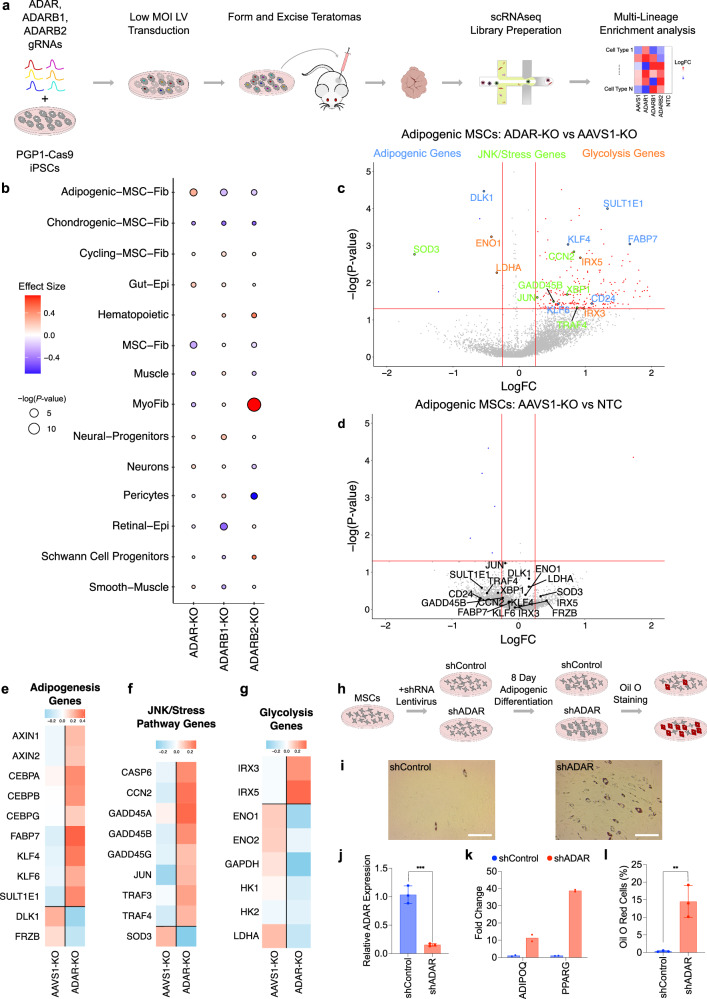
Adenosine deaminases acting on RNA (ADARs) impact diverse cellular processes and pathological conditions, but their functions in early cell-fate specification remain less understood. To gain insights here, we began by charting time-course RNA editing profiles in human organs from fetal to adult stages. Next, we utilized hPSC differentiation to experimentally probe ADARs, harnessing brain organoids as neural specific, and teratomas as pan-tissue developmental models. We show that time-series teratomas faithfully recapitulate fetal developmental trends, and motivated by this, conducted pan-tissue, single-cell CRISPR-KO screens of ADARs in teratomas. Knocking out ADAR leads to a global decrease in RNA editing across all germ-layers. Intriguingly, knocking out ADAR leads to an enrichment of adipogenic cells, revealing a role for ADAR in human adipogenesis. Collectively, we present a multi-pronged framework charting time-resolved RNA editing profiles and coupled ADAR perturbations in developmental models, thereby shedding light on the role of ADARs in cell-fate specification.


Conflict of interest statement

Competing interests P.M. is a scientific co-founder of Shape Therapeutics, Boundless Biosciences, Navega Therapeutics, Pi Bio, and Engine Biosciences. A.M. is the co-founder of and has an equity interest in TISMOO, a company dedicated to genetic analysis and human brain organogenesis, focusing on therapeutic applications customized to autism spectrum disorders and other neurological diseases. K.Z. is a full-time employee and equity holder of the Altos Labs. The remaining authors declare no competing interests. The terms of these arrangements have been reviewed and approved by the University of California, San Diego in accordance with its conflict of interest policies.

Figures

Fig. 1
Fig. 1. This graphical abstract illustrates our study’s workflow.
We begin by analyzing RNA editing and ADAR expression dynamics across diverse tissue types, utilizing both human organ data and hPSC-derived developmental models. Subsequently, we employed the teratoma for a pan-tissue ADAR perturbation screen, probing the functional roles of ADAR proteins across all three germ layers.
Fig. 2
Fig. 2. Time series bulk RNA editing analysis in human fetal tissues.
a Schematic depicting the workflow for this investigation into RNA editing and ADAR expression dynamics in bulk organ tissues across lifespan. Organ time-series data is binned into 4 developmental groups—early gestation (4–10 wpc), late gestation (11–20 wpc), newborn-to-teenager (0–19 years of age), and adult-to-senior (25–63 years of age)—for conducting comparisons across sequential developmental periods. bg AEI levels (solid red circles), as well as ADAR (open blue circles) and ADARB1 (open green circles) expression values, are charted throughout lifespan for the forebrain (b), hindbrain (c), heart (d), liver (e), kidney (f), and testis (g). h Cohen’s d comparison between sequential time groups for AEI, ADAR, ADARB1, and ADARB2, across all organs (not detected = n.d, box represents 95% confidence interval).
Fig. 3
Fig. 3. Examining the convergence of differentially edited sites across organ systems.
a Schematic depicting the site-specific RNA editing analysis pipeline for developmental bulk organ samples. After bulk organ samples were grouped into prenatal and postnatal groups, differential editing analysis was conducted between these two developmental groups. Finally, an analysis was conducted to find shared and unique differentially edited sites between organs. b Venn diagram illustrating the number of shared and unique prenatal versus postnatal differentially edited sites across all examined organ datasets. c GO term functional annotation of the pan-organ shared differentially edited sites. D List of the input genes that are associated with these corresponding convergent GO terms. ej Charting global A-to-I editing dynamics (AEI), along with the Viral Infection and DNA replication pathway gene scores, across developmental time, for the forebrain (e), hindbrain (f), heart (g), liver (h), kidney (i), and testis (j). Correlation between the gene score sets and the AEI was measured using the Pearson correlation coefficient.
Fig. 4
Fig. 4. Single-cell RNA editing analysis in hESC-derived model systems.
a Workflow schematic for conducting single-cell RNA editing analysis on hESC-derived cerebral organoids and teratomas. b UMAP plot from 8-week cerebral organoids processed through the single-cell RNA sequencing pipeline. c AEI values for all major 8-week cerebral organoid cell-types, with each data point calculated as a pseudo-bulk value from each cerebral organoid cell-type (n = 3 cerebral organoids, error bars represent standard error of the mean). d Correlation between AEI to ADAR expression (top) and to ADARB1 expression (bottom) for all 8 week cerebral organoid cell-types. e Aggregated UMAP plot from 4 H1 teratoma processed through the single-cell RNA sequencing pipeline. f Box-and-whiskers plot showing the AEI values for all major teratoma cell types, with each data point calculated as a pseudo-bulk value (n = 4 WT teratomas, centerline of the box represents the mean, box represents 95% confidence interval, and error bar is standard error of the mean) Significance is tested using a unpaired two-tailed t-test (*p ≤ 0.05, **p ≤ 0.01, ***p ≤ 0.001, and ****p ≤ 0.0001; ns, not significant.) g Correlation between AEI value to ADAR expression (top) and to ADARB1 expression (bottom) for all teratoma cell-types.
Fig. 5
Fig. 5. Single nuclei RNA editing analysis across teratoma development.
a Workflow schematic for running single nuclei RNA editing analysis across teratoma development. b Aggregated and downsampled UMAP plots from H1 teratomas across weeks 4–10 of development, processed through the single-cell RNA sequencing pipeline. 2–5 teratoma samples were processed for each time point. UMAP plots are downsampled so the total number of cells plotted is consistent across all time points. c AEI values for all teratoma cell-types across development. d Pan germ-layer correlation between teratoma cell-types and corresponding cell-types from the Human Fetal Cell Atlas database. e Transcriptomic correlation between time series teratomas and time-resolved human fetal cortex data between Gestational Weeks (GW) 14-19. f RNA editing rate, via AEI, correlation between time series teratomas and time-resolved human fetal cortex data between GW14–19.
Fig. 6
Fig. 6. RNA editing analysis in ADAR-KO teratomas.
a Workflow schematic for ADAR-KO screen in PGP1-Cas9 iPSCs, followed by teratoma formation and downstream single cell RNA editing analysis. b Aggregated UMAP plot from 4 PGP1-Cas9 + ADAR-KO teratomas. c AEI values for all teratoma cell-types in ADAR-KO teratomas. (*p ≤ 0.05, **p ≤ 0.01, ***p ≤ 0.001, and ****p ≤ 0.0001; ns, not significant). d Pan-teratoma site-specific RNA editing analysis across KO conditions. Centerline of the box represents the mean, the box represents the 95% confidence interval, and the error bar is the standard error of the mean. (*p ≤ 0.05, **p ≤ 0.01, ***p ≤ 0.001, and ****p ≤ 0.0001; ns, not significant). n = 5166 ALU repeat sites, n = 84 non-ALU Repetitive Region sites, n = 338 non-Repetitive Region sites. ANOVA is used for comparing the mean and Tukey’s significance test is used to determine which mean differences are statistically significant.
Fig. 7
Fig. 7. Transcriptomic Analysis in ADAR-KO Teratomas Reveals Germ-Layer Specific Fitness Defects.
a Workflow schematic for ADAR-KO screen in PGP1-Cas9 iPSCs, followed by teratoma formation and downstream transcriptomic analysis. b Pan-teratoma global transcriptomic variation across perturbation conditions. c Cell-type specific gene-module effect across perturbation conditions. d Differential expressed genes (DEGs) for ADAR-KO versus AAVS1-KO across the three germ layers. Teratoma cell types from the same germ-layer are transcriptomicaly grouped together. e Multi-lineage fitness analysis assessing the fitness defect across perturbation conditions. Cell counts from the same germ-layer are summed together. N = 4 unique teratomas used as independent biological replicates. Centerline of the box represents the mean, the box represents the 95% confidence interval, and the error bars are the standard error of the mean. (*p ≤ 0.05, **p ≤ 0.01, ***p ≤ 0.001, and ****p ≤ 0.0001; ns, not significant).
Fig. 8
Fig. 8. Enrichment analysis in ADAR-KO teratomas reveals ADAR as a potential inhibitor of human adipogenesis.
a Workflow schematic for ADAR-KO screen in PGP1-Cas9 iPSCs, followed by teratoma formation and downstream cell-type enrichment analysis. (B) Enrichment analysis depicting cell-type specific enrichment or depletion across perturbation conditions. c DEGs from comparing Adipogenic MSC ADAR-KO cells versus Adipogenic MSC AAVS1-KO cells. Genes related to adipogenesis (blue), JNK/stress pathways (green), and glycolysis (red) are highlighted. d DEG analysis comparing Adipogenic MSC AAVS1-KO cells versus Adipogenic MSC NTC cells. Genes related to adipogenesis, JNK/stress pathways, and glycolysis are denoted. e Gene expression analysis across a subset of adipogenic pathway genes in Adipogenic MSC ADAR-KO cells versus Adipogenic MSC AAVS1-KO cells. f Gene expression analysis across a subset of JNK/stress pathway genes in Adipogenic MSC ADAR-KO cells versus Adipogenic MSC AAVS1-KO cells. g Gene expression analysis across a subset of glycolysis pathway genes in Adipogenic MSC ADAR-KO cells versus Adipogenic MSC AAVS1-KO cells. h Schematic depicting experimental validation of ADAR’s role in adipogenic differentiation from MSCs. i Oil O Red staining of 8 day differentiated Adipogenic-MSCs (Scale bar = 250 μm). j ADAR transcript quantification in MSCs post shRNA transduction, at day 0 of adipogenic differentiation (n = 3 biological replicates, error bars represent standard error of the mean). (*p ≤ 0.05, **p ≤ 0.01, ***p ≤ 0.001, and ****p ≤ 0.0001; ns, not significant.) k ADIPOQ and PPARG transcript quantification in MSCs post shRNA transduction, at day 8 of adipogenic differentiation (n = 2 biological replicates). l Quantification of Oil O red percent positive Adipogenic-MSCs. Full tilescan images of a 48-well are taken and quantified with respect to total DAPI+ cells (n = 3 biological replicates, error bars represent standard error of the mean). (*p ≤ 0.05, **p ≤ 0.01, ***p ≤ 0.001, and ****p ≤ 0.0001; ns, not significant).

References

    1. Nishikura, K. Functions and regulation of RNA editing by ADAR deaminases. Annu. Rev. Biochem.79, 321–349 (2010). - PMC - PubMed
    1. Jain, M., Jantsch, M. F. & Licht, K. The editor’s I on disease development. Trends Genet.35, 903–913 (2019). - PubMed
    1. Quin, J. et al. ADAR RNA modifications, the epitranscriptome and innate immunity. Trends Biochem. Sci.46, 758–771 (2021). - PubMed
    1. Samuel, C. E. Adenosine deaminases acting on RNA (ADARs) are both antiviral and proviral. Virology411, 180–193 (2011). - PMC - PubMed
    1. Reich, D. P., Tyc, K. M. & Bass, B. L. C. elegans ADARs antagonize silencing of cellular dsRNAs by the antiviral RNAi pathway. Genes Dev32, 271–282 (2018). - PMC - PubMed

Publication types

Associated data