. 2024 Nov 13;15(1):9824.
doi: 10.1038/s41467-024-54056-w.

A vagus nerve dominant tetra-synaptic ascending pathway for gastric pain processing

Affiliations

A vagus nerve dominant tetra-synaptic ascending pathway for gastric pain processing

Fu-Chao Zhang et al. Nat Commun. .

Abstract

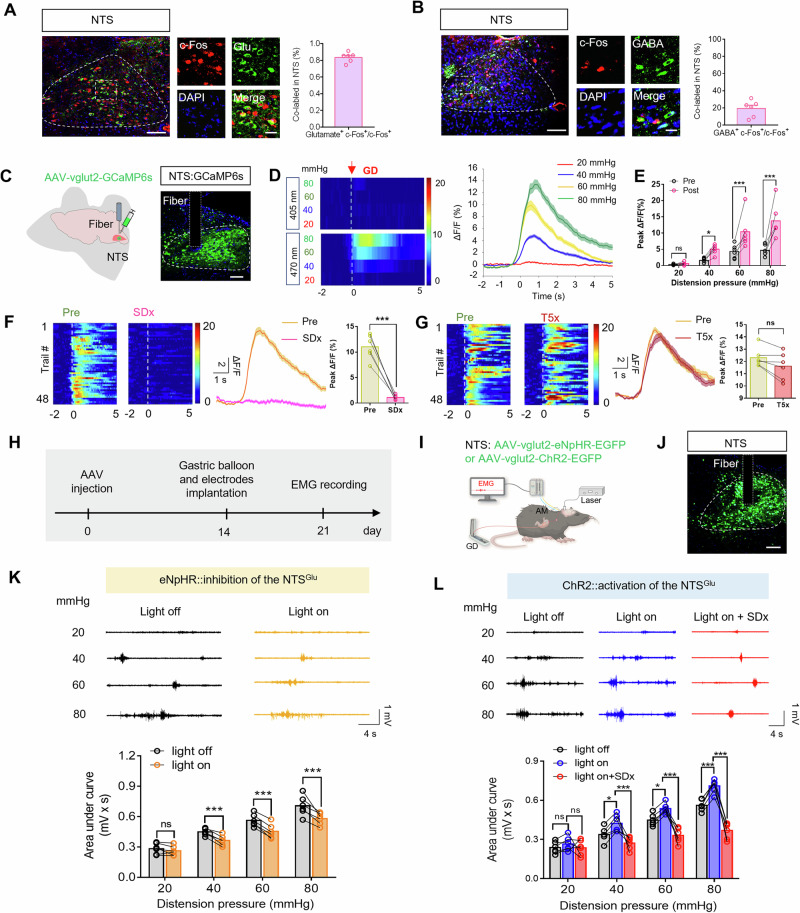
Gastric pain has limited treatment options and the mechanisms within the central circuitry remain largely unclear. This study investigates the central circuitry in gastric pain induced by noxious gastric distension (GD) in mice. Here, we identified that the nucleus tractus solitarius (NTS) serves as the first-level center of gastric pain, primarily via the vagus nerve. The prelimbic cortex (PL) is engaged in the perception of gastric pain. The lateral parabrachial nucleus (LPB) and the paraventricular thalamic nucleus (PVT) are crucial regions for synaptic transmission from the NTS to the PL. The glutamatergic tetra-synaptic NTS-LPB-PVT-PL circuitry is necessary and sufficient for the processing of gastric pain. Overall, our finding reveals a glutamatergic tetra-synaptic NTS-LPB-PVT-PL circuitry that transmits gastric nociceptive signaling by the vagus nerve in mice. It provides an insight into the gastric pain ascending pathway and offers potential therapeutic targets for relieving visceral pain.


Conflict of interest statement

Competing interests The authors declare that they have no competing interests.

Figures

Fig. 1
Fig. 1. Identification of the stomach-vagus-NTS neural pathway.
A Schematic representation of GD and c-Fos staining in mice. B Heatmap illustrating the changes of c-Fos expression in the NTS, LPB, PVT, PL, DRN, LC, DMH, LH, PVH, and the BNST following GD stimulation (n = 3 mice). C Representative images of c-Fos expression in the NTS, LPB, PVT, and PL in male and female mice. D Schematic diagram of gastric wall injection of HSV-EGFP. E From left to right, representative images depict neurons labeled with EGFP in the NTS, NG, and SC following HSV-EGFP injection into the gastric wall. F Schematic diagram of mouse gastric wall injection with HSV-EGFP with SDx and T5x, respectively procedures (left). After SDx and T5x, representative images of the NTS expressing HSV-EGFP (right). G Schematic diagram of GD with SDx and T5x, respectively procedures (left). After SDx and T5x, representative images and statistical analysis of c-Fos expression in the NTS under the same distension pressure (middle and right, n = 3 mice, P = 0.0014). GD gastric distension, EMG electromyographic, AUC the area under the curve, NTS the solitary nucleus, LPB lateral parabrachial nucleus, PVT paraventricular thalamic nucleus, PL prelimbic cortex, DRN dorsal nucleus of the middle suture, LC locus coeruleus, DMH dorsomedial hypothalamic nucleus, LH lateral hypothalamus, PVH paraventricular nucleus of the hypothalamus, BNST bed nucleus of the stria terminalis, NG nodose ganglion, SC spinal cord, SDx subdiaphragmatic vagotomy, T5x thoracic spinal cord transection at the T5 level. Scale bar = 100  μm in all Fig. Significance was assessed by two-way repeated-measure ANOVA in (B) and two-sided Student’s t-test in (G). **P < 0.01, ***P < 0.001. All data are presented as mean values ± SEM. Similar results were obtained in three independent experiments and the data shown were from one representative experiment in (E, F).
Fig. 2
Fig. 2. Identification of a glutamatergic tetra-synaptic connectivity pathway.
A Schematic of the anterograde virus tracing strategy. Typical images of virus injection sites within the NTS and expression in the PL (n = 3 mice). B Schematic of the retrograde virus tracing strategy. Typical images of virus injection sites within the PL and expression in the NTS (n = 3 mice). C Typical images of AAV2/9-vglut2-EGFP injection sites within the NTS and viral expression in the LPB and the PVT (n = 3 mice). D Typical images of AAV2/Retro-mCherry injection sites within the PL and viral expression in the LPB and the PVT (n = 3 mice). E, F Identification of the NTS-LPB-PVT neural circuit. E Schematic of the anterograde trans-synaptic tracing (left). Representative images of viral expression in the LPB (middle). Representative images and quantification analysis showing the EGFP-labeled neurons in the LPB traced from the NTS colocalized with Glutamate and GABA antibody (right, n = 6 mice). F Image of the NTS-innervated LPB neurons and their axonal terminals in the PVT. G Typical images of AAV2/9-vglut2-EGFP injection sites within the LPB and viral expression in the PVT (n = 3 mice). H Typical images of AAV2/Retro-mCherry injection sites within the PVT and viral expression in the LPB (n = 3 mice). I, J Identification of the LPB-PVT-PL neural circuit. I Schematic of the anterograde trans-synaptic tracing (left). Representative images of viral expression in the PVT (middle). Representative images and quantification analysis showing the EGFP-labeled neurons in the PVT traced from the LPB colocalized with glutamate and GABA antibody (right, n = 6 mice). J Image of the LPB-innervated PVT neurons and their axonal terminals in the PL. K Typical images of AAV2/9-vglut2-EGFP injection sites within the PVT and viral expression in the PL (n = 5 mice). L Left: schematic of the anterograde trans-synaptic tracing. Middle: representative images of viral expression in the PL. Right: representative images and quantification analysis showing the EGFP-labeled neurons in the PL traced from the LPB colocalized with glutamate and GABA antibody (n = 6 mice). Scale bar = 50 μm in all figures.
Fig. 3
Fig. 3. The NTSGlu regulates gastric pain behavior by the vagus nerve.
A Representative images of co-expressed c-Fos neurons (red), glutamatergic neurons (green), and DAPI (blue) (left) and the percentage of co-expression in the NTS (right, n = 6 slices from 3 mice). B Representative images of co-expressed c-Fos neurons (red), GABA neurons (green), and DAPI (blue) in the NTS (left). The percentage of co-expression in the NTS (right, n = 6 slices from 3 mice). C Schematic of AAV-vglut2-GCaMP6s injection and optic fiber implantation in the NTS (left). Expression of GCaMP6s in the NTS (right). D Heatmap and average Ca2+ transients of the NTSGlu under GD stimulation. E Averaged peak ΔF/F of calcium activity of the NTSGlu under GD stimulation (n = 6 mice, P = 0.0248 in 40 mmHg, P = 0.0005 in 60 mmHg, P = 0.0001 in 80 mmHg). F Heatmap of the NTSGlu pre and post-SDx in GD stimulation, respectively (left). Average Ca2+ transients of the NTSGlu under GD stimulation at 60 mmHg for Pre and SDx, respectively (middle). Averaged peak ΔF/F of calcium activity of the NTSGlu pre and post-SDx in GD stimulation (right, n = 6 mice, P = 0.0002). G Heatmap, average Ca2+ transients, and averaged peak ΔF/F of calcium activity of the NTSGlu pre and post-T5x in GD stimulation (n = 6 mice). H Experimental procedure of optogenetic manipulation of NTSGlu. I Schematic of the EMG recording setup, including the implantation of two electrodes in the acromiotrapezius muscle, and the insertion of a balloon into the stomach. EMG recordings were conducted one week after recovery. J Expression of virus in the NTS. K Representative EMG traces and the AUC statistics under eNpHR-stimulation (n = 6 mice, P = 0.0004 in 40 mmHg, P = 0.0001 in 60 mmHg and 80 mmHg). L Representative EMG traces and SDx administration of the AUC statistics under ChR2-stimulation (n = 6 mice, P = 0.0237 in 40 mmHg vs light off, P = 0.0214 in 60 mmHg vs light off, P = 0.0001 in 80 mmHg vs light off). AM acromiotrapezius muscle. Scale bar = 100 μm in (AC, and J), scale bar = 20 μm in zoomed image in (A, B). Significance was assessed by two-way repeated-measure ANOVA in (E, K, and L), and two-sided Student’s t-test in (F, G). *P < 0.05, ***P < 0.001, n.s., not significant. All data are presented as mean values ± SEM. Similar results were obtained in six independent experiments and the data shown were from one representative experiment in (C, J).
Fig. 4
Fig. 4. The LPB and the PVT are crucial regions for synaptic transmission from the NTS to the PL.
A Schematic of AAV-vglut2-GCaMP6s injection and optic fiber implantation in the LPB (left). Expression of GCaMP6s in the LPB (right). B Heatmap and average Ca2+ transients of the LPBGlu under GD stimulation. C Averaged peak ΔF/F of calcium activity of the LPBGlu pre and post-GD stimulation (n = 6 mice, P = 0.0407 in 40 mmHg, P = 0.0001 in 60 mmHg and 80 mmHg). D Experimental procedure of optogenetic manipulation of LPBGlu (left). Schematics of the EMG recording setup (right). E Expression of virus in the LPB. F, G Representative EMG traces and the AUC statistics under ChR2-stimulation or eNpHR-stimulation (n = 6 mice; P = 0.0011 in 40 mmHg, P = 0.0001 in 60 mmHg and 80 mmHg under ChR2-stimulation; P = 0.0021 in 60 mmHg, P = 0.0003 in 80 mmHg under eNpHR-stimulation). H Schematic of AAV-vglut2-GCaMP6s injection and optic fiber implantation in the PVT (left). Expression of GCaMP6s in the PVT (right). I Heatmap and average Ca2+ transients of the PVTGlu under GD stimulation. J Averaged peak ΔF/F of calcium activity of the PVTGlu (n = 6 mice, P = 0.0001 in 40 mmHg, 60 mmHg, and 80 mmHg). K Experimental procedure of optogenetic manipulation of PVTGlu (left). Schematics of the EMG recording setup (right). L Expression of virus in the PVT. M, N Representative EMG traces and the AUC statistics under ChR2-stimulation or eNpHR-stimulation (n = 6 mice; P = 0.0105 in 40 mmHg, P = 0.0133 in 60 mmHg, P = 0.0003 in 80 mmHg under ChR2-stimulation; P = 0.0149 in 40 mmHg, P = 0.0001 in 60 mmHg and 80 mmHg under eNpHR-stimulation). AM acromiotrapezius muscle. Scale bar = 100 μm in (A, E, H, and L), scale bar = 20 μm in zoomed image in (A, L). Significance was assessed by two-way repeated-measure ANOVA in (C, F, G, J, M, and N). *P < 0.05, **P < 0.01, ***P < 0.001, n.s., not significant. All data are presented as mean values ± SEM. Similar results were obtained in six independent experiments and the data shown were from one representative experiment in (E, I).
Fig. 5
Fig. 5. The PLGlu perceives gastric pain signals.
A, B Representative images of co-expressed c-Fos (red), glutamatergic neurons or GABA neurons (green), and DAPI (blue) in the PL (left). The percentage of co-expression in the PL (right, n = 4 mice). C Schematic of AAV-vglut2-GCaMP6s injection and fiber implantation in the PL (left). Expression of GCaMP6s in the PL (right). D Heatmap and average Ca2+ transients of the PLGlu receiving GD stimulation. E Averaged peak ΔF/F of calcium activity of the PLGlu (right, n = 6 mice, P = 0.0001 in 40 mmHg, 60 mmHg, and 80 mmHg). F Experimental procedure of optogenetic manipulation of the PLGlu (left). Schematic of the EMG recording setup (right). G Representative images expression of virus in the PL. Similar results were obtained in six independent experiments and the data shown were from one representative experiment. H Representative EMG traces and statistical graph of EMG recordings AUC responses to GD under normal conditions or upon ChR2-stimulation (n = 6 mice, P = 0.0004 in 40 mmHg, P = 0.0001 in 60 mmHg and 80 mmHg). I Representative EMG traces and statistical graph of EMG recordings AUC responses to GD under normal conditions or upon eNpHR-stimulation (n = 6 mice, P = 0.0235 in 40 mmHg, P = 0.0001 in 60 mmHg and 80 mmHg). J Heatmap and average Ca2+ transients of the PLGlu in pre and post-receiving SDx in GD stimulation, respectively (left). Averaged peak ΔF/F of calcium activity of the PLGlu in pre and post-receiving SDx in GD stimulation (right, n = 6 mice, P = 0.0058). K Heatmap and average Ca2+ transients and averaged peak ΔF/F of calcium activity of the PLGlu in pre and post-receiving T5x in GD stimulation (n = 6 mice). L Schematic of AAV injection in the NTS (left). Decreased c-Fos expression in the PL after CNO injection compared with the saline group (middle). Statistical graph of c-Fos+ cells number (right, n = 3 mice, P = 0.0177). M Schematic of AAV injection in the NTS, AAV, and optic fiber implantation in the PL (left). Heatmap of the PLGlu in receiving saline or CNO in GD stimulation (middle) and averaged peak ΔF/F of calcium activity of the PLGlu (right, n = 6 mice, P = 0.0002). AM acromiotrapezius muscle. Scale bar = 100 μm in (AC, G, and L), scale bar = 20 μm in zoomed image in (A, B, and G). Significance was assessed by two-way repeated-measure ANOVA in (E, H, and I), and two-sided Student’s t-test in (JM). *P < 0.05, **P < 0.01, ***P < 0.001, n.s. not significant. All data are presented as mean values ± SEM.
Fig. 6
Fig. 6. The NTS-LPB, LPB-PVT, and PVT-PL pathways are crucial for the regulation of gastric pain.
A Experimental timeline of optogenetic manipulation of the NTS-LPB neural pathway. B Schematic showing injection of virus into the NTS and implantation of optical fiber into the LPB. And representative image showing the axonal terminals from NTSGlu in the LPB. C Representative EMG traces and statistical graph of AUC of EMG recordings under normal conditions or upon ChR2- stimulation (n = 6 mice, P = 0.0001 in 40 mmHg and 60 mmHg, P = 0.0185 in 80 mmHg). D Representative EMG traces and statistical graph of AUC of EMG recordings under normal conditions or upon eNpHR-stimulation (n = 5 mice, P = 0.0002 in 40 mmHg, P = 0.0001 in 60 mmHg and 80 mmHg). E Experimental timeline of optogenetic manipulation of the LPB-PVT neural pathway. F Schematic showing injection of virus into the LPB and implantation of optical fiber into the PVT. And representative image showing the axonal terminals from LPBGlu in the PVT. G, H Representative EMG traces and a statistical graph of the AUC of EMG recordings from mice under normal conditions, as well as during ChR2-stimulation and eNpHR-stimulation (n = 6 mice; P = 0.0001 in 40 mmHg, 60 mmHg and 80 mmHg under ChR2-stimulation; P = 0.0046 in 40 mmHg, P = 0.0001 in 60 mmHg and 80 mmHg under eNpHR-stimulation). I Experimental timeline of optogenetic manipulation of the PVT-PL neural pathway. J Schematic showing injection of virus into the PVT and implantation of optical fiber into the PL for optogenetic manipulations. And representative image showing the axonal terminals from PVTGlu in the PL. K, L Representative EMG traces and a statistical graph of the AUC of EMG recordings under normal conditions, as well as during ChR2-stimulation and eNpHR-stimulation (n = 6 mice; P = 0.0020 in 40 mmHg, P = 0.0002 in 60 mmHg, P = 0.0009 in 80 mmHg under ChR2-stimulation; P = 0.0002 in 40 mmHg, P = 0.0001 in 60 mmHg and 80 mmHg under eNpHR-stimulation). Scale bar = 100 μm in (B, F, and G). Significance was assessed by two-way repeated-measure ANOVA in (C, D, G, H, K, and L). *P < 0.05, **P < 0.01, ***P < 0.001, n.s. not significant. All data are presented as mean values ± SEM. Similar results were obtained in six independent experiments and the data shown were from one representative experiment in (B, F, and J).
Fig. 7
Fig. 7. The NTS-LPB-PVT and LPB-PVT-PL pathways are important for the regulation of gastric pain.
A Experimental timeline of chemogenetics manipulation of the NTS-LPB-PVT neural pathway. B Schematic showing virus injection into the NTS and the LPB, and implantation of cannula into the PVT. C The expression of hM4Di in the LPB and axonal terminals in the PVT. D Representative EMG traces and statistical graph of AUC of EMG recordings under saline or CNO stimulation (n = 6 mice, P = 0.0035 in 40 mmHg, P = 0.0001 in 60 mmHg and 80 mmHg). E Experimental timeline of chemogenetics manipulation of the LPB-PVT-PL neural pathway. F Schematic showing virus injection into the LPB and the PVT, and implantation of cannula into the PL. G The expression of hM4Di in the PVT and axonal terminals in the PL. H Representative EMG traces and statistical graph of AUC of EMG recordings under saline or CNO stimulation (n = 6 mice, P = 0.0004 in 40 mmHg, P = 0.0015 in 60 mmHg, P = 0.0064 in 80 mmHg). I Experimental timeline of chemogenetics manipulation of the LPB-PVT-PL neural pathway and fiber photometry recording glutamate release in the PL. J Schematic showing injection of scAAV2/1-Cre into the NTS, AAV2/R-vglut2-DIO-hM4Di into the PVT, implantation of the cannula into the LPB for chemogenetics manipulations. And injection of iGluSnFR into the PL, implantation of optical fiber into the PL. K Representative images of iGluSnFR expression in the PL and hM4Di expression in the LPB. L Heatmap and average glutamate release transients in saline and CNO group receiving GD stimulation in male mice. M Averaged peak ΔF/F of glutamate release in saline and CNO in male mice (n = 6 mice, P = 0.0001). N Heatmap and average glutamate release transients in saline and CNO group in female mice. O Averaged peak ΔF/F of glutamate release in saline and CNO in female mice (n = 5 mice, P = 0.0017). Scale bar = 100 μm in (C, G, and K). Significance was assessed by two-way repeated-measure ANOVA in (D, H), and two-sided Student’s t-test in (M, O), ***P < 0.001, n.s. not significant. All data are presented as mean values ± SEM. Similar results were obtained in six independent experiments and the data shown were from one representative experiment in (C, J, and K).
Fig. 8
Fig. 8. A working model showing the vagus nerve dominant ascending pathway for gastric pain processing.
GD induces an increased c-Fos expression in brain regions, including the NTS, LPB, PVT, and PL. The formed glutamatergic NTS–LPB–PVT–PL circuitry holds crucial significance in the transmission of gastric pain. Moreover, the transmission of noxious information from the stomach primarily travels through this pathway via the vagus nerve to convey signals to the cortical regions, resulting in an increase in EMG activity and pain perception. GD gastric distension, NG nodose ganglion, NTS the solitary nucleus, LPB lateral parabrachial nucleus, PVT paraventricular thalamic nucleus, PL prelimbic cortex, Glu glutamatergic neurons, EMG electromyographic.

References

    1. Enck, P. et al. Functional dyspepsia. Nat. Rev. Dis. Prim.3, 17081 (2017). - PubMed
    1. Grover, M., Farrugia, G. & Stanghellini, V. Gastroparesis: a turning point in understanding and treatment. Gut68, 2238–2250 (2019). - PMC - PubMed
    1. Wang, H. J. et al. Epigenetic upregulation of acid-sensing ion channel 1 contributes to gastric hypersensitivity in adult offspring rats with prenatal maternal stress. Pain161, 989–1004 (2020). - PubMed
    1. Stanghellini, V. et al. Gastroduodenal disorders. Gastroenterology150, 1380–1392 (2016). - PubMed
    1. Chang, L. et al. Gender, age, society, culture, and the patient’s perspective in the functional gastrointestinal disorders. Gastroenterology130, 1435–1446 (2006). - PubMed

Publication types

LinkOut - more resources