Observational Study
. 2024 Nov 13;15(1):9815.
doi: 10.1038/s41467-024-53360-9.

Cognitive reserve against Alzheimer's pathology is linked to brain activity during memory formation

Affiliations
Observational Study

Cognitive reserve against Alzheimer's pathology is linked to brain activity during memory formation

Niklas Vockert et al. Nat Commun. .

Abstract

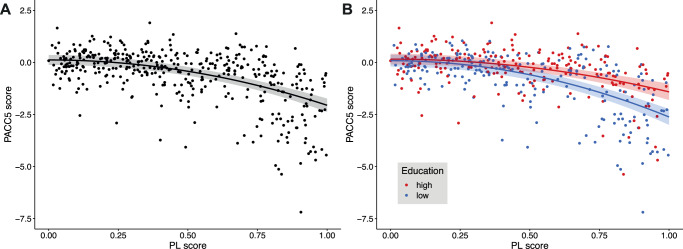
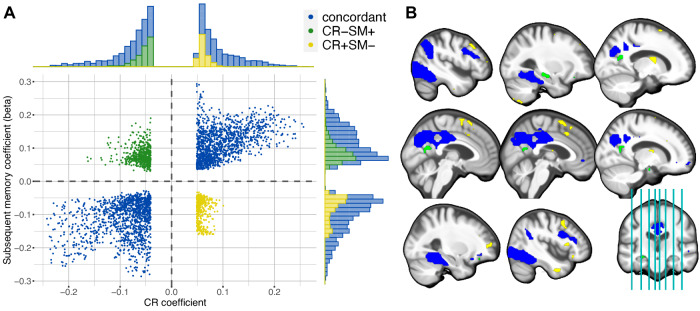
The cognitive reserve (CR) hypothesis posits that individuals can differ in how their brain function is disrupted by pathology associated with aging and neurodegeneration. Here, we test this hypothesis in the continuum from cognitively normal to at-risk stages for Alzheimer's Disease (AD) to AD dementia using longitudinal data from 490 participants of the DELCODE multicentric observational study. Brain function is measured using task fMRI of visual memory encoding. Using a multivariate moderation analysis, we identify a CR-related activity pattern underlying successful memory encoding that moderates the detrimental effect of AD pathological load on cognitive performance. CR is mainly represented by a more pronounced expression of the task-active network encompassing deactivation of the default mode network (DMN) and activation of inferior temporal regions including the fusiform gyrus. We devise personalized fMRI-based CR scores that moderate the impact of AD pathology on cognitive performance and are positively associated with years of education. Furthermore, higher CR scores attenuate the effect of AD pathology on cognitive decline over time. Our findings primarily provide evidence for the maintenance of core cognitive circuits including the DMN as the neural basis of CR. Individual brain activity levels of these areas during memory encoding have prognostic value for future cognitive decline.


Conflict of interest statement

Competing interests The authors declare the following competing interests: Y.S. consults for Eisai, Lilly, and Arcadia. Columbia University licenses the Dependence Scale, and in accordance with university policy, Y.S. is entitled to royalties through this license. B.H.S. is involved in clinical studies by Roche, Biogen, and Hummingbird Diagnostics, but does not receive personal funds from any of them. S.T. is member of the DSMB of the study ENVISION (Biogen). J.W. acted as a consultant for Immungenetics, Noselab, and Roboscreen. J.W. further served on a scientific advisory board for Abbott, Biogen, Boehringer Ingelheim, Lilly, Immungenetics, MSD Sharp-Dohme, Noselab, Roboscreen, and Roche. J.W. received honoraria for presentations from Beijing Yibai Science and Technology Ltd, Eisai, Gloryren, Janssen, Pfizer, Med Update GmbH, Roche, and Lilly. The remaining authors declare no competing interests.

Figures

Fig. 1
Fig. 1. Cognitive performance declines with higher AD pathological load.
Cognitive performance is represented by the baseline PACC5 score, which was normalized to the unimpaired sample (cognitively normal individuals, subjective cognitive decliners, first-degree relatives of Alzheimer’s disease patients). A Quadratic model: PACC5 = b0 + b1 ⋅ PL2 + c ⋅ COV. The black line depicts the predictions of a regression model (with 95% confidence intervals) with a quadratic effect of PL. B Same model as in panel (A), but with additional terms for years of education and its interaction with the quadratic PL score. Red and blue dots refer to individuals with high and low education, respectively, as obtained by a median split. Red and blue lines are the predictions of regression models for an individual with average covariate values and 17 (median of the high education group) or 12 years of education (median of the low education group), respectively. Shaded areas refer to the respective 95% confidence intervals. Source data are provided as a Source Data file. COV covariates (see “Methods”), PACC5 Preclinical Alzheimer’s Cognitive Composite 5, PL pathological load.
Fig. 2
Fig. 2. CR-related activity pattern that moderates effects of pathology.
A Activation (hot colors) and deactivation (cool colors) during encoding of subsequently remembered compared to subsequently forgotten stimuli as identified by t-contrasts of the subsequent memory regressor in the whole fMRI sample. T values of voxels with pFWE < 0.05 are shown. B Group-level CR-related activity pattern that when expressed minimizes effects of AD pathology on cognitive performance as identified via a multivariate approach. The net contribution (moderation coefficient; positive/hot and negative/cool colors) of every voxel to the CR pattern is displayed (unthresholded). C Atrophy pattern in the whole baseline DELCODE sample as obtained by a VBM GM analysis of CN participants vs ADD patients. T values of voxels with pFWE < 0.05 are shown. Source data are provided as a Source Data file. ADD Alzheimer’s disease dementia, CN cognitively normal, CR cognitive reserve, GM gray matter, VBM voxel-based morphometry.
Fig. 3
Fig. 3. Significant regions in the CR-related activity pattern.
Several clusters of voxels were determined via bootstrapping whose contribution to the CR pattern (wi) was found to be significant (p  < 0.05, see “Methods”), displayed as A mosaic (multislice) view, B 3D view and C surface view. Displayed numbers refer to the clusters described in Table 2 with peaks in the following brain structures. 1: right inferior temporal cortex, 5: left precuneus. In panel (B), small clusters have been removed for illustrative purposes. It is important to note that the CR pattern is multivariate in nature, interpretable as a whole and cluster descriptives are reported for transparency of obtained non-negligible coefficients contributing to the pattern. Source data are provided as a Source Data file. CR cognitive reserve.
Fig. 4
Fig. 4. CR pattern and the subsequent memory contrast predominantly align.
A The scatter plot displays the CR coefficients wi and subsequent memory contrast coefficients (beta) for every voxel with significant contribution to CR. They form three groups: 1. A concordant where both coefficients have the same sign (blue); 2. positive CR coefficient, but negative subsequent memory beta (CR+SM-; yellow); 3. negative CR coefficient, but positive subsequent memory beta (CR-SM+; green). The histograms display the frequency of the voxels in the corresponding groups. The gray dashed lines separate the four quadrants. B The CR-related activation pattern is shown color-coded corresponding to the colors in panel (A). It is important to note that the CR pattern is multivariate in nature, interpretable as a whole and cluster descriptives are reported for transparency of obtained non-negligible coefficients contributing to the pattern. Source data are provided as a Source Data file. CR cognitive reserve, SM subsequent memory.
Fig. 5
Fig. 5. Subsequent memory-related activity moderates the relationship between PL and PACC5.
The relationship between the PL score and the PACC5 score (Box-Cox transformed and residualized for covariates) is moderated depending on the subsequent memory-related activity in two previously identified clusters (see Table 2 or Fig. 3). A Moderation effect of activation in cluster 1 located around the inferior temporal cortex including fusiform gyrus (positive moderation coefficients). B Moderation effect of deactivation in cluster 5 including bilateral cuneus and precuneus as well as posterior cingulate (negative moderation coefficients). The red lines in both panels depict the predicted PACC5 score for a hypothetical individual with an activation 1 SD above the mean, the blue lines for an activation 1 SD below the mean in the respective cluster. The shaded areas represent the 95% confidence intervals. Black dots represent the individual subjects' values for PL and (transformed + residualized) PACC5. Source data are provided as a Source Data file. PACC5 Preclinical Alzheimer’s Cognitive Composite 5, PL pathological load.
Fig. 6
Fig. 6. CR score is linked to cognitive performance cross-sectionally and longitudinally.
A The relationship between the PL score and cognitive performance at baseline is moderated by the CR score. Cognitive performance is represented by three different scores: a global cognitive factor score, a memory factor score and the PACC5 score (previously used for identification of the CR-related activity pattern). Cognitive performance was predicted using the respective regression model for an average individual with high (above median; red curve) or low (below median; blue curve) CR score. B In the sample without PL score, the CR score moderates the relationship between hippocampal atrophy and cognitive performance. Prediction procedure equivalent to the one in panel (A), but based on a model that was fit in the sample without PL scores and thus contains hippocampal atrophy instead of the PL score as an independent variable. C The pathology-dependent differences in longitudinal trajectories of cognitive performance are ameliorated by the baseline CR score. The PACC5 scores at a 5-year follow-up were predicted using the previously described LME (see “Methods” section) fitted on the original longitudinal data for an average individual with high (above median; red line) or low (below median; blue line) CR score and high or low pathology (here represented by high and low hippocampal atrophy corresponding to the 25th and 75th percentile). D Predictions of all individual cognitive trajectories. Individuals were categorized as high/low CR based on their above/below average CR scores and as low/high pathology based on their below/above average hippocampal atrophy. Shaded areas in panels (AC) denote 95% confidence intervals. Source data are provided as a Source Data file. CR cognitive reserve, LME linear mixed-effects model, PACC5 Preclinical Alzheimer’s Cognitive Composite 5, PL pathological load.

References

    1. Jack, C. R. et al. NIA-AA research framework: toward a biological definition of Alzheimer’s disease. Alzheimers Dement.14, 535–562 (2018). - PMC - PubMed
    1. Katzman, R. et al. Clinical, pathological, and neurochemical changes in dementia: a subgroup with preserved mental status and numerous neocortical plaques. Ann. Neurol.23, 138–144 (1988). - PubMed
    1. Stern, Y. et al. Whitepaper: defining and investigating cognitive reserve, brain reserve, and brain maintenance. Alzheimers Dement.16, 1305–1311 (2020). - PMC - PubMed
    1. Stern, Y. et al. A framework for concepts of reserve and resilience in aging. Neurobiol. Aging124, 100–103 (2023). - PMC - PubMed
    1. Arenaza-Urquijo, E. M. et al. Relationships between years of education and gray matter volume, metabolism and functional connectivity in healthy elders. Neuroimage83, 450–457 (2013). - PubMed

Publication types

MeSH terms

LinkOut - more resources