. 2024 Nov 13;15(1):9847.
doi: 10.1038/s41467-024-54220-2.

Uncontrolled Illegal Mining and Garimpo in the Brazilian Amazon

Affiliations

Uncontrolled Illegal Mining and Garimpo in the Brazilian Amazon

Luiz Cortinhas Ferreira Neto et al. Nat Commun. .

Abstract

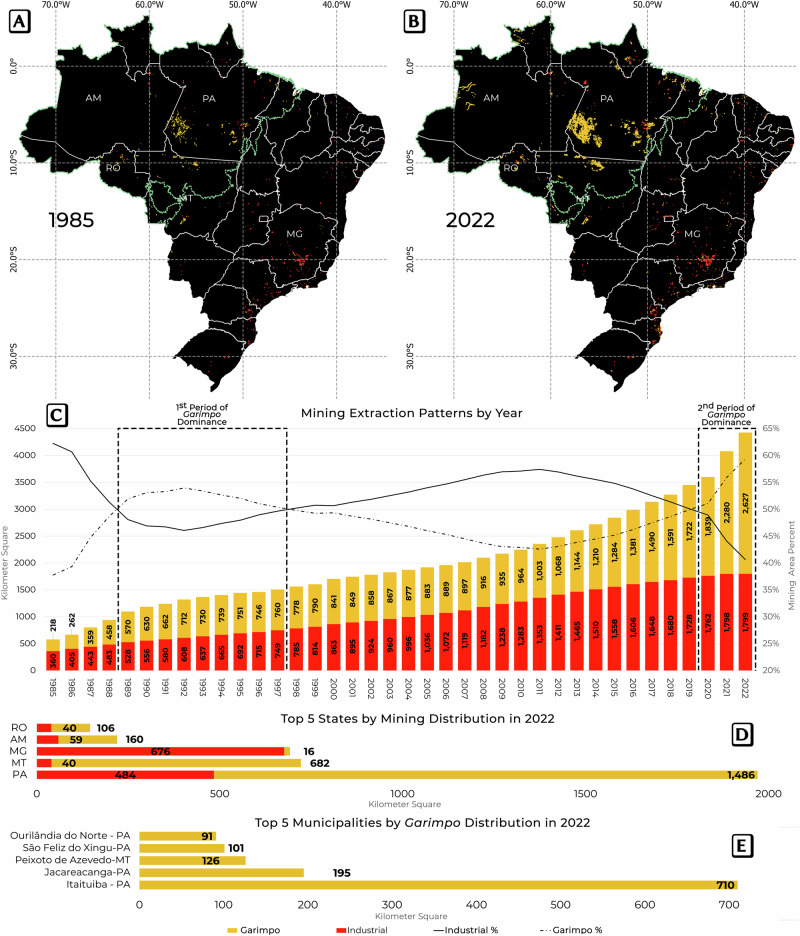
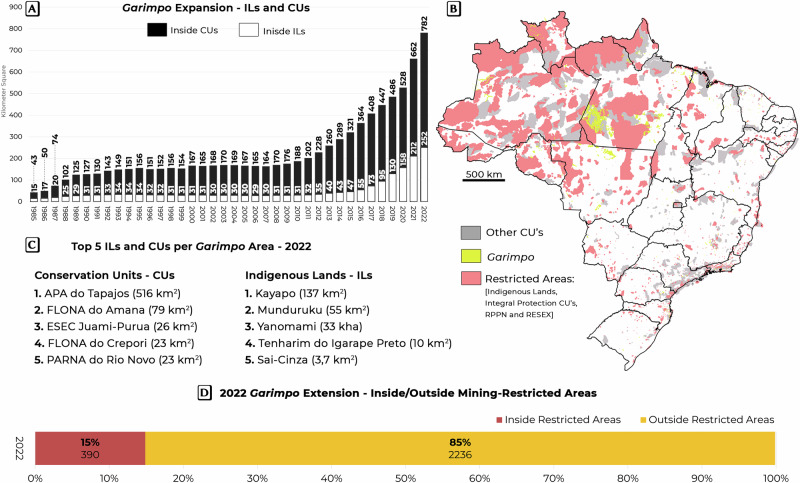
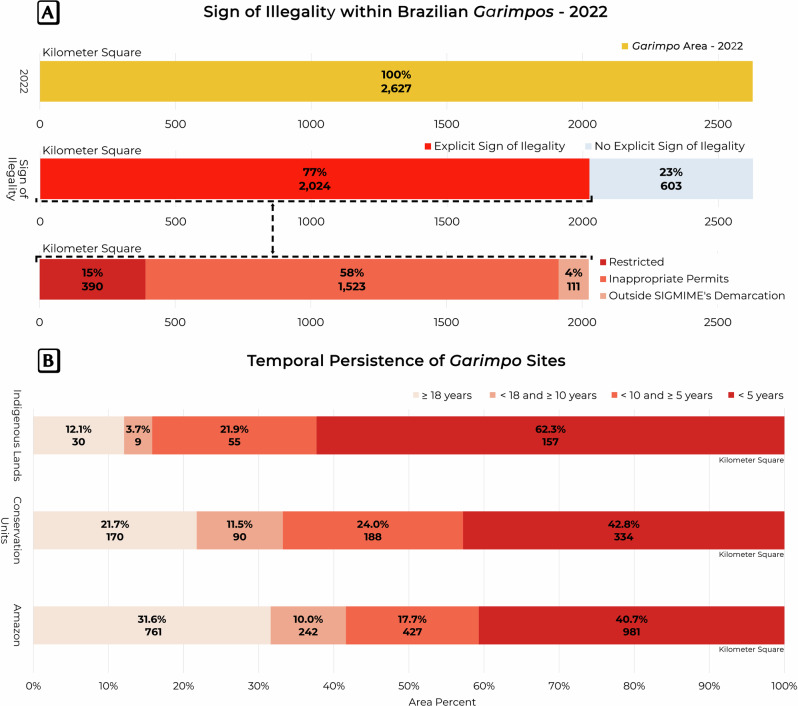
Mining has played an important role in the economies of South American countries. Although industrial mining prevails in most countries, the expansion of garimpo activity has increased substantially. Recently, Brazil exhibited two moments of garimpo dominance over industrial mining: 1989-1997 and 2019-2022. While industrial mining sites occupied ~ 360 km2 in 1985 but increased to 1800 km2 in 2022, a 5-fold increase, garimpo mining area increased by ~ 1200%, from ~ 218 km2 in 1985 to ~ 2627 km2 in 2022. More than 91% of this activity is concentrated in the Amazon. Where almost 40% of the sites are five years old or younger, this proportion increases to 62% within Indigenous lands (ILs). Regarding the legal aspect, at least 77% of the 2022 extraction sites showed explicit signs of illegality. Particular attention must be given to the Kayapo, Munduruku, and Yanomami ILs. Together, they concentrate over 90% of the garimpo across ILs.


Conflict of interest statement

Competing interests The authors declare no competing interests.

Figures

Fig. 1
Fig. 1. Spatial-temporal distribution of mining extraction patterns in Brazil.
A Spatial distribution in 1985. B Spatial distribution in 2022. C The total area of mining extraction patterns per type per year. D Top 5 states by mining distribution in 2022. E Top 5 municipalities by garimpo distribution in 2022. In every section, yellow denotes garimpo, while red denotes industrial mining. The abbreviations RO, AM, MG, MT, and PA denote the states of Rondônia, Amazonas, Minas Gerais, Mato Grosso, and Pará, respectively. The Amazon biome delimitation is represented by a light green boundary in maps A and B. The states and Amazonian delineations were downloaded from the IBGE.
Fig. 2
Fig. 2. Garimpo sites in restricted areas.
A Garimpo area in indigenous lands and conservation units per year. B Spatial distribution of the garimpo area in 2022. On the map, gray denotes the location of the conservation units. Red denotes the location of indigenous lands. Yellow denotes the garimpo sites. C The top 5 ILs and CUs per garimpo area in 2022. D The bar graph shows the absolute and percent values inside and outside mining-restricted areas. In the graph, yellow denotes garimpo extension outside restricted areas, while dark red denotes mining sites within restricted areas (indigenous lands, fully protected CUs, RPPNs, and RESEXs).
Fig. 3
Fig. 3. Illegality and timing of garimpo activities.
A Signs of illegality and nature of garimpo in 2022. At the top, the yellow bar denotes the total area in 2022. In the middle, the area is visualized according to signs of illegality and is classified as showing explicit signs of illegality or no explicit sign of illegality. At the bottom, the nature of illegality is provided, as are three distinct signs of illegality: occurring inside restricted areas, exhibiting inappropriate permits, and occurring outside the SIGMINE demarcation. B Temporal persistence of garimpo sites. The bar graphs show the proportion of the detected garimpo area as a function of its age [time]. The ages of the extraction sites within indigenous lands, conservation units, and the Brazilian Amazon are shown from top to bottom. The tonal variations (red) indicate age ≥ 18 years, < 18 and ≥ 10 years, < 10 and ≥ 5 years, or < 5 years. The redder the tone is, the younger the mining area.
Fig. 4
Fig. 4. Error matrix and locally distributed accuracy metrics for 2022.
The accuracy assessment approach was weighted by the area of each category/class according to the 250 × 250 km grid (62,500 km2). A total of 182 grids were regularly distributed throughout Brazil. The metrics for 2022 revealed an OA value of 99% (A), a CA(Mi) value of 91% (B), and a PA(Mi) value of 91% (C). Error matrix and associated metrics (D).
Fig. 5
Fig. 5. Garimpo legislation and expansion inside indigenous lands.
In the upper right corner, a Landsat 8 annual mosaic from 2022 is shown. In the top left, a Kayapo garimpo conglomerate, highlighted in red, extends for more than 20 km. At the bottom, the yellow bars show the evolution of Amazonian extraction within indigenous lands from 1985–2022, expressed in km2. The red line denotes the annual volatility of international gold prices, expressed in USD per troy ounce (World Gold Council). Each black line denotes the year a specific law, resolution, or bill was ratified, directly impacting the recent garimpo spread in the Brazilian Amazon. The annual composites are derived from the Landsat 8, Collection 2, Tier 1, TOA dataset, which is courtesy of the U.S. Geological Survey.
Fig. 6
Fig. 6. Activation grids and processing flowchart.
In the map, 535 search grids were activated according to the existence of a mining reference sample. In yellow, the squares function as U-Net search grids. The mining site references are marked in red. The white lines denote the official boundaries of Brazilian states. The right side shows the mining detection Earth Engine–TensorFlow pipeline. The pipeline is structured in 5 steps. First, the GEE generates cloud-free composites and creates the initial training dataset. Second, mosaics and training data are downloaded and stored locally. Third, patchwise training and classification are initiated. Fourth, the classified product is spatiotemporally filtered. The filtered product is visually and statistically inspected. Multiple iterations are executed until a satisfactory spatial and temporal quality is achieved. Fifth, the accuracy assessment is performed.
Fig. 7
Fig. 7. Flowchart demonstrating the data sources, analytical phases, and criteria for categorizing an ore extraction site as showing explicit signs of illegality or no explicit sign of illegality.
Among all possible operational licenses or licensing phases within the ANM’s SIGMINE platform, PLGs and CLs are considered garimpo-appropriated permits. In contrast, any other license type or phase is regarded as inappropriate.

References

    1. Cypher, J. M. South America’s commodities boom: developmental opportunity or path dependent reversion? Can. J. Dev. Stud. / Rev. canadienne d. ’études du d. éveloppement30, 635–662 (2010).
    1. Paiva, P. H. de A. & Bacha, C. J. C. The gross domestic product (GDP) shares of the agriculture sector and the hydrocarbon and mining sector in the countries of South America between 1960 and 2014. CEPAL Review (2019).
    1. Machado, I. F. & de M. Figueirôa, S. F. 500 years of mining in Brazil: a brief review. Resour. Policy27, 9–24 (2001).
    1. Bruno, D. E. et al. Artisanal and small-scale gold mining, meandering tropical rivers, and geological heritage: evidence from Brazil and Indonesia. Sci. Total Environ.715, 136907 (2020). - PubMed
    1. Fritz, M., McQuilken, J., Collins, N. & Weldegiorgis, F. Global Trends in Artisanal and Small-Scale Mining (ASM): A Review of Key Numbers and Issues. (International Institute for Sustainable Development Winnipeg, MB, Canada, 2018).

LinkOut - more resources