. 2024 Nov 13;15(1):9835.
doi: 10.1038/s41467-024-53979-8.

Post-translational toxin modification by lactate controls Staphylococcus aureus virulence

Affiliations

Post-translational toxin modification by lactate controls Staphylococcus aureus virulence

Yanan Wang et al. Nat Commun. .

Abstract

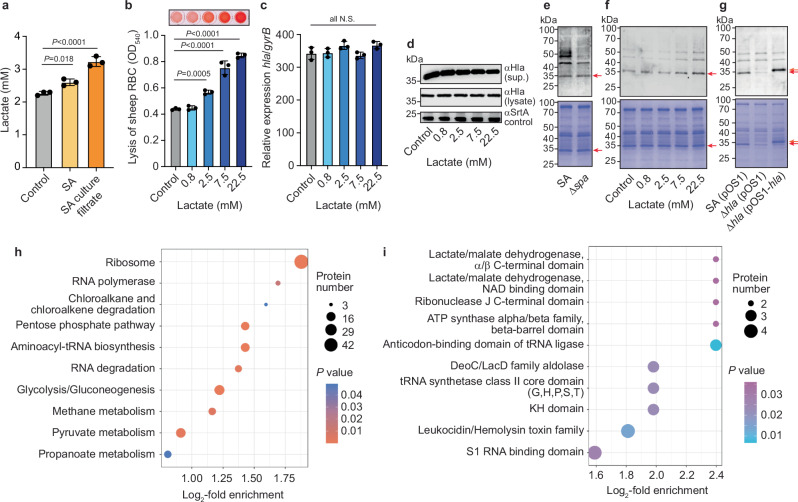
Diverse post-translational modifications have been shown to play important roles in regulating protein function in eukaryotes. By contrast, the roles of post-translational modifications in bacteria are not so well understood, particularly as they relate to pathogenesis. Here, we demonstrate post-translational protein modification by covalent addition of lactate to lysine residues (lactylation) in the human pathogen Staphylococcus aureus. Lactylation is dependent on lactate concentration and specifically affects alpha-toxin, in which a single lactylated lysine is required for full activity and virulence in infection models. Given that lactate levels typically increase during infection, our results suggest that the pathogen can use protein lactylation as a mechanism to increase toxin-mediated virulence during infection.


Conflict of interest statement

Competing interests The authors declare no competing interests.

Figures

Fig. 1
Fig. 1. Protein lactylation occurs in S. aureus and particularly affects alpha-toxin.
a Lactate levels released by A549 cells after incubation with live S. aureus (SA, MOI = 5:1) or S. aureus stationary-phase culture filtrate (1:50 dilution) for 5 h (n = 3/group). b Hemolysis exerted by S. aureus culture filtrates containing different concentrations of sodium lactate. Culture filtrates (1:50 dilution) were incubated with RBCs (5% v/v in PBS) for 30 min at room temperature. n = 3/group. c Transcript levels of hla under the same conditions. n = 3/group. d Alpha-toxin protein levels in culture filtrate and cell lysate under the same conditions as determined by immunoblotting with αHla antibodies. Antibodies to sortase A were used to measure sortase protein levels as control. e Lactylation of secreted proteins in culture filtrates of S. aureus and S. aureus Δspa determined by Pan-αKla antibody. See Supplementary Fig. 1f for data with the cellular fraction. f Lactylation of S. aureus Δspa secreted proteins under the same conditions with addition of different levels of sodium lactate to cultures. See Supplementary Fig. 1g for data with the cellular fraction. g Lactylation in alpha-toxin-deleted (Δhla) and hla-complemented S. aureus Δspa strains under the same conditions. Lactylated cytoplasmic proteins according to LC-MS/MS analysis: Kyoto Encyclopedia of Genes and genomes (KEGG) pathway analysis (h) and protein domain analysis according to InterPro (i). All detected lactylation positions of virulence factors are shown in Supplementary Table 3. eg Coomassie total proteins stains are shown at the bottom as loading controls. Red arrows denote alpha-toxin; orange arrows the slightly larger His-tagged alpha-toxin. Statistical analysis in (ac) is by one-way ANOVAs with Dunnett’s post-tests versus values in controls, in (h, i) by two-sided Fisher’s exact test versus all identified proteins or groups. n represents the number of biological replicates for all experiments. Error bars show the mean ± SD. N.S., not significant (P ≥ 0.05).
Fig. 2
Fig. 2. One specific lactylated lysine is responsible for lactylation-dependent cytolysis in alpha-toxin.
a Cytolytic activity (as determined by lysis of RBCs) of culture filtrates (1:50 dilution) from S. aureus strains expressing wild-type (hla) or different single-site amino acid substitutions of alpha-toxin and control strains. Immunoblot controls of expression levels are shown at the bottom. b Cytolytic activity toward RBCs of culture filtrates (1:50 dilution) from S. aureus wild-type and an isogenic hla K84R genomic single-site substitution strain (SA-K84R), and wild-type hla-complemented strain. a, b Representative images are shown at the top. c Cytolytic activity toward RBCs of purified wild-type and single-site amino acid substitutions of alpha-toxin. Lactate-dependent cytolysis of RBCs (d) or A549 cells (e) by purified wild-type Hla or Hla K84R. bd Reactions with antibodies specific for alpha-toxin (αHla) or K84-lactylated alpha-toxin (αHlaK84la), and antibodies reacting with all lysine-lactylated proteins (Pan-αKla) are shown below graphs. ae n = 3/group (biological replicates). Statistical analysis is by one-way ANOVAs with Tukey’s post-tests. Error bars show the mean ± SD.
Fig. 3
Fig. 3. Two lactylases are critical for alpha-toxin lactylation-mediated cytolysis.
Lactylation of proteins in cell lysates (a) or culture filtrates (b) of S. aureus Δspa strains over-expressing specific potential lactylases (n = 3 independent experiments). Gene names are according to a genome-sequenced ST398 strain (“0543” for SAPIG0543, etc.). The alpha-toxin band is marked by a red arrow. Blue arrows show examples of differentially expressed proteins. Coomassie whole-protein stains are shown at the bottom as controls. c In vitro lactylase activity assay. Purified recombinant (His-tagged) lactylases were incubated with a peptide representing the region surrounding position 84 of Hla. Analysis was by immune dot blot using antibodies developed to react only with K84-lactylated Hla (αHlaK84la, developed against the lactylated form of this peptide and affinity-purified) or control antibodies developed against the corresponding unmodified peptide, reacting with both modified and unmodified Hla (αHla*), and antibodies reacting with all lysine-lactylated proteins (Pan-αKla). See Supplementary Fig. 3 for analysis of antibody specificity. The K84-lactylated peptide was used a positive control. Cytolytic activity toward RBCs (d) or A549 cells (e) of culture filtrates of the lactylase expression strains. fi Data obtained using lactylase single or multiple deletion strains. Cytolytic activity of culture filtrates toward RBCs (f) and A549 cells (g). h, i Cytolytic activity data obtained with the double Δ1173 + 2573 mutant without or with addition of sodium lactate. j, k Cytolytic activities obtained by genetic complementation of the Δ1173 + 2573 mutant by single expression of lactylase enzymes. (l), In-vitro enzyme/substrate conversion assay using purified 1173 and 2573 lactylases and the peptide shown in (c). Detailed source data for this assay are available in Supplementary Data 1. dl n = 3/group except (g), n = 4/group. n represents the number of biological replicates for all experiments. Reactions with αHla, αHlaK84la, and Pan-αKla antibodies are shown at the bottom of graphs. Statistical analysis is by 1-way ANOVA and Tukey’s or Dunnett’s post-tests via controls, as appropriate. In (j, k) only the values obtained among plasmid or non-plasmid-containing groups were compared. Error bars show the mean ± SD.
Fig. 4
Fig. 4. Lactylation affects receptor-independent alpha-toxin membrane association.
a Model of the alpha-toxin pore according to the structure reported by Song et al., rendered using Lasergene 17 Protean 3D. The position of K84 is highlighted using space fill presentation of the lysine side chain within one monomer shown in red. Note we counted amino acids from the start of the Hla precursor peptide (not the mature toxin) in this study. b Model of alpha-toxin (Hla) lactylation and steps leading to pore formation: (1) Attachment of Hla monomer to membrane involving ADAM-10 receptor, (2) oligomerization on the membrane, which includes structural changes leading to SDS stability, (3) pore formation involving considerable structural changes including stem formation and anchoring to caveolin-1. c Binding ability of alpha-toxin to ADAM−10 and caveolin-1 (n = 3 independent experiments). Purified His-tagged wild-type or K84R alpha-toxin were incubated with A549 cell lysate for the indicated times. The binding proteins were collected via His-tag pull-down and detected by immunoblot. “Input”: A549 cell lysate only; “Mock”: A549 cell lysate incubated with equal amount of PBS for 24 h.
Fig. 5
Fig. 5. Lactylation affects S. aureus infection.
a Abscess model. Mice received 2.5 × 107 CFU in 100 μl PBS of the indicated strains or PBS alone by intradermal infection and abscess size was measured 24 h thereafter. n = 6/group. bk Lung infection model. Mice received 2 × 109 CFU (lethal dose, (b) or 2 × 108 CFU (non-lethal dose, (ck) in 40 μl PBS of the indicated strains or PBS alone by intranasal instillation. b Survival curve. n = 8/group. In a different group of mice receiving the non-lethal dose, the bacterial load (c) was determined after euthanasia at 48 h (n = 8/group), and the BALF was examined (n = 5/group) for the presence of lymphocytes (CD45+ cells, d)) and neutrophils (e) using the gating strategy shown in Supplementary Fig. 5. f Representative contour plots of CD11b staining showing abundance of myeloid cells, most of which are neutrophils (Ly6G+) and macrophages (F4/80+) in the BALF of mice infected with wild-type S. aureus (SA) or Δ1173 + 2573 bacteria. In the top panel, the count of CD11b positive cells, and in the bottom panel, the proportion of neutrophils (N) and macrophages (M) is shown. See gating strategy in Supplementary Fig. 5. gi Cytokine concentrations in the BALF (n = 5/group). j, k Lung tissue was examined by histology (H&E staining, anti-Ly6G immunohistochemistry to detect leukocytes), n = 6/group. Black arrows depict leukocyte infiltration, green arrows alveolar atelectasis, and blue arrows perivascular edema. n represents the number of biological replicates for all experiments. Statistical analysis is by Mantel-Cox log-rank test for the survival curve and elsewhere by one-way ANOVAs with Tukey’s post-tests. Error bars show the mean ± SD.
Fig. 6
Fig. 6. Lactylation of alpha-toxin dominates in vivo pathogenesis effects of protein lactylation in S. aureus.
ae Mouse models using SA-K84R strain. a Abscess model. Mice received 2.5 × 107 CFU in 100 μl PBS of the indicated strains or PBS alone by intradermal infection and abscess size was measured 24 h thereafter. n = 6/group. be Lung infection model. Mice received 2 × 109 CFU (lethal dose, (b)) or 2 × 108 CFU (non-lethal dose, (ce)) in 40 μl PBS of the indicated strains or PBS alone by intranasal instillation. b Survival curve. n = 8/group. In a different group of mice receiving the non-lethal dose, the bacterial load (c) was determined after euthanasia at 48 h (n = 8/group). Lung tissue was examined by histology (d) using H&E staining and anti-Ly6G immunohistochemistry to detect leukocytes (e), n = 6/group. fp Mouse models using the Δhla background. f Abscess model. Mice received 1 × 108 CFU in 100 μl PBS of the indicated strains or PBS alone by intradermal infection and abscess size was measured 24 h thereafter. n = 6/group. gp Lung infection model. Mice received 8 × 109 CFU (lethal dose, (g)) or 8 × 108 CFU (non-lethal dose, (hp)) in 40 μl PBS of the indicated strains or PBS alone by intranasal instillation. g Survival curve. n = 8/group. In a different group of mice receiving the non-lethal dose, the bacterial load (h) was determined (n = 8/group) after euthanasia at 48 h and the BALF was examined (n = 5/group) for the presence of lymphocytes (CD45+ cells, (i)), neutrophils (j, k), and cytokines (ln). k Representative contour plots of CD11b staining showing abundance of myeloid cells, most of which are neutrophils (Ly6G+) and macrophages (F4/80+) in the BALF of mice infected with Δhla or Δhla + 1173 + 2573 bacteria. In the top panel, the count of CD11b positive cells, and in the bottom panel, the proportion of neutrophils (N) and macrophages (M) is shown. See gating strategy in Supplementary Fig. 5. o, p Lung tissue was examined by histology (H&E staining, anti-Ly6G immunohistochemistry to detect leukocytes), n = 6/group. d, o Black arrows depict leukocyte infiltration, green arrows alveolar atelectasis, and blue arrows perivascular edema. n represents the number of biological replicates for all experiments. Statistical analysis is by Mantel-Cox log-rank test for the survival curves and elsewhere by one-way ANOVAs with Tukey’s post-tests. Error bars show the mean ± SD.

References

    1. Collaborators, G. B. D. A. R. Global mortality associated with 33 bacterial pathogens in 2019: a systematic analysis for the Global Burden of Disease Study 2019. Lancet400, 2221–2248 10.1016/S0140-6736(22)02185-7 (2022). - PMC - PubMed
    1. Cheung, G. Y. C., Bae, J. S. & Otto, M. Pathogenicity and virulence of Staphylococcus aureus. Virulence12, 547–569 (2021). - PMC - PubMed
    1. Otto, M. Staphylococcus aureus toxins. Curr. Opin. Microbiol17, 32–37 (2014). - PMC - PubMed
    1. Berube, B. J. & Bubeck Wardenburg, J. Staphylococcus aureus alpha-toxin: nearly a century of intrigue. Toxins5, 1140–1166 (2013). - PMC - PubMed
    1. Dickey, S. W., Cheung, G. Y. C. & Otto, M. Different drugs for bad bugs: antivirulence strategies in the age of antibiotic resistance. Nat. Rev. Drug Discov.16, 457–471 (2017). - PMC - PubMed

Publication types

LinkOut - more resources