. 2024 Nov 13;15(1):9826.
doi: 10.1038/s41467-024-54183-4.

The mitochondrial mRNA-stabilizing protein SLIRP regulates skeletal muscle mitochondrial structure and respiration by exercise-recoverable mechanisms

Affiliations

The mitochondrial mRNA-stabilizing protein SLIRP regulates skeletal muscle mitochondrial structure and respiration by exercise-recoverable mechanisms

Tang Cam Phung Pham et al. Nat Commun. .

Abstract

Decline in mitochondrial function is linked to decreased muscle mass and strength in conditions like sarcopenia and type 2 diabetes. Despite therapeutic opportunities, there is limited and equivocal data regarding molecular cues controlling muscle mitochondrial plasticity. Here we uncovered that the mitochondrial mRNA-stabilizing protein SLIRP, in complex with LRPPRC, is a PGC-1α target that regulates mitochondrial structure, respiration, and mtDNA-encoded-mRNA pools in skeletal muscle. Exercise training effectively counteracts mitochondrial defects caused by genetically-induced LRPPRC/SLIRP loss, despite sustained low mtDNA-encoded-mRNA pools, by increasing mitoribosome translation capacity and mitochondrial quality control. In humans, exercise training robustly increases muscle SLIRP and LRPPRC protein across exercise modalities and sexes, yet less prominently in individuals with type 2 diabetes. SLIRP muscle loss reduces Drosophila lifespan. Our data points to a mechanism of post-transcriptional mitochondrial regulation in muscle via mitochondrial mRNA stabilization, offering insights into how exercise enhances mitoribosome capacity and mitochondrial quality control to alleviate defects.


Conflict of interest statement

Competing interests Since the study concluded, Solvejg Hansen, Jens Frey Halling and Anders Krogh Lemminger have become employees and shareholders of Novo Nordisk A/S, Denmark. The remaining authors declare no competing interests.

Figures

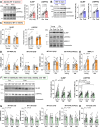
Fig. 1
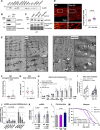
Fig. 1. Slirp knockout caused mild defects in mitochondrial structure and respiratory capacity, and reduced lifespan.
A SLIRP protein content across different wild-type tissues (n = 3–4, female C57BL/6 J). B SLIRP and LRPPRC protein content in tibialis anterior muscle of Slirp knockout (KO) and littermate wildtype (WT) mice; WT, n = 26; Slirp KO = 35. C SLIRP and LRPPRC protein content in tibialis anterior muscle of WT mice injected with recombinant adeno‐associated virus serotype 6 encoding SLIRP (rAAV6:SLIRP) or rAAV6:eGFP in the contralateral leg as control (n = 6). D Confocal microscopy of mitochondrial network structure in flexor digitorum brevis muscle fibers of Slirp KO and WT mice (n = 4, 7–10 fibers per mouse). Corresponding fragmentation index are presented as super plots; small symbols, each fiber; large symbols, mean of fibers per mouse and color- and symbol-coded for each sex ( male, ◇ female). E TEM images of Slirp KO and WT gastrocnemius muscle (n = 4; 7–9 fibers per sample). F, G Quantification of percentage of damaged intramyofibrillar (IMF) mitochondria within total mitochondria and relative volume of mitochondria. Small symbols, damaged or total mitochondria per fiber; large identical symbols, average of fibers per biological replicate (female Slirp KO and WT gastrocnemius muscle, n = 4/group). H Mitochondrial respiration in of Slirp KO and WT gastrocnemius muscle (male/female: WT, n = 4/4; Slirp KO, n = 5/5); (blue) male, ◇ (red) female. I Fatty acid oxidation in isolated Slirp KO and WT soleus muscle at rest and in response to contraction (male/female: WT, n = 3/4; Slirp KO, n = 4/8); (blue) male, ◇ (red) female. J RT-qPCR analysis of mitochondrial transcript levels and corresponding immunoblots in gastrocnemius of male Slirp KO and WT mice (mRNA: WT, n = 6; Slirp KO, n = 6; protein: WT, n = 6; Slirp KO, n = 7). K qPCR analysis of mtDNA levels in male Slirp KO and WT mice (WT, n = 6; Slirp KO, n = 7). L, M Climbing assay and life span of control, SLIRP1 and SLIRP2 knockdown flies (n = 3–9, 10 flies per sample for climbing assay; n = 10, 10 flies per vial for lifespan assay). Data are shown as mean ± SEM, including individual values, where applicable. Geno, main effect of genotype; substrate, main effect of substrate addition; Substrate X Geno, interaction between genotype and substrate; Contraction, main effect of contraction. *p < 0.05, **p < 0.01, ***p < 0.001, as per Two-tailed Mann Whitney test (D, F, G) on average values, Two-way RM ANOVA with Šídák’s multiple comparisons test (H, I), Two-tailed unpaired Student´s t test (J, K), ordinary one-way ANOVA with Dunnett’s multiple comparisons test (L), Log-rank (Mantel-Cox) test (M). Source data are provided as a Source Data file.
Fig. 2
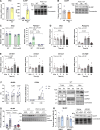
Fig. 2. SLIRP has increased mitochondrial localization upon exercise and is a target of PGC-1α.
A RT-qPCR analysis of Slirp transcript levels relative to Actb levels and Western blot analysis of SLIRP protein abundance in quadriceps with skeletal-muscle-specific transgenic expression of PGC-1α1 (α1 OE; mRNA: n = 8/group; protein: WT, n = 9; α1 OE, n = 11). B Western blot analysis of SLIRP protein abundance in gastrocnemius with skeletal-muscle-specific transgenic expression of PGC-1α4 (α4 OE; WT, n = 9; α4 OE, n = 6). C RT-qPCR analysis of Slirp and Ppargc1α transcript levels relative to Hprt levels in gastrocnemius of muscle-specific PGC-1α knockout (PGC-1α mKO) and littermate control (WT) mice at rest and 3 h after acute exercise bout (WT, rest/3 h, n = 8/7; PGC-1α mKO, rest/3 h, n = 5/6). D, E RT-qPCR analysis of Slirp, Ppargc1α, mt-Nd1, mt-Co1, mt-Co2, and mt-Atp6, transcript levels relative to Actb levels in WT quadriceps at rest, immediately after, 2 h, 6 h or 24 h after acute exercise bout (n = 8/group). F Western blot analysis of SLIRP protein content in whole-quadriceps lysate, and SLIRP and COX4 protein content in cytosolic and mitochondrial fractions, isolated from WT quadriceps at rest and 2 h after in situ contraction (n = 4/group). G Western blot analysis of SLIRP protein abundance in quadriceps of sedentary (SED) and 12-week ET PGC-1α mKO and WT mice (WT SED/ET, n = 10/10; PGC-1α mKO SED/ET, n = 8/10). H Western blot analysis of SLIRP protein abundance in quadriceps of muscle-specific AMPKα1 and -α2 double KO (mDKO) and WT mice treated with/without AICAR (WT, saline/AICAR, n = 5/4; mDKO, saline/AICAR, n = 6/7). Data are means ± SEM, including individual values. Geno, main effect of genotype; Ex, main effect of acute exercise; Geno x Ex, interaction between genotype and acute exercise. *p < 0.05, ***p < 0.001, as per Two-tailed unpaired Student´s t test (A, B, F), Two-way ANOVA with Šídák’s multiple comparisons test (C, G, H), and ordinary one-way ANOVA with Dunnett’s multiple comparisons test (D, E). Source data are provided as a Source Data file.
Fig. 3
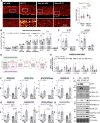
Fig. 3. SLIRP is dispensable for organismal adaptations to ET, yet, needed for improving blood glucose regulation after ET in male mice.
A Experimental design of 10-week exercise training (ET) intervention. Graphical illustration created in BioRender. Pham, T. (2023) BioRender.com/i39k213. B Average running distance of male and female ET Slirp KO or littermate control (WT) mice measured for 6 weeks (male/female: WT ET, n = 8/6; Slirp KO, n = 7/10); (blue) male, ◇ (red) female). C Average food intake of male and female sedentary (SED) and ET Slirp KO or WT mice measured for 2 weeks after 4 weeks of running (male/female: WT SED, n = 5/3; WT ET, n = 6/4; Slirp KO SED, n = 5/8; Slirp KO ET, n = 5/7), (blue) male, ◇ (red) female). DK Blood glucose levels following a 4-hour fasting period before the glucose tolerance test (GTT). Glucose tolerance of male and female SED and ET Slirp KO or WT mice after 7-weeks of ET. iAUC of glycemic excursion in response to bolus of glucose 2 g kg−1 body weight (BW). Insulin response before (0 min) and following (20 min) the oral glucose challenge (male/female: WT SED, n = 6/6; WT ET, n = 7/6; Slirp KO SED, n = 7/11; Slirp KO ET, n = 7/10. male, ◇ female). Data are means ± SEM, including individual values where applicable. Geno, main effect of genotype; ET, main effect of exercise training; Acute exercise, main effect of acute exercise bout; Time X Geno ET, interaction between glucose bolus and genotype in the ET groups. *p < 0.05, **p < 0.01; E WT ET vs. KO ET, *p < 0.05; WT SED vs. WT ET, #p < 0.05, as per Two-tailed unpaired Student´s t test (B), Two-way RM ANOVA with Šídák’s multiple comparisons test in ET groups (E, I), Two-way ANOVA (C, D, F, G, H, J, K). Source data are provided as a Source Data file.
Fig. 4
Fig. 4. Exercise training reverses SLIRP-induced defects in muscle mitochondrial structure and respiration despite sustained reductions of mitochondrial transcripts.
A Confocal microscopy of mitochondrial network structure using a mitochondrial membrane potential probe (TMRE + ) in flexor digitorum brevis muscle fibers of sedentary (SED) and 10-week ET Slirp knockout (KO) mice and littermate controls (WT) (male/female: WT SED, n = 1/3; WT ET, n = 2/2; Slirp KO SED, n = 3/2; Slirp KO ET, n = 2/2. 7–10 fibers per mouse, male, ◇ female), and corresponding fragmentation index. SED data also depicted in Fig. 1D. B Mitochondrial respiration measured by Oroboros respirometry system in gastrocnemius of SED and ET Slirp KO and WT (male/female: WT SED, n = 4/4; WT ET, n = 5/2; Slirp KO SED, n = 5/5; Slirp KO ET, n = 6/5. male, ◇ female). SED data is also depicted in Fig. 1H. C Western blot analysis of SLIRP and LRPPRC protein abundance in gastrocnemius of male SED and 10-week ET Slirp KO and WT mice (WT SED/ET, n = 6/8; Slirp KO SED/ET, n = 7/6). D Schematic of mtDNA- and nuclear DNA-encoded oxidative phosphorylation (OXPHOS) proteins analysed. Graphical illustration created in BioRender. Pham, T. (2022) BioRender.com/n94e933. E RT-qPCR analysis of mitochondrial transcript levels in gastrocnemius of male SED and ET Slirp KO and WT mice (WT SED/ET, n = 6/7; Slirp KO SED/ET, n = 7/6). SED data also depicted in Fig. 1J. FH Western blot analysis of (F) mtDNA-encoded proteins, MT-ND3 (CI), MT-CO1 (CIV), MT-ATP6 (ATPase), (G) nDNA-encoded proteins NDUFB8 (CI), SDHB (CII), UQCRC2 (CIII) and ATP5A (ATPase), (H) MTCO1/ATP5A ratio as readout of mitonuclear balance, and (I) representative blots in gastrocnemius of male SED and ET Slirp KO and WT mice (WT SED/ET, n = 6/8; Slirp KO SED, n = 7/6). Data are means ± SEM, including individual values. Geno, main effect of genotype; ET, main effect of exercise training; Geno x ET, interaction between genotype and exercise training; Substrate, main effect of substrate. *p < 0.05, **p < 0.01, ***p < 0.01 as per Two-way ANOVA with Šídák’s multiple comparisons test (A, B, C, E, FH). Source data are provided as a Source Data file.
Fig. 5
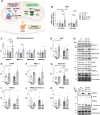
Fig. 5. Exercise training increases mitoribosomal biogenesis and mitochondrial quality control.
A Schematic of proteins associated with mitoribosomal biogenesis and mitochondrial quality control analysed. Graphical illustration created in BioRender. Pham, T. (2024) BioRender.com/y84d051. B RT-qPCR analysis of 12S rRNA and 16S rRNA in gastrocnemius of male sedentary (SED) and exercise trained (ET) Slirp knockout (KO) and control littermate (WT) mice (WT SED/ET, n = 6/7; Slirp KO SED/ET, n = 7/6). CL Western blot analysis of mitoribosomal proteins (MRPL11, MPRL12, MRPS18B, MRPS35; C), rpS6 (D), LONP1 (E), YME1L1 (F), phospho-EIF2α S51 (G), PRDX3 (I), PRDX3 dimer/monomer ratio (J), PRDX2 (K), and representative blots (H, L) in gastrocnemius of male sedentary (SED) and exercise trained (ET) Slirp knockout (KO) and control littermate (WT) mice (WT SED/ET, n = 6/8; Slirp KO SED/ET, n = 7/6). Data are means ± SEM, including individual values. Geno, main effect of genotype; ET, main effect of exercise training; *p < 0.05, **p < 0.01, as per Two-way ANOVA (BG, IK). Source data are provided as a Source Data file.
Fig. 6
Fig. 6. In human skeletal muscle SLIRP and LRPPRC protein content are increased by exercise training.
A Western blot analysis of SLIRP and LRPPRC protein in the vastus lateralis muscle of healthy young women (n = 9/group, ( Pre ET, □ Post ET)) before and after a 14-week controlled aerobic and strength exercise training (ET) intervention. B Immunoblotting of SLIRP and LRPPRC protein in the vastus lateralis muscle of healthy young men (n = 6/group, ( Pre ET, □ Post ET)) before and after a 6-week high intensity interval training (HIIT). C, E Immunoblotting of SLIRP and LRPPRC (C), MRPL11 (E) protein in the vastus lateralis muscle of male young and older individuals before and after 12-week progressive resistance training (Young, Pre/Post, n = 10/6; Old, Pre/Post, n = 11/9. Pre ET, □ Post ET). D RT-qPCR analysis of mitochondrial transcript levels in the vastus lateralis muscle of male young and older individuals before and after 12-week progressive resistance training (Young, Pre/Post, n = 9/7; Old, Pre, n = 10/8. Pre ET, □ Post ET). F, H Immunoblotting of SLIRP, LRPPRC (F), and MT-CO2 (H) protein in the vastus lateralis muscle of glucose-tolerant lean, obese males, and males with type 2 diabetes before and after high-intensity interval training (Con, n = 16; OB, n = 15, T2D, n = 13; pre ET, □ post ET). Con, control; OB, obese; T2D, Type 2 diabetes. G RT-qPCR analysis of mitochondrial transcript levels in the vastus lateralis muscle of glucose-tolerant lean, obese males, and males with type 2 diabetes before and after high-intensity interval training (Con, Pre/Post, n = 13/10; OB, Pre/Post, n = 10/8; T2D, Pre/Post, n = 9/6; pre ET, □ post ET). Data presented as individual before-and-after values. ET, main effect of exercise training, ET x T2D, Interaction between exercise training and presence of type 2 diabetes in Con and T2D group; *p < 0.05, **p < 0.01, ***p < 0.001, as per two-tailed paired Student´s t test (AC), Mixed-effects, REML model (D, E, G), Two-way RM ANOVA with Šídák’s multiple comparisons test (F, H). Source data are provided as a Source Data file.
Fig. 7
Fig. 7. llustration of findings obtained in the current study.
Graphical illustration created in BioRender. Pham, T. (2023) BioRender.com/m15m010.

References

    1. Romanello, V. & Sandri, M. The connection between the dynamic remodeling of the mitochondrial network and the regulation of muscle mass. Cell Mol. Life Sci.78, 1305–1328 (2021). - PMC - PubMed
    1. Distefano, G. et al. Physical activity unveils the relationship between mitochondrial energetics, muscle quality, and physical function in older adults. J. Cachexia Sarcopenia Muscle9, 279–294 (2018). - PMC - PubMed
    1. Gonzalez-Freire, M. et al. Reconsidering the role of mitochondria in aging. J. Gerontol. A Biol. Sci. Med Sci.70, 1334–1342 (2015). - PMC - PubMed
    1. Janssen, I., Heymsfield, S. B. & Ross, R. Low relative skeletal muscle mass (sarcopenia) in older persons is associated with functional impairment and physical disability. J. Am. Geriatr. Soc.50, 889–896 (2002). - PubMed
    1. Short, K. R. et al. Decline in skeletal muscle mitochondrial function with aging in humans. Proc. Natl Acad. Sci. USA102, 5618–5623 (2005). - PMC - PubMed

Publication types

MeSH terms

LinkOut - more resources