. 2024 Nov 13;15(1):9822.
doi: 10.1038/s41467-024-54256-4.

PPP1R2 stimulates protein phosphatase-1 through stabilisation of dynamic subunit interactions

Affiliations

PPP1R2 stimulates protein phosphatase-1 through stabilisation of dynamic subunit interactions

Sarah Lemaire et al. Nat Commun. .

Abstract

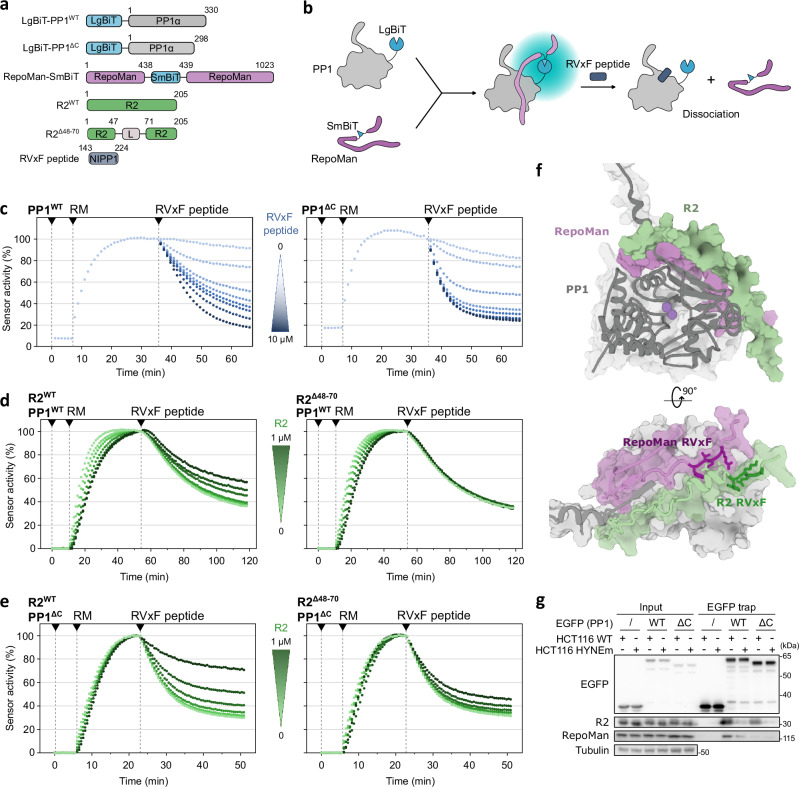
Protein Ser/Thr phosphatase PP1 is always associated with one or two regulatory subunits or RIPPOs. One of the earliest evolved RIPPOs is PPP1R2, also known as Inhibitor-2. Since its discovery nearly 5 decades ago, PPP1R2 has been variously described as an inhibitor, activator or (metal) chaperone of PP1, but it is still unknown how PPP1R2 affects the function of PP1 in intact cells. Here, using specific research tools, we demonstrate that PPP1R2 stabilises a subgroup of PP1 holoenzymes, exemplified by PP1:RepoMan, thereby promoting the dephosphorylation of their substrates. Mechanistically, the recruitment of PPP1R2 disrupts an inhibitory, fuzzy interaction between the C-terminal tail and catalytic domain of PP1, and generates an additional C-terminal RepoMan-interaction site. The resulting holoenzyme is further stabilized by a direct PPP1R2:RepoMan interaction, which renders it refractory to competitive disruption by RIPPOs that do not interact with PPP1R2. Our data demonstrate that PPP1R2 modulates the function of PP1 by altering the balance between holoenzymes through stabilisation of specific subunit interactions.


Conflict of interest statement

Competing interests The authors declare no competing interests.

Figures

Fig. 1
Fig. 1. Reduced proliferation of HCT116-degron cells after R2 depletion.
a Scheme of Dox/IAA-induced degradation of R2 in the HCT116-degron cell line. b Localization of R2-mAID-mClover in untreated R2-degron cells. Fixed cells were analysed for mClover-fluorescence and stained with DAPI. Scale bars are 10 µm. c Parental (PTN) and R2-degron cells were incubated for the indicated time points with 2 µg/ml Doxycycline (Dox) and/or 500 µM IAA. The panel shows the time-dependent degradation of R2-mAID-mClover in the R2-degron cell line and the re-appearance of R2-mAID-mClover after drug washout. Tubulin and PP1 were used as loading controls. This is a representative experiment of three biological repeats. d Cell-proliferation rate of PTN and R2-degron cells, before and after Dox/IAA treatment, as derived from sulforhodamine B (SRB) assays. A non-linear regression analysis was conducted to compare proliferation curves between untreated and treated conditions over multiple time points, the significance level is indicated (****, P < 0.0001). The data represents the mean values ± SD of 6 technical repeats.
Fig. 2
Fig. 2. Protein hyper-phosphorylation in R2-depleted HCT116 cells.
a The depletion of R2-mAID-mClover does not affect PP1 levels. GAPDH was used as loading control. Representative of 2 biological repeats. b PP1, purified from PTN and R2-degron cells, was assayed with phosphorylase a as substrate, with or without 1.35 nM NIPP1. A Two-Way ANOVA with Sidak’s multiple comparisons did not disclose significant differences (ns). The data represent the means ± SD for 3 biological repeats. c Volcano plot of the phosphoproteome of R2-depleted HCT116 cells as compared to Dox/IAA-treated parental cells. The colored dots show different values (P ≤ 0.05) in two-tailed Student’s t-test. d Gene-ontology pathway analysis (DAVID) of the phosphoproteome in R2-depleted cells (the full human proteome was used as a background in the analysis). e PTN and R2-degron cells, treated −/+ Dox/IAA, were non-synchronized (NS) or synchronized at the G2/M transition with RO3306. The time points indicate the washout from RO3306. Cell lysates were prepared in the presence of phosphatase inhibitors and used for immunoblotting. Tubulin was used as loading control. Representative image of 3 biological repeats. f Quantification of PP1T320ph (means ± SD; n = 3 biological repeats) for the experiment shown in panel (e). A multiple unpaired t-test was used to compare differences between PTN and R2-degron cell lines: **, P ≤ 0.01; ***, P ≤ 0.001; ****, P ≤ 0.0001. g Quantification of H3T3ph (means ± SD; n = 3 biological repeats). A multiple unpaired t-test was used to compare differences between PTN and R2-degron cell lines: **, P ≤ 0.01; ***, P ≤ 0.001; ****, P ≤ 0.0001. h Kinase-shutoff assay in PTN and R2-degron cells. Cells were treated with Dox/IAA for 48 h prior to calyculin-A treatment (25 nM for 30 min). Subsequently, the cells were released in medium with 10 µM staurosporine to allow dephosphorylation by endogenous phosphatases. At the indicated time points before and after calyculin-A washout, cell lysates were probed for R2, PP1 and PP1T320ph. Representative image of 2 biological repeats.
Fig. 3
Fig. 3. A R2-HYNEm knock-in recapitulates the phenotype of R2 depletion.
a Crystal structure of PP1:R2 (PDB 2O8A) with the known PP1-binding motifs marked (upper panel). The position of the specific SILK (GILK) and RVxF (SQKW) sequences of R2 are shown as well as the HYNE sequence within the IDoHA motif. Also shown is the position of these motifs within R2 and the generated R2 mutants (m) (lower panel). b Traps of the indicated EGFP-tagged R2 variants, transiently expressed in HEK293T cells, were analysed for the presence of PP1. c Quantification of the data shown in panel (b). Results are means ± SD for n = 5 biological repeats. A One-Way ANOVA with Dunnett’s multiple comparisons test was performed (*, P ≤ 0.05; ***, P ≤ 0.001; ****, P ≤ 0.0001). d Validation of one of two generated HYNEm HCT116 knock-in cell lines by DNA-sequence analysis of the PCR products that amplified the indicated R2 fragment. e Cell proliferation of the WT and HYNEm knock-in cell lines, as derived from IncuCyte analysis. The average of two different clones was used (data represents mean ± SD for n = 3 biological repeats per clone). A non-linear regression analysis was conducted to compare proliferation curves between untreated and treated conditions over multiple time points, the significance level is indicated (****, P ≤ 0.0001). f WT and HYNEm-knock-in cells, treated ± Dox/IAA, were non-synchronized (NS) or synchronized at the G2/M transition with RO3306. The time points indicate the washout from RO3306. Cell lysates were prepared in the presence of phosphatases inhibitors and processed for immunoblotting with the indicated antibodies. Representative image of 3 biological repeats. g Quantification of PP1T320ph (means ± SD; n = 3 biological repeats). A multiple unpaired t-test was used to compare differences between WT and HYNEm knock-in cell lines: **, P < 0.01. h Quantification of H3T3ph (means ± SD; n = 3 biological repeats).
Fig. 4
Fig. 4. The interactome of R2-mAID-mClover in HCT116 cells.
a Scheme for the synchronization of HCT116 R2-degron cells in mitosis and early interphase. EGFP-trapped R2-mAID-mClover was analyzed for interacting proteins by mass spectrometry (MS). b Normalized abundance of R2 interactors in mitosis and interphase. c Heatmap of R2-binding RIPPOs and RIPPO-interacting protein during mitosis and early interphase. d EGFP traps of R2-mAID-mClover from mitotically-arrested and released parental (PTN) and R2-degron cells confirmed the association of URI, RepoMan and PNUTS with R2-mAID-mClover. The binding of RepoMan was only detected during mitosis when RepoMan is most abundant. e Traps of EGFP-RepoMan (RM)-WT and the PP1-binding mutant EGFP-RM-RATA transiently expressed in HEK293T cells only show association of R2 with RepoMan-WT.
Fig. 5
Fig. 5. R2 disrupts the interaction between the C-terminus and catalytic domain of PP1.
a Model of PP1α from the indicated species, as present in the AlphaFold Structural Database (EMBL-EBI), shows docking of the C-terminal tail in the acidic and hydrophobic grooves, thereby occluding the active site. The catalytic-site metals are shown as purple spheres in the enlarged inset. b Snapshots of the conformation of the C-terminal tail of PP1α during a 150-nanosecond all-atom molecular dynamics simulation of the catalytic subunit of PP1α. The catalytic domain of PP1α (residues 1–298) is represented as a gray surface, and the overlaid conformations of PP1 C-terminus (residues 299–330) at various intervals during the simulation in color. c Alignment of 50 AlphaFold-Multimer structural models of the complex between full-length PP1α and R2. The catalytic domain of PP1 is shown as a light-gray surface. The C-terminus of PP1 (dark gray) and R2 (green) are shown as ribbons for each individual model and are superimposed on the structure of human PP1α (PDB: 4MOV). Residues with low confidence scores (pLDDT <35) are not shown. d Illustration of the principle behind the nanoBRET sensor used to measure the average distance between the N- and C-termini of PP1, and to differentiate between a C-terminus that is unbound (low BRET) or docked at the active site (high BRET). e Full-spectrum measurement of the PP1-BRET sensor upon addition of the indicated concentrations of HIS-ASPP1-(867–1090). The luminescence spectrum of an unlabeled sensor lacking the NanoBRET 618 ligand is shown to indicate the baseline. In the presence of NanoBRET 618 (labeled sensor), the sensor activity is revealed. Also shown is the loss of BRET signal after addition of the indicated concentration of HIS-ASPP1-(867–1090), an established interactor of the C-terminal tail of PP1. f Dose-response curve showing the BRET signal upon addition of increasing concentrations of HIS-R2-WT or HIS-R2-(1–129). The results are depicted as means ± SEM of 6 technical replicates from 2 independent experiments.
Fig. 6
Fig. 6. Inhibition of PP1 by its C-terminal tail.
a Multiple protein-sequence alignment of the PP1 C-terminus. The sequences were obtained from unifrop.org: H. sapiens, P62136 (PP1CA), P62140 (PP1CB) and P36873 (PP1CC), A. thaliana, A0A178V1Q1; D. melanogaster, A0A0B4KHS9; C. elegans, P48727 and S. pombe, P13681. Sequences were aligned with ClustelOmega. Jalview (v2.11.3.2) was used to generate the conservation code. b Cartoons of the generated PP1α variants. c Phosphatase activities of GST-tagged PP1α-WT, PP1α-ΔC, PP1α-ΔPR and PP1α−4xPR (1–1.25 nM), assayed with DiFMUP (750 µM), a histone H3 peptide (H3T3ph, 750 µM) and glycogen phosphorylase a (10 µM) as substrates. Results are shown as means ± SD. The dots represent independent assays. P values were from Student’s unpaired two-tailed t-test. d GST-PP1α variants (1.25 nM) were assayed with DiFMUP. e Vmax and KM values were derived from kinetic curves, as shown in panel (d), using GraphPad Software. Values of Vmax are nmol of Pi released (mg of protein)/min. KM values are represented in µM. The data in panels (d) and (e) are represented as means ± SEM of independent assays (n is indicated in Fig. 6e). The P-values in panel (e) were obtained using Student’s unpaired two-tailed t-test. f GST-tagged PP1α-WT and PP1α-ΔC were assayed with DiFMUP (750 µM) and the indicated concentrations of Na3PO4 (Pi). The curves were generated using a four-parameter logistic equation. IC50 values were compared using Student’s unpaired two-tailed t-test (***, P < 0.001). Error bars and IC50 values are shown as means ± SD of 3 independent assays. g Effect of RepoMan-(1–630) (50 nM) on the inhibition of GST-PP1α-WT (1 nM) by GST-R2. Results are represented as means ± SEM of 6 independent assays. ****, P < 0.0001 using Student’s unpaired t-test. h Activity of PP1:RepoMan, immunoprecipitated from Dox/IAA-treated PTN and R2-degron cell lines and assayed with H3T3ph (100 µM), in the absence and presence of 1 μM microcystin. The results are expressed as a % of the activities in the parental cell line and shown as means ± SD of 3 biological repeats (n = 3). A Student’s unpaired two-tailed t-test did not show a significant difference in the absence of microcystin (ns).
Fig. 7
Fig. 7. The interactome of the C-terminal tail of PP1a.
a EGFP-tagged PP1α−4xPR or PP1α-ΔC mutants were transiently transfected in non-synchronized HEK293T cells, trapped from cell lysates after 24 h, and analysed by mass spectrometry. The panel shows a volcano plot for the differentially associated proteins. Each dot on the plot represents a polypeptide that exhibits a differential binding to PP1α−4xPR versus PP1α-ΔC. The plot is based on two parameters: fold-change (Log2 of the fold-change (FC)) and statistical significance (Log10 of the P-value (threshold of P < 0.05)). The vertical gray lines indicate a fold change of 1.5. P values were determined using a 2-sided t-test of 3 biological repeats (n = 3). The corresponding P- and Q-values can be found in Supplementary Data 4. b Heatmap depicting the quantitative proteome differences in core proteins of the PNUTS/PTW and the URI/PPP1R19 complexes. Each condition is represented by 3 biological repeats (each lane represents 1 repeat). c HEK293 cells were transiently transfected with EGFP-tagged β-Galactosidase (β-GAL), PP1α−4xPR and PP1α-ΔC for 24 h. EGFP-traps of the lysates were immunoblotted for EGFP, URI and PNUTS. GAPDH served as loading control, immunoblotted in the same gel as for the EGFP (uncropped blots can be found in the Source Data). Shown immunoblots are representative of 3 (PNUTS immunoblot) or 2 (URI immunoblot) biological repeats.
Fig. 8
Fig. 8. Stabilisation of PP1:RepoMan by R2.
a Diagrams of the recombinant split-luciferase constructs and competitor proteins used in panels (ce). L = 24-resisue flexible GS linker. b Cartoon representation of the principle of split-luciferase assays shown in panels (ce). c Kinetic-trace experiments showing the gradual association of the LgBit-PP1WT/ΔC:RepoMan-SmBit sensors and their dissociation by addition of varying concentrations of RVxF competitor (NIPP1-(143-224) (0.64, 3.2, 16, 80, 400, 2000 or 10,000 nM). Data is plotted as the average of 2 technical repeats and normalized to the timepoint directly before competitor addition. For the association phase, only the control condition is plotted. d Kinetic-trace experiments showing the gradual association of LgBit-PP1WT:RepoMan-SmBit in the presence of varying concentrations of untagged R2WT or R2Δ48-70 (0.32, 1.6, 8, 40, 200 or 1000 nM), followed by dissociation with a fixed concentration of RVxF peptide (1 µM). Data is plotted as in (c). e Same as (d) but for LgBit-PP1ΔC:RepoMan-SmBit. f Structural model of PP1α:R2:RepoMan-(341-450), generated by AlphaFold-multimer. The regions of R2 and RepoMan that are predicted to make direct contacts with each other and with the C-terminal tail of PP1 are depicted as green and pink cartoons, respectively. The RVxF-motifs of both proteins are highlighted. g EGFP-tagged PP1-WT and PP1-ΔC were transiently (48 h) expressed in HCT116 parental cells or R2-HYNEm knock-in cells. EGFP traps were probed for EGFP, R2 and RepoMan. Tubulin served as loading control.
Fig. 9
Fig. 9. Model of the regulation of PP1 (holoenzymes) by PPP1R2.
The figure shows models of PP1, PP1:R2, PP1:RepoMan and R2:PP1:RepoMan, based on available crystal structures and the data reported in this study. The C-terminal tail of PP1 is inhibitory because it dynamically docks to the active site (Fig. 5). R2 recruitment releases the C-terminal tail from the active site due to competition for an overlapping docking site on the catalytic domain. RepoMan does not interfere with the docking of the C-terminal tail of PP1. However, in the R2:PP1:RepoMan complex, the C-terminal tail of PP1 is displaced and associates with both R2 and RepoMan (Fig. 8). In addition, the degenerate RVxF motif of R2 is out-competed by the canonical RVxF motif of RepoMan, and RVxF-flanking residues of R2 directly interact with RepoMan. The additional, composite binding site for RepoMan created by R2 recruitment makes the complex resistant to dynamic exchange with RIPPOs that do not interact with R2.

References

    1. Brautigan, D. L. & Shenolikar, S. Protein serine/threonine phosphatases: keys to unlocking regulators and substrates. Annu. Rev. Biochem.87, 921–964 (2018). - PubMed
    1. Egloff, M. P., Cohen, P. T. W., Reinemer, P. & Barford, D. Crystal structure of the catalytic subunit of human protein phosphatase 1 and its complex with tungstate. J. Mol. Biol.254, 942–959 (1995). - PubMed
    1. Goldberg, J. et al. Three-dimensional structure of the catalytic subunit of protein serine/threonine phosphatase-1. Nature376, 745–753 (1995). - PubMed
    1. Heroes, E. et al. The PP1 binding code: a molecular-lego strategy that governs specificity. FEBS J.280, 584–595 (2013). - PubMed
    1. Wu, D. et al. A substrate-trapping strategy for protein phosphatase PP1 holoenzymes using hypoactive subunit fusions. J. Biol. Chem.293, 15152–15162 (2018). - PMC - PubMed

Publication types

LinkOut - more resources