

Comparison of AI software tools for automated detection, quantification and categorization of pulmonary nodules in the HANSE LCS trial
- PMID: 39537690
- PMCID: PMC11561337
- DOI: 10.1038/s41598-024-78568-z
Comparison of AI software tools for automated detection, quantification and categorization of pulmonary nodules in the HANSE LCS trial
Abstract
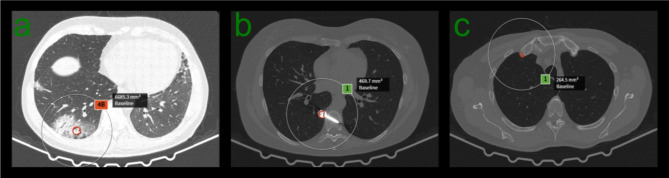
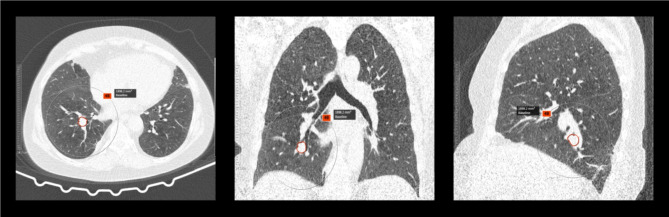
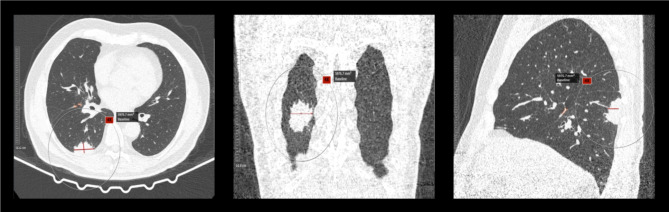
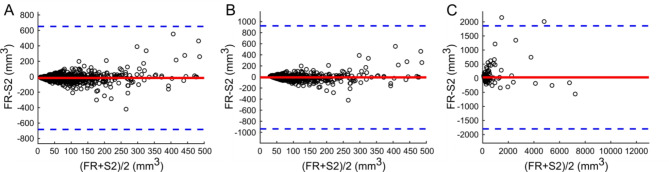
Participant management in a lung cancer screening (LCS) depends on the assigned Lung Imaging Reporting and Data System (Lung-RADS) category, which is based on reliable detection and measurement of pulmonary nodules. The aim of this study was to compare the agreement of two AI-based software tools for detection, quantification and categorization of pulmonary nodules in an LCS program in Northern Germany (HANSE-trial). 946 low-dose baseline CT-examinations were analyzed by two AI software tools regarding lung nodule detection, quantification and categorization and compared to the final radiologist read. The relationship between detected nodule volumes by both software tools was assessed by Pearson correlation (r) and tested for significance using Wilcoxon signed-rank test. The consistency of Lung-RADS classifications between Software tool 1 (S1, Aview v2.5, Coreline Soft, Seoul, Korea) and Software tool 2 (S2, Prototype ''ChestCTExplore'', software version ToDo, Siemens Healthineers, Forchheim, Germany) was evaluated by Cohen's kappa (κ) and percentual agreement (PA).The derived volumes of true positive nodules were strongly correlated (r > 0.95), the volume derived by S2 was significantly higher than by S1 (P < 0.0001, mean difference: 6mm3). Moderate PA (62%) between S1 and S2 was found in the assignment of Lung-RADS classification (κ = 0.45). The PA of Lung-RADS classification to final read was 75% and 55% for S1 and S2, but the incorporation of S1 into the initial nodule detection and segmentation must be considered here. Significant nodule volume differences between AI software tools lead to different Lung-RADS scores in 38% of cases, which may result in altered participant management. Therefore, high performance and agreement of accredited AI software tools are necessary for a future national LCS program.
© 2024. The Author(s).
Conflict of interest statement
Figures


Similar articles
-
Comparison of three software systems for semi-automatic volumetry of pulmonary nodules on baseline and follow-up CT examinations.Acta Radiol. 2014 Jul;55(6):691-8. doi: 10.1177/0284185113508177. Epub 2013 Oct 16. Acta Radiol. 2014. PMID: 24132766 Clinical Trial.
-
Cause determination of missed lung nodules and impact of reader training and education: Simulation study with nodule insertion software.J Cancer Res Ther. 2020 Jul-Sep;16(4):780-787. doi: 10.4103/jcrt.JCRT_312_17. J Cancer Res Ther. 2020. PMID: 32930118
-
Malignancy risk estimation of screen-detected nodules at baseline CT: comparison of the PanCan model, Lung-RADS and NCCN guidelines.Eur Radiol. 2017 Oct;27(10):4019-4029. doi: 10.1007/s00330-017-4767-2. Epub 2017 Mar 14. Eur Radiol. 2017. PMID: 28293773 Free PMC article.
-
Subsolid pulmonary nodule management and lung adenocarcinoma classification: state of the art and future trends.Semin Roentgenol. 2013 Oct;48(4):295-307. doi: 10.1053/j.ro.2013.03.013. Semin Roentgenol. 2013. PMID: 24034262 Review. No abstract available.
-
Radiomics and artificial intelligence for risk stratification of pulmonary nodules: Ready for primetime?Cancer Biomark. 2025 Jan;42(1):CBM230360. doi: 10.3233/CBM-230360. Epub 2024 Feb 6. Cancer Biomark. 2025. PMID: 38427470 Free PMC article. Review.
Cited by
-
Artificial intelligence in automated detection of lung nodules: a narrative review.Int J Physiol Pathophysiol Pharmacol. 2025 Apr 25;17(2):45-51. doi: 10.62347/YHID9574. eCollection 2025. Int J Physiol Pathophysiol Pharmacol. 2025. PMID: 40401117 Free PMC article. Review.
-
[Influence of artificial intelligence on decisions in radiology using the example of lung cancer screening].Radiologie (Heidelb). 2025 Sep;65(9):700-704. doi: 10.1007/s00117-025-01496-0. Epub 2025 Aug 1. Radiologie (Heidelb). 2025. PMID: 40748377 Free PMC article. German. No abstract available.
References
-
- Smith, R. A. et al. Cancer screening in the United States, 2018: A review of current American Cancer Society guidelines and current issues in cancer screening. CA Cancer J. Clin.68, 297–316 (2018). - PubMed
-
- Zhao, Y. R. et al. NELSON lung cancer screening study. Cancer Imaging 11, Preprint at (2011). 10.1102/1470-7330.2011.9020
-
- Becker, N. et al. Lung cancer mortality reduction by LDCT screening—results from the randomized German LUSI trial. Int. J. Cancer. 146, 1503–1513 (2020). - PubMed
Publication types
MeSH terms
LinkOut - more resources
Full Text Sources
Medical
