. 2024 Nov 13;7(1):1502.
doi: 10.1038/s42003-024-07198-y.

Widespread co-release of glutamate and GABA throughout the mouse brain

Affiliations

Widespread co-release of glutamate and GABA throughout the mouse brain

Cesar C Ceballos et al. Commun Biol. .

Abstract

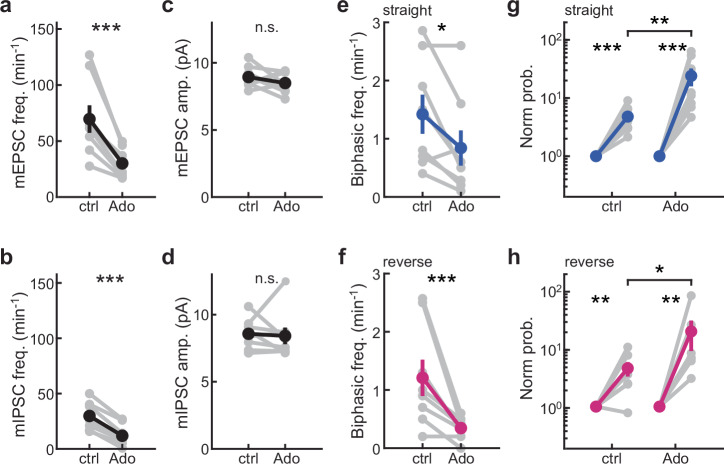
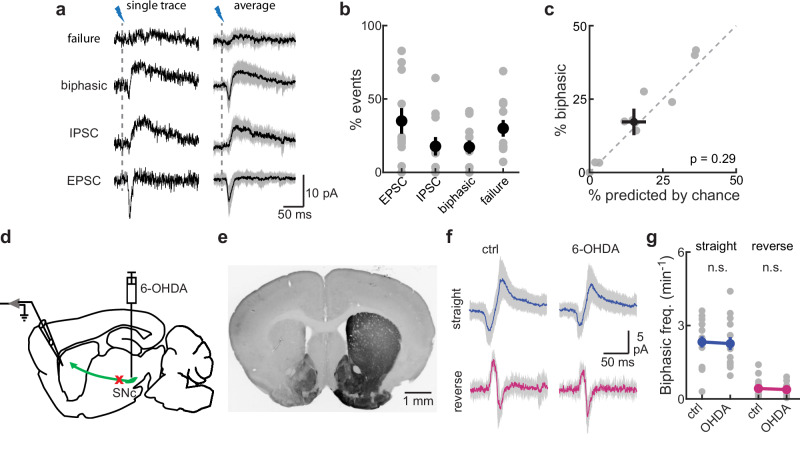
Several brain neuronal populations transmit both the excitatory and inhibitory neurotransmitters, glutamate, and GABA. However, it remains largely unknown whether these opposing neurotransmitters are co-released simultaneously or are independently transmitted at different times and locations. By recording from acute mouse brain slices, we observed biphasic miniature postsynaptic currents, i.e., minis with time-locked excitatory and inhibitory currents, in striatal spiny projection neurons. This observation cannot be explained by accidental coincidence of monophasic excitatory and inhibitory minis. Interestingly, these biphasic minis could either be an excitatory current leading an inhibitory current or vice versa. Deletion of dopaminergic neurons did not eliminate biphasic minis, indicating that they originate from another source. Importantly, we found that both types of biphasic minis were present in multiple striatal neuronal types and in nine out of ten other brain regions. Overall, co-release of glutamate and GABA appears to be a widespread mode of neurotransmission in the brain.


Conflict of interest statement

Competing interests The authors declare no competing interests.

Figures

Fig. 1
Fig. 1. Detection of straight biphasic minis in SPNs of the dorsolateral striatum.
a Example traces of miniature current recordings at different holding potentials (VH). b Example traces of a mIPSC (top) and a mEPSC (bottom). c Example traces of straight biphasic minis at VH = −30 mV. d Frequency (# events/min) of biphasic minis, mEPSCs and mIPSCs at VH = −30 mV. e Histogram of the onset delay between the mEPSC and mIPSC component used to fit the biphasic minis. Mean ± s.d. = 9.1 ± 3.9 ms. Inset, biphasic mini fit by a 7-ms delay. For panels ce n = 181 events, 11 neurons, and 4 mice. f, g Biphasic minis are abolished by either AMPAR (f) or GABAAR (g) antagonists (NBQX or GABAzine, respectively). The scale bars are applied to both panels. n (neurons/slices/mice) = 5/5/3 for both. Two-sided paired t-test on normalized data (to control). From top to bottom (except controls), p = 1.4 × 10−5, 0, 0, and 0; Cohen’s d = 3.71, 3.06, 0.87, and 0.87. h Average traces of biphasic minis at different holding potentials. i Voltage-dependent changes of the amplitude of the maximum and minimum peaks of the straight biphasic minis. j The probability of observed straight biphasic minis normalized to the probability of their occurrence due to coincidence of independent mEPSC and mIPSC (two-sided paired t-test on the logarithmic scale; p = 1.3 × 10−8; Cohen’s d = 2.77). n (neurons/slices/mice) = 11/7/4 for panels hj. ***p ≤ 0.001. All error bars represent s.e.m.
Fig. 2
Fig. 2. Reverse biphasic minis in SPNs of the dorsolateral striatum.
a Example traces with reverse biphasic minis (dashed red box). b Example traces of reverse biphasic minis at VH = −30 mV. c, d Reverse biphasic minis are abolished by NBQX (c) or GABAzine (GBZ; d). n (neurons/slices/mice) = 5/5/3 for both. Two-sided paired t-test on normalized data (to control). From left to right (except controls), p = 0, 0, 0, and 0; Cohen’s d = 1.26, 1.26, 0.81, and 0.81. e Histogram of the onset delay between the mEPSC and mIPSC component used to fit the biphasic minis. n = 151 events. Mean ± s.d. = 11.1 ± 3.9 ms. Inset, a reverse biphasic mini fit by a 6-ms delay. f The probability of observed reverse biphasic minis normalized to the probability of their occurrence due to coincidence of independent mEPSC and mIPSC. n (neurons/slices/mice) = 11/7/4 (two-sided paired t-test on the logarithmic scale, p = 0.0038, Cohen’s d = 0.99). g Example average traces of straight and reverse biphasic minis recorded in dSPNs and putative iSPNs. h, i Frequency (events/min) of straight (h) and reverse biphasic minis (i) from paired dSPNs and iSPNs at VH = −30 mV. n (neurons/slices/mice) = 8/5/2. Two-sided paired t-test. From h, i, p = 0.17 and 0.25; Cohen’s d = 0.55 and −0.45. jl Example average traces (j), frequency (k), and occurrence probability normalized to chance (l) of straight and reverse biphasic minis recorded in ChIN at VH = −30 mV. n (neurons/slices/mice) = 7/3/2 for straight and 6/3/2 for reverse. Two-sided paired t-test on the logarithmic scale, p = 9 × 10−6 and 0.01, Cohen’s d = 2.79 and 1.27. **p ≤ 0.01. ***p ≤ 0.001. All error bars represent s.e.m.
Fig. 3
Fig. 3. Adenosine decreased the number but not the probability of biphasic minis.
ad Frequency of mEPSCs (a) and mIPSCs (b), and amplitudes of mEPSCs (c) and mIPSCs (d) of SPN neurons before (ctrl) and after the bath application of 20 μM adenosine (Ado). e. f Frequency of straight (e) and reverse (f) biphasic minis before (ctrl) and after adenosine application (p = 0.025, p = 0.015 respectively). Two-sided paired t-test on normalized data (to control). From af, p = 1.0 × 10−6, 2.2 × 10−5, 0.35, 0.81, 0.021, and 6.9 × 10−4; Cohen’s d = 1.70, 3.54, 0.39, 0.10, 1.0, and 1.13. g, h The probability of observed straight (g) or reverse biphasic minis (h) normalized to the probability of their occurrence due to coincidence of independent mEPSC and mIPSC in the same cells before (ctrl) and after adenosine application. All recordings were done at −30 mV. n (neurons/slices/mice) = 8/8/3 for both control and adenosine application for panels ag, and 7/7/3 for panel h. Two-sided paired t-test on the logarithmic scale. For panel g (control and adenosine), p = 5.6 × 10−5 and 9.2 × 10−5; Cohen’s d = 3.05 and 2.82. For panel h (control and adenosine), p = 0.0084 and 0.0013; Cohen’s d = 1.46 and 2.15. *p ≤ 0.05, **p ≤ 0.01, and ***p ≤ 0.001. All error bars represent s.e.m.
Fig. 4
Fig. 4. Dopaminergic axons are not the major source of biphasic minis.
a Example single events observed upon minimal optogenetic stimulation with the same cell (left) and the class average (right). b Percentage of different types of events. n (neurons/slices/mice) = 11/8/3. c Scatter plots of chance versus probability of measured biphasic event frequency (two-sided sign test; p = 0.29; Cohen’s d = −0.55). d, e Unilateral injection of 6-OHDA assessed by tyrosine hydroxylase (TH) immunofluorescence in the striatum after 4 days. f, g Example traces of straight and reverse biphasic minis (f) and their frequency (g) recorded in control and 6-OHDA lesioned hemispheres. n (neurons/slices/mice) = 16/8/4 for ctrl, and 14/7/4 for 6-OHDA. Two-sided Wilcoxon rank sum test. For straight and reverse, p = 0.68 and 0.83; Cohen’s d = 0.071 and 0.14. All recordings were done at −30 mV. All error bars represent s.e.m.
Fig. 5
Fig. 5. Biphasic minis are widespread throughout the brain.
a Brain regions where electrophysiological recordings were done: the barrel cortex (BC), basolateral amygdala (BLA), CA1 region of hippocampus (CA1), cerebellum (Cb), cholinergic interneurons from dorsolateral striatum (ChIN), globus pallidus externa (GPe), medial prefrontal cortex (mPFC), spiny projection neurons (SPN) from dorsolateral striatum (STR), suprachiasmatic nucleus (SCN), substantia nigra pars compacta (SNc), ventral thalamus (Th), primary visual cortex (V1). bd Example of average traces (b), frequency (c), and probability normalized to chance (d) of straight biphasic minis across brain regions and cell types. From left to right in panels c, d n (neurons/slices/mice) = 14/6/3, 9/7/3, 10/4/2, 11/6/3, 7/3/2, 5/4/2, 11/3/3, 16/7/4, 8/3/3, 11/6/3, 6/4/3, and 5/3/2. In panel d two-sided paired t-test on the logarithmic scale. p = 4.2 × 10−6, 2.4 × 105, 2.0 × 10−6, 0.99, 3.2 × 10−4, 0.019, 7.3 × 10−8, 2.3 × 10−8, 0.017, 0.0018, 0.022, and 0.0023; Cohen’s d = 2.018, 2.89, 3.39, −0.002, 2.79, 1.69, 4.19, 2.65, 1.11, 1.27, 1.35, and 3.11. eg Example of average traces (e), frequency (f), and probability normalized to chance (g) of reverse biphasic minis across brain regions and cell types. From left to right in panels f and g, n (neurons/slices/mice) = 14/6/3, 8/7/3, 9/4/2, 11/6/3, 6/3/2, 4/4/2, 11/3/3, 16/7/4, 7/3/3, 11/6/3, 6/4/3, and 6/3/2. In panel g, two-sided paired t-test on the logarithmic scale. p = 7.3 × 10−4, 0.0074, 7.3 × 10−5, 0.043, 0.027, p = 0.56, 5.5 × 10−5, 3.8 × 10−5, 0.84, 0.78, 0.44, and 0.004; Cohen’s d = 1.17, 1.32, 2.48, −0.69, 1.27, −0.33, 2.01, 1.44, 0.081, 0.086, 0.34, and 2.051. All recordings were done at −30 mV (two-sided paired t-test). *p ≤ 0.05, **p ≤ 0.01, and ***p ≤ 0.001. All error bars represent s.e.m.

Update of

Similar articles

Cited by

References

    1. Dale, H. Pharmacology and nerve-endings (Walter Ernest Dixon Memorial Lecture): (Section of Therapeutics and Pharmacology). Proc. R. Soc. Med.28, 319–332 (1935). - PMC - PubMed
    1. Eccles, J. C., Fatt, P. & Koketsu, K. Cholinergic and inhibitory synapses in a pathway from motor‐axon collaterals to motoneurones. J. Physiol.126, 524–562 (1954). - PMC - PubMed
    1. Vaaga, C. E., Borisovska, M. & Westbrook, G. L. Dual-transmitter neurons: Functional implications of co-release and co-transmission. Curr. Opin. Neurobiol.29, 25–32 (2014). - PMC - PubMed
    1. Wallace, M. L. & Sabatini, B. L. Synaptic and circuit functions of multitransmitter neurons in the mammalian brain. Neuron111, 2969–2983 (2023). - PMC - PubMed
    1. Hnasko, T. S. & Edwards, R. H. Neurotransmitter corelease: mechanism and physiological role. Annu. Rev. Physiol.74, 225–243 (2012). - PMC - PubMed

LinkOut - more resources